1, ELK
1. ELK introduction
- ELK platform is a complete set of centralized log processing solution, which combines ElasticSearch, Logstash and Kiabana to meet more powerful user requirements for log query, sorting and statistics.
- Elastic search: it is a distributed storage search engine based on Lucene (a full-text search engine architecture), which is used to store all kinds of logs.
- Elasticsearch is developed in Java and allows users to communicate with elasticsearch through a browser through a RESTful Web interface.
- Elasticsearch is a distributed search and analysis engine. Its advantage is that it can store, search and analyze large amounts of data in near real time.
- Logstash: as a data collection engine. It supports dynamic data collection from various data sources, filtering, analyzing, enriching and unifying the data, and then storing it to the location specified by the user, which is generally sent to Elasticsearch.
- Logstash is written in JRuby language and runs on the Java virtual machine (JVM). It is a powerful data processing tool that can realize data transmission, format processing and formatted output. Logstash has powerful plug-in functions and is commonly used for log processing.
- Kiabana: it is based on node The display tool developed by. JS can provide a graphical log analysis Web interface display for Logstash and ElasticSearch, and can summarize, analyze and search important data logs.
- Filebeat: lightweight open source log file data collector. Usually, install filebeat on the client that needs to collect data and specify the directory and log format. Filebeat can quickly collect data and send it to logstash for parsing, or directly send it to Elasticsearch for storage. In terms of performance, it has obvious advantages over logstash running on JVM and is a substitute for it.
2. Role of ELK
- Logs mainly include system logs, application logs and security logs. System operation and maintenance personnel and developers can understand the software and hardware information of the server through the log, check the errors in the configuration process and the causes of the errors. Regular analysis of logs can understand the load, performance and security of the server, so as to take timely measures to correct errors.
- Often, the logs of a single machine can be basically analyzed by using grep, awk and other tools, but when the logs are scattered and stored on different devices. If you manage dozens or hundreds of servers, you are still using the traditional method of logging in to each machine in turn. Does this feel cumbersome and inefficient. It is imperative that we use centralized log management, such as the open source syslog, to collect and summarize the logs on all servers. After centralized log management, log statistics and retrieval become a more troublesome thing. Generally, we can use grep, awk, wc and other Linux commands to achieve retrieval and statistics, but we still have a little difficulty in using this method for higher requirements such as query, sorting and statistics and a large number of machines.
- Generally, a large-scale system is a distributed deployment architecture. Different service modules are deployed on different servers. When a problem occurs, it is necessary to locate the specific server and service module according to the key information exposed by the problem, and build a centralized log system, which can improve the efficiency of locating the problem.
3. Basic characteristics of complete log system
- Collection: it can collect log data from multiple sources
- Transmission: it can analyze, filter and transmit the log data to the storage system stably
- Storage: store log data
- Analysis: supports UI analysis
- Warning: it can provide error reporting and monitoring mechanism
4. How ELK works
- (1) Deploy Logstash on all servers that need to collect logs; Or you can centralize the log management on the log server and deploy Logstash on the log server.
- (2) Logstash collects logs, formats them and outputs them to the Elasticsearch cluster.
- (3) Elasticsearch indexes and stores formatted data.
- (4) Kibana queries the data from the ES cluster, generates charts, and displays the front-end data.
2, Deploy ELK log analysis system
1. Experimental requirements
1. Configure ELK log analysis cluster
2. Collecting logs using Logstash
3. Viewing analysis logs using Kibana
2. Environment configuration
| host | operating system | IP address | Installation package / software / tools |
|---|---|---|---|
| node1 | CentOS7 | 192.168.239.101 | Elasticsearch |
| node2 | CentOS7 | 192.168.239.102 | Elasticsearch |
| apache | CentOS7 | 192.168.239.103 | httpd / Logstash |
| Real machine | Windows | 192.168.239.100 | - |
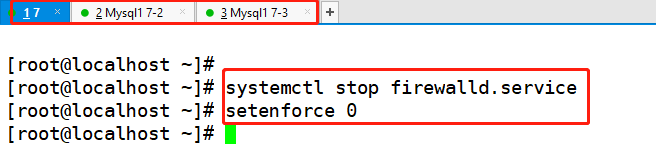
All nodes, turn off the system firewall and security mechanism
systemctl stop firewalld.service
setenforce 0
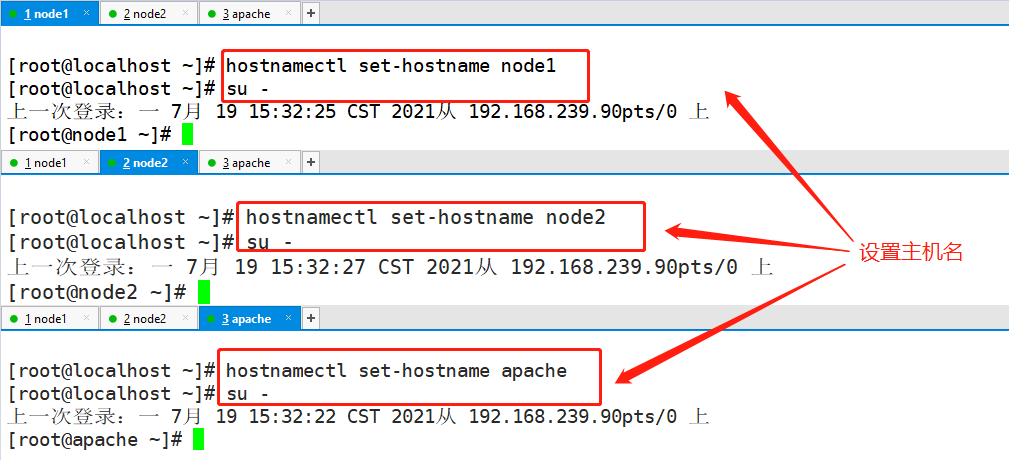
node1(192.168.239.101)
hostnamectl set-hostname node1
su -
node2(192.168.239.102)
hostnamectl set-hostname node2
su -
apache(192.168.239.103)
hostnamectl set-hostname apache
su -
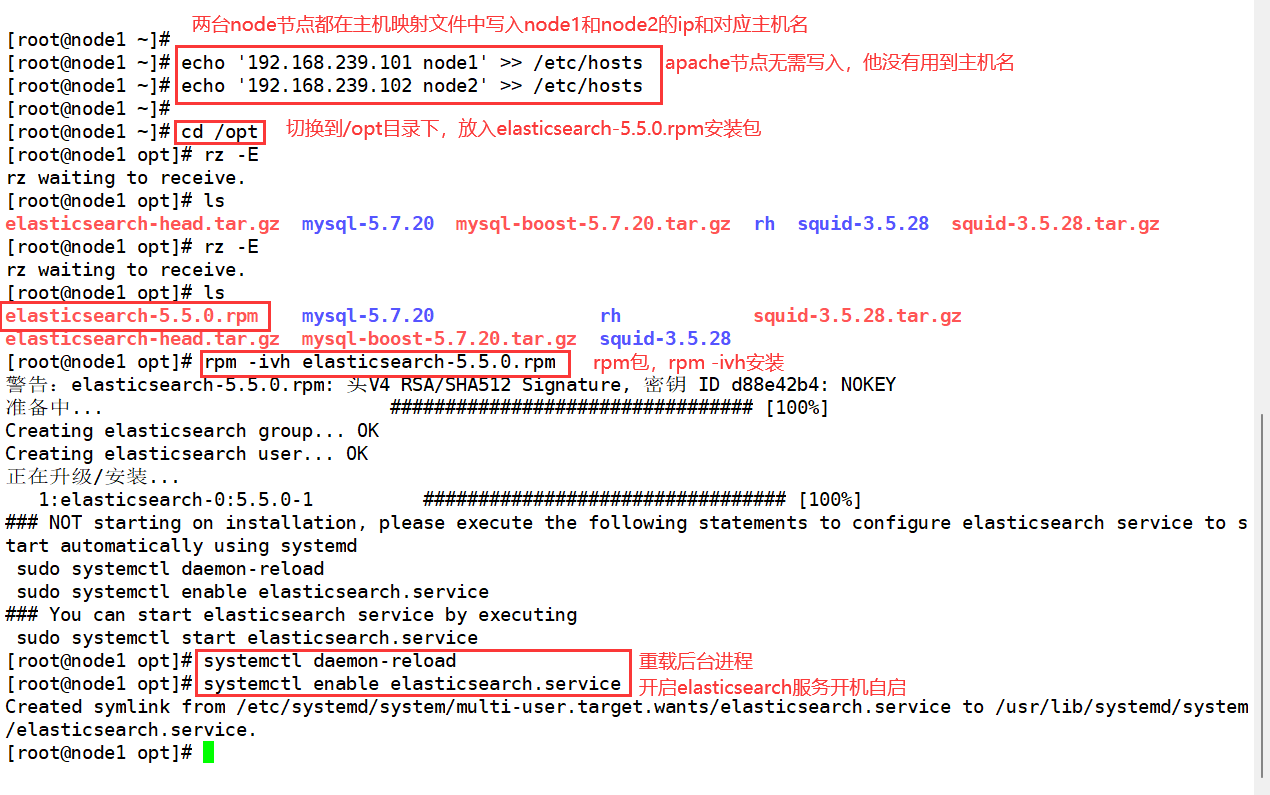
3. Configure the elasticsearch environment (node1, node2)
node1(192.168.239.101)
node2(192.168.239.102)
Only one host name is different and marked
echo '192.168.239.101 node1' >> /etc/hosts
echo '192.168.239.102 node2' >> /etc/hosts


cd /opt
rz elasticsearch-5.5.0.rpm

rpm -ivh elasticsearch-5.5.0.rpm

systemctl daemon-reload
systemctl enable elasticsearch.service
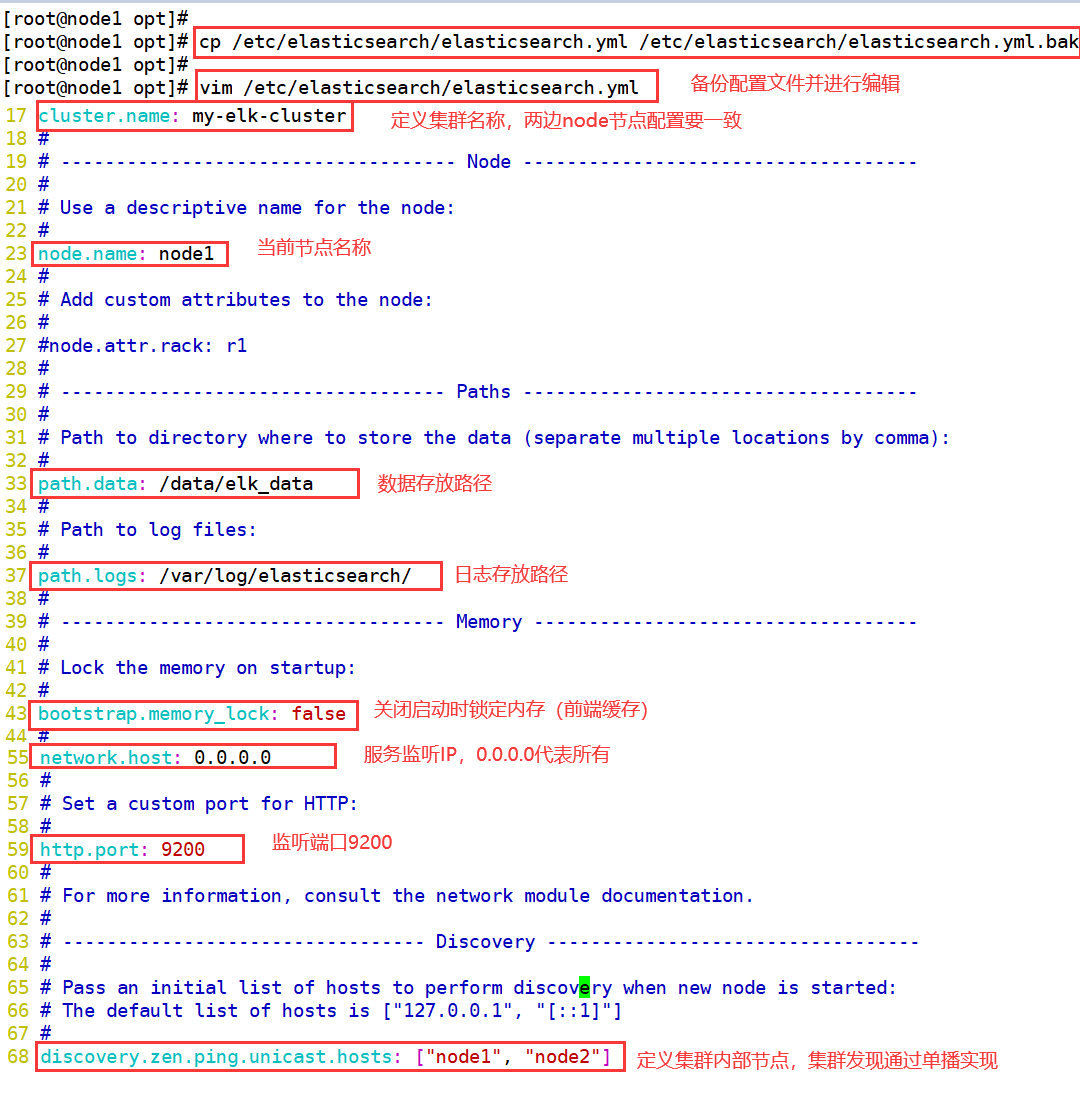
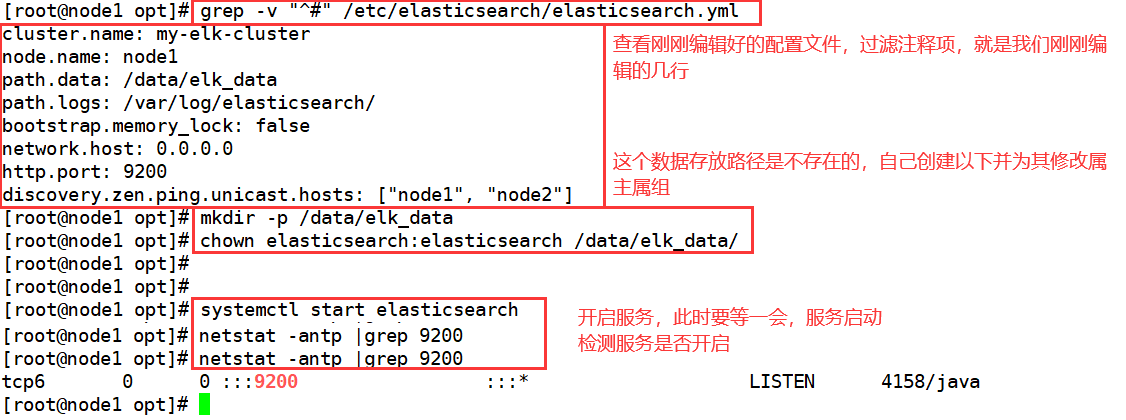
cp /etc/elasticsearch/elasticsearch.yml /etc/elasticsearch/elasticsearch.yml.bak

vim /etc/elasticsearch/elasticsearch.yml

==17==
cluster.name: my-elk-cluster

==23==
node.name: node1						#Here, the node2 node is set to node2

==33==
path.data: /data/elk_data

==37==
path.logs: /var/log/elasticsearch/

==43==
bootstrap.memory_lock: false

==55==
network.host: 0.0.0.0

==59==
http.port: 9200

==68==
discovery.zen.ping.unicast.hosts: ["node1", "node2"]
grep -v "^#" /etc/elasticsearch/elasticsearch.yml

mkdir -p /data/elk_data
chown elasticsearch:elasticsearch /data/elk_data/

systemctl start elasticsearch
netstat -antp |grep 9200
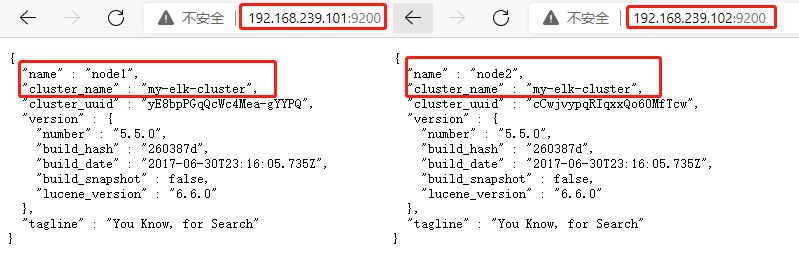
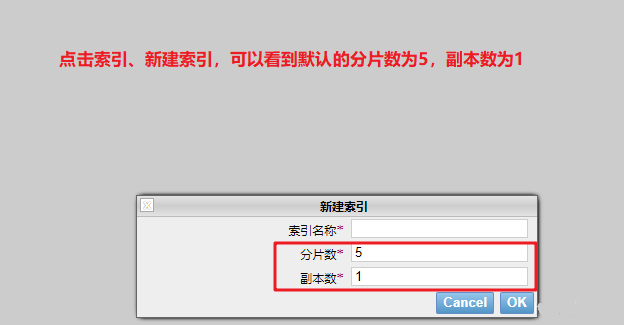
1. At this time, you can access the real machine to view the node information
http://192.168.239.101:9200
http://192.168.239.102:9200
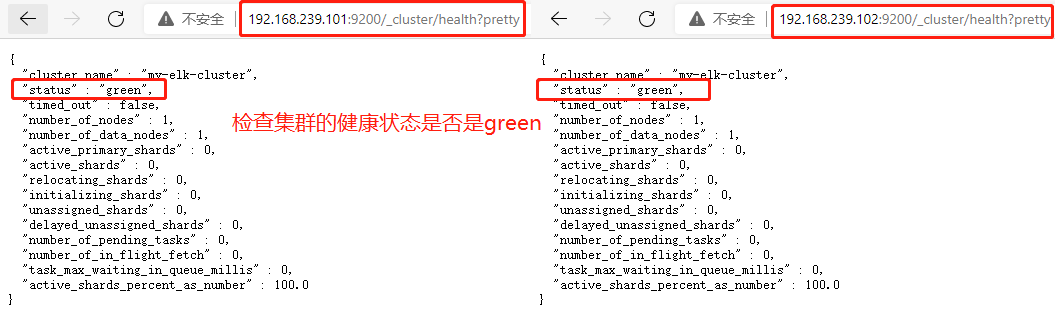
2. The real machine detects the cluster health and views the cluster status
http://192.168.239.101:9200/_cluster/health?pretty
http://192.168.239.102:9200/_cluster/health?pretty
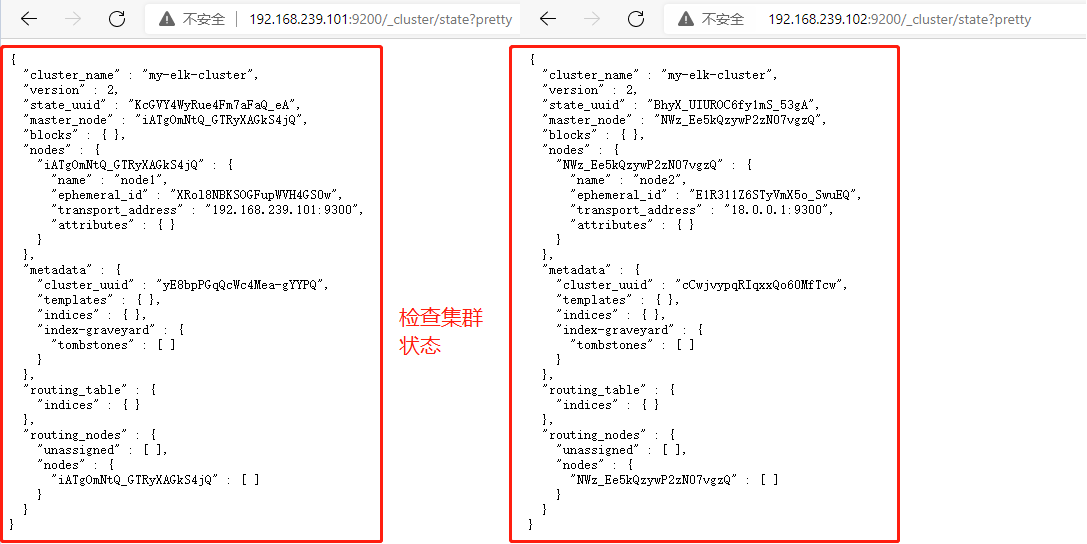
http://192.168.239.101:9200/_cluster/state?pretty
http://192.168.239.102:9200/_cluster/state?pretty
4. Install the elasticsearch head plug-in
- The above way to view the cluster is inconvenient. We can manage the cluster by installing the elastic search head plug-in
node1(192.168.239.101)
node2(192.168.239.102)
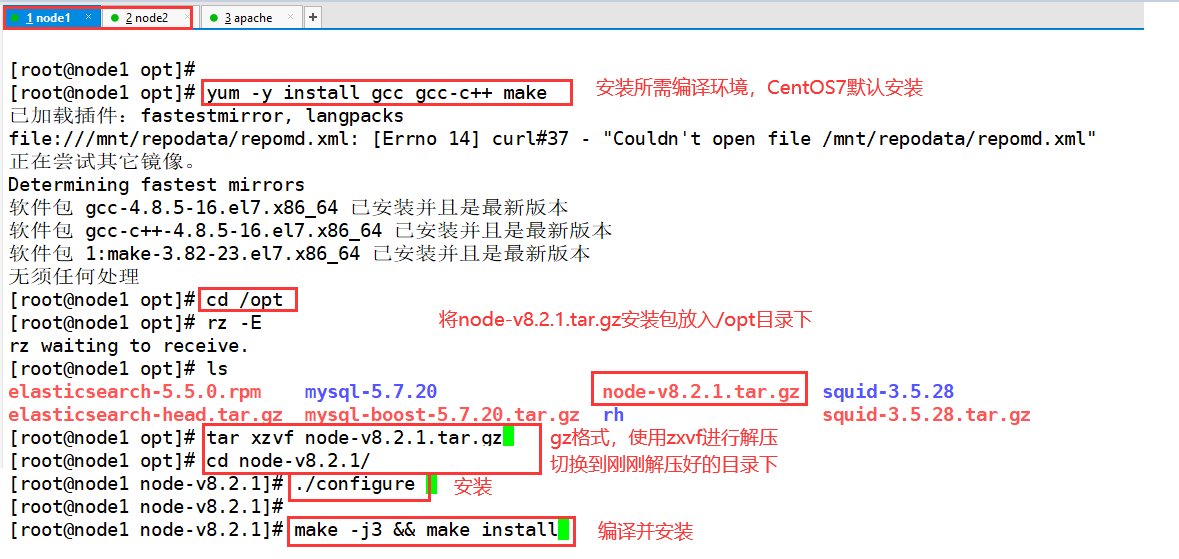
yum -y install gcc gcc-c++ make

cd /opt
rz node-v8.2.1.tar.gz
tar xzvf node-v8.2.1.tar.gz
cd node-v8.2.1/
./configure
make -j2 && make install
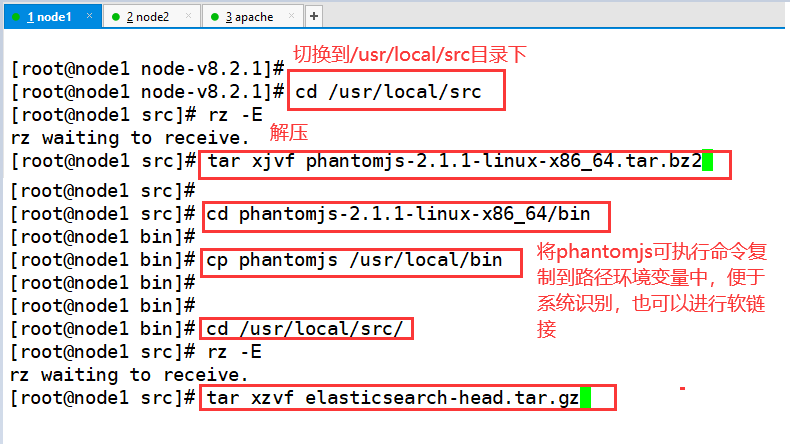
cd /usr/local/src
rz phantomjs-2.1.1-linux-x86_64.tar.bz2

tar xjvf phantomjs-2.1.1-linux-x86_64.tar.bz2


cd phantomjs-2.1.1-linux-x86_64/bin
cp phantomjs /usr/local/bin

cd /usr/local/src/
rz elasticsearch-head.tar.gz

tar xzvf elasticsearch-head.tar.gz
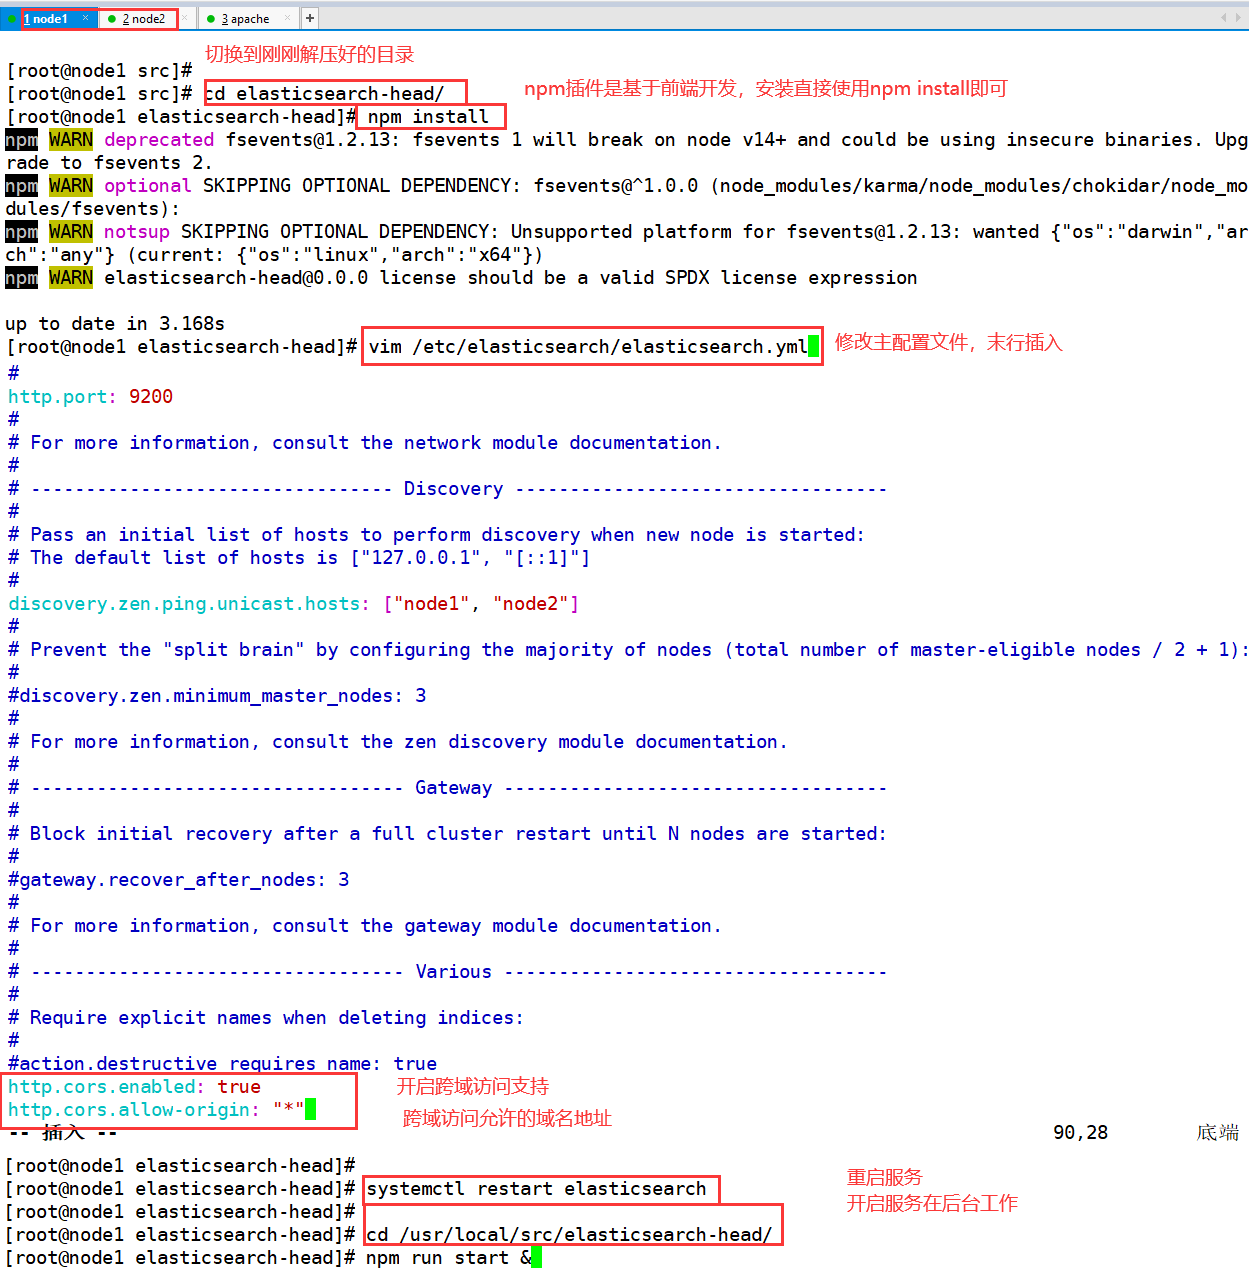
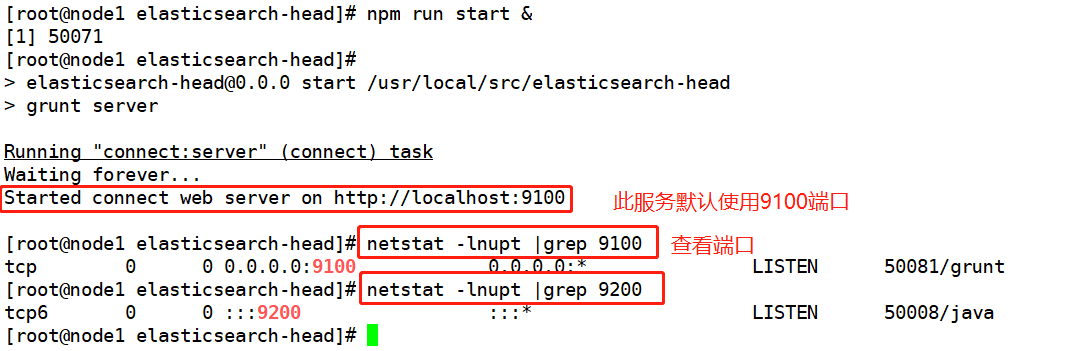
cd elasticsearch-head/
npm install

vim /etc/elasticsearch/elasticsearch.yml
==Last line insertion==
http.cors.enabled: true
http.cors.allow-origin: "*"

systemctl restart elasticsearch

cd /usr/local/src/elasticsearch-head/
npm run start &

netstat -lnupt |grep 9100
netstat -lnupt |grep 9200
Open browser input on real machine
http://192.168.239.101:9100
http://192.168.239.102:9100
-
You can see that the cluster is healthy and green
-
Enter in the column following elastic search
http://192.168.239.101:9200
http://192.168.239.102:9200
Then click the connection point to find: cluster health value: green (0 of 0)
● node1 information action
★ node2 information action
node1(192.168.239.101)
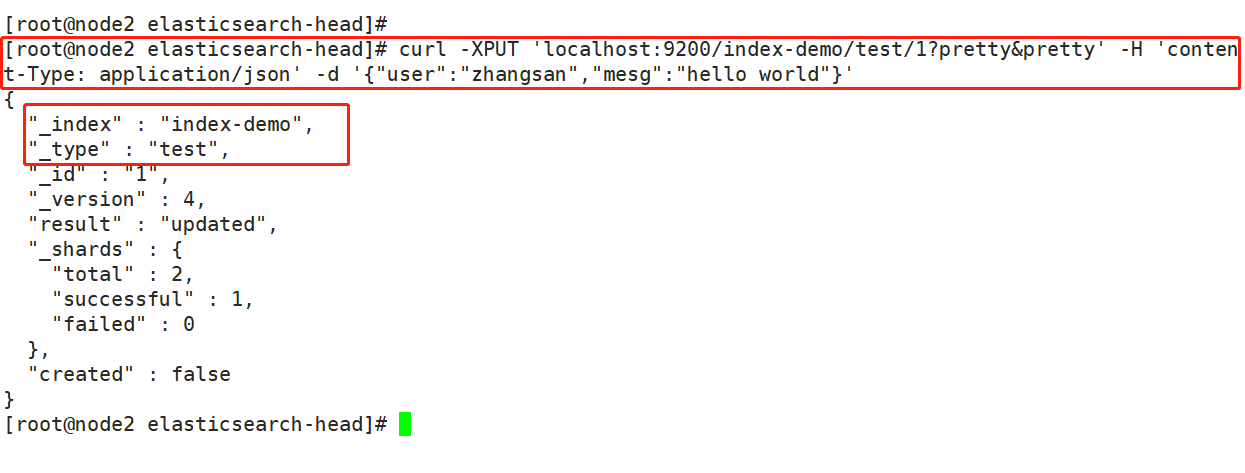
The index is index demo and the type is test. You can see the successful creation
curl -XPUT 'localhost:9200/index-demo/test/1?pretty&pretty' -H 'content-Type: application/json' -d '{"user":"zhangsan","mesg":"hello world"}'
Real machine access to view index information
http://192.168.239.101:9100