
primary coverage
According to the monitoring requirements of process behavior, many security software used Hook technology to intercept key system calls to intercept malware process creation. However, under x64 architecture, the system kernel has done a lot of security detection measures, especially technologies like KDP, which makes the Hook method no longer effective. Therefore, OS has launched a behavior monitoring scheme based on callback implementation. In this paper, the implementation principle of this technology is analyzed inversely with the help of IDA, and the key data structure and call chain are given. The correctness of the data structure and call chain is verified by dual machine kernel debugging.
The contents involved are as follows:
1. Kernel object and kernel object management;
2. Process callback;
3. Kernel debugging;
4. Windbg double click debugging;
introduction
In recent years, a variety of new variants of malware emerge in endlessly, with a variety of attack methods and means, resulting in huge economic losses. As the first link of defense, it is able to identify the actions created by malicious processes, and process creation monitoring technology is a technology that allows security software to have the opportunity to intercept this action. The security software judges whether to allow the process to be created according to the matching algorithm, so as to protect the security of user data.
[click here to get the reverse document]
Based on reverse engineering and kernel debugging technology, this paper analyzes the specific implementation of this technology and the additional data detection mechanism of the system. With the help of the reverse tool IDA, this paper analyzes the internal actions and specific implementation of the key API of the system, the relevant data structure, and obtains the call source actually triggered by the technology and the whole call chain. Build a dual machine debugging environment with VMWare, use Windbg to dynamically debug the system kernel, view the key data involved in the system, and make a comparative analysis with the data given by PCHunter to verify the correctness of the analysis conclusion. In addition, through the breakpoints of key functions in the call chain and stack backtracking technology, the whole call chain and trigger time are dynamically observed. The key data structure and the detection and verification algorithm of the system can be used to detect the table items maliciously constructed by viruses, Trojans and other software. [Reverse Engineering]
1 process callback principle analysis
1.1 reverse analysis of installation and unloading
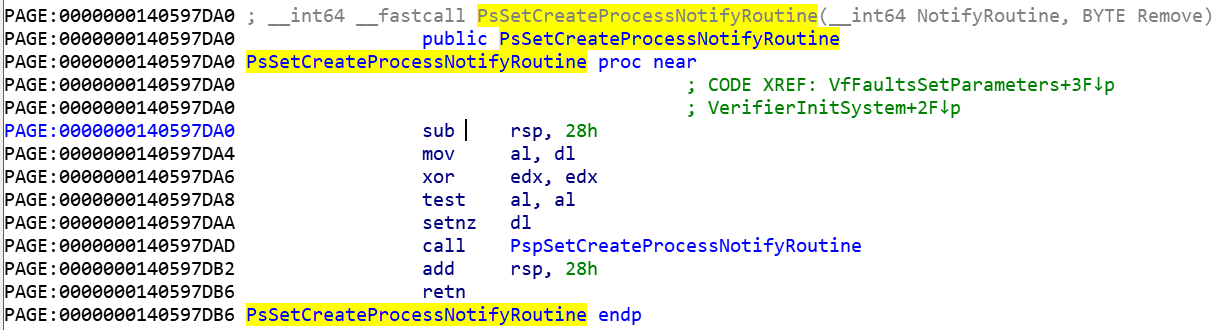
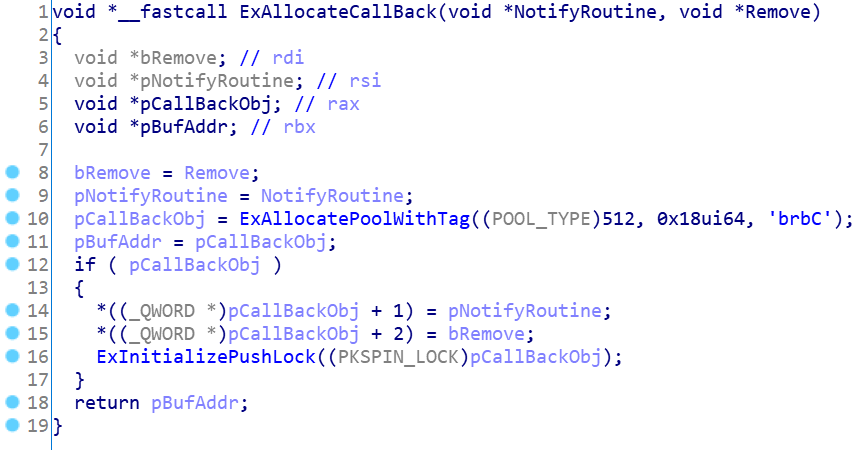
According to the instructions on Microsoft's official technical document MSDN, install a process creation and exit notification callback routine through PsSetCreateProcessNotifyRoutine, PsSetCreateProcessNotifyRoutineEx and PsSetCreateProcessNotifyRoutineEx2. When a process is created or exited, the system will call back the function specified in the parameter. Taking PsSetCreateProcessNotifyRoutine as an example, reverse analyze the specific implementation of the API based on IDA. As shown in Figure 1, it can be seen from the figure that the API simply calls another function and itself is only a stub. The specific implementation is in PspSetCreateProcessNotifyRoutine. The key implementation of the installation callback routine of this function is shown in the figure.
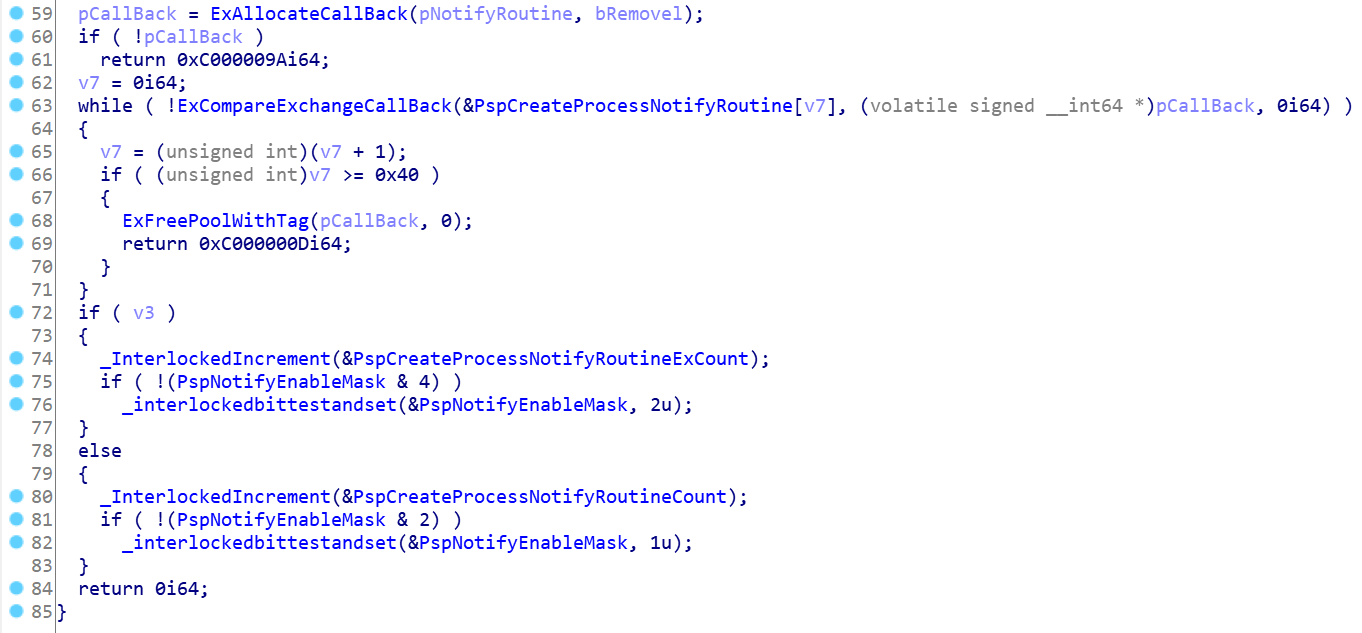
Call ExAllocateCallBack to create a callback object, and pass pNotifyRoutine and bremove as parameters to initialize the callback object. The code is shown in the figure; pNotifyRoutine is the function routine that needs to be called back. bRemovel here is false, indicating that the callback routine is currently installed.
Then call ExCompareExchangeCallBack to add the initialized CallBack object to the global array maintained by PspCreateProcessNotifyRoutine. It is worth noting that there is a special operation on the CallBack routine when installing the CallBack routine in ExCompareExchangeCallBack, as shown in the figure.
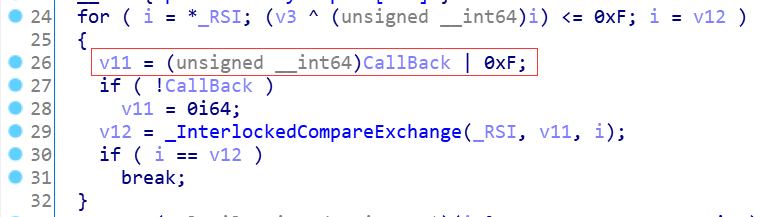
Or operation is performed with 0x0F, which is equivalent to setting all the lower 4 bits to 1; If the ExCompareExchangeCallBack fails, the next cycle continues. According to the code in line 66 in Figure 2, the maximum number of cycles is 0x40. If it fails all the time, you can call ExFreePoolWithTag to free up the memory occupied by pCallBack and return 0xC000000D error code. [receive reverse document]
Then, according to the value of v3, judge which callback is installed in the above three API s to update the corresponding global variables.
PspCreateProcessNotifyRoutineExCount and PspCreateProcessNotifyRoutineCount record the number of callback routines currently installed through PsSetCreateProcessNotifyRoutineEx and pssetcreateprocessnotifyroute respectively.
PspNotifyEnableMask is used to indicate whether a callback routine is installed in the current array. This value is used to judge whether the array is empty and speed up the execution efficiency of the program when the system traverses the callback array and executes the callback routine.
In addition to installing callback routines, these three API s can also uninstall the specified callback routines. Take PsSetCreateProcessNotifyRoutine as an example to analyze the key parts of its implementation, as shown in the figure.
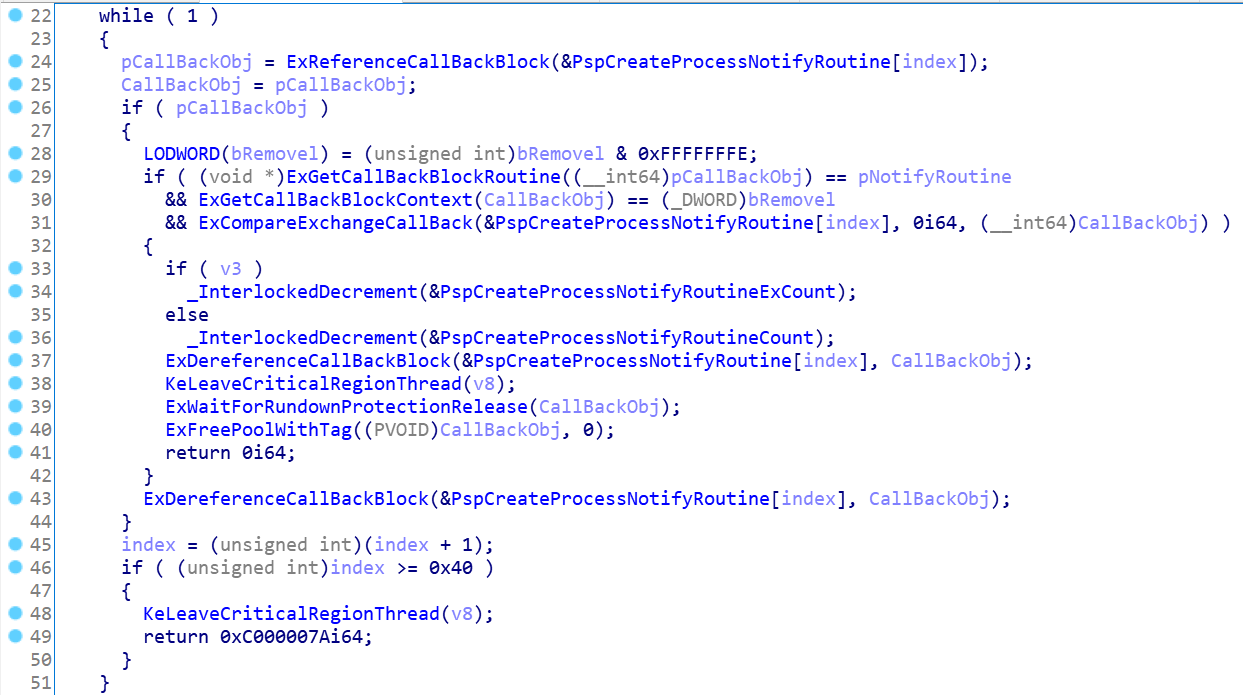
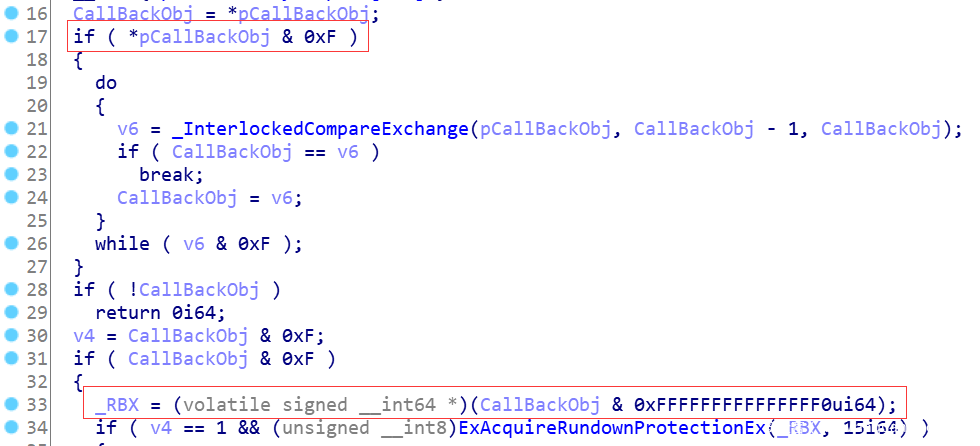
Traverse the PspCreateProcessNotifyRoutine array through a while loop, and call ExReferenceCallBackBlock to retrieve each item in the array. Some inspection actions will be performed inside the API, and special processing is also done for the returned data, as shown in the figure. In Figure 6, * pCallBackObj is the function address of the callback routine in the callback object. Check some data by judging whether the lower 4 bits are 1, as shown in line 17.
The system also plays a protective role in this process, preventing malicious construction of data to fill in the table and hijacking the normal system call process. In addition, when the code at line 33 in the figure returns the callback routine to the parent call, it also clears all the lower 4 bits of the callback routine. Otherwise, the returned address is wrong, and the call immediately triggers a CPU exception.
After ExReferenceCallBackBlock has successfully returned, it calls ExGetCallBackBlockRoutine to retrieve callback routines from the callback object, and determines whether the item is currently specified to be unloaded. If it is, it calls the ExDereferenceCallBackBlock decrement reference count, and then uses ExFreePoolWithTag to release the memory occupied by Callback. The value of PspCreateProcessNotifyRoutineExCount or PspCreateProcessNotifyRoutineCount will also be updated during. According to the source code, there are 64 items in the array, that is, only 64 callback routines can be installed. If the 64 items of the array are still not found after traversing, the 0xC000007A error code is returned.
1.2 OS execution callback routine analysis
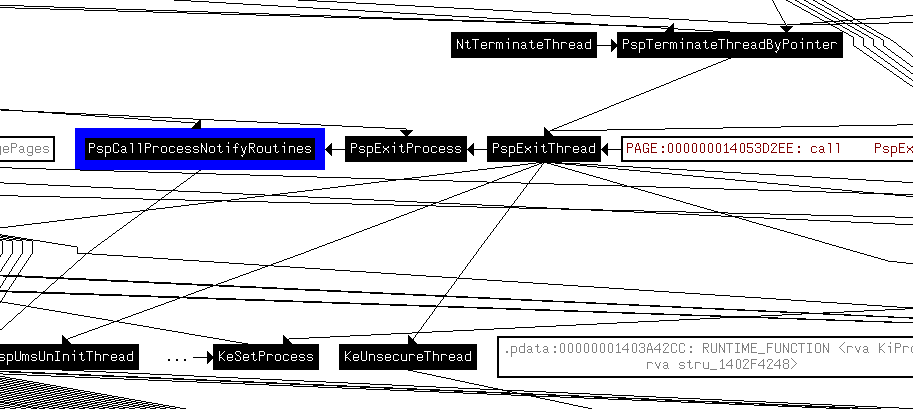
After the callback routine is installed, if a new process is created or exited, the kernel will traverse the array to execute each callback routine installed therein. Through the cross reference function of IDA, you can analyze the cross references to PspCreateProcessNotifyRoutine in other parts of the kernel, as shown in the figure
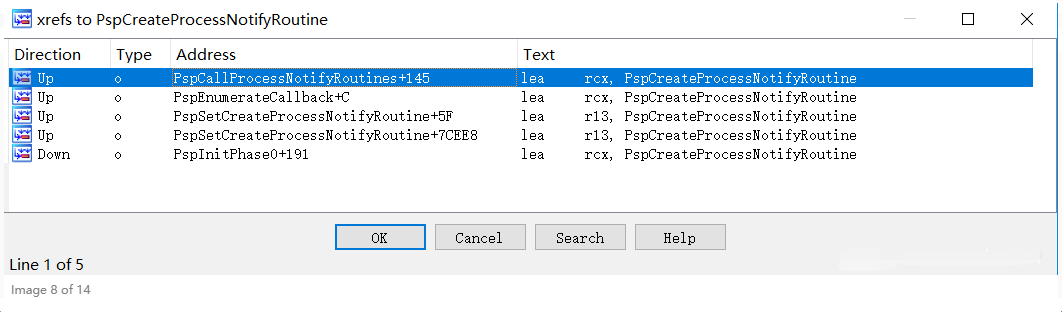
A total of 5 places involve this variable. Pspcallprocessnotifyroutes is a function that directly calls the callback routine. The key part of the function is shown in the figure.
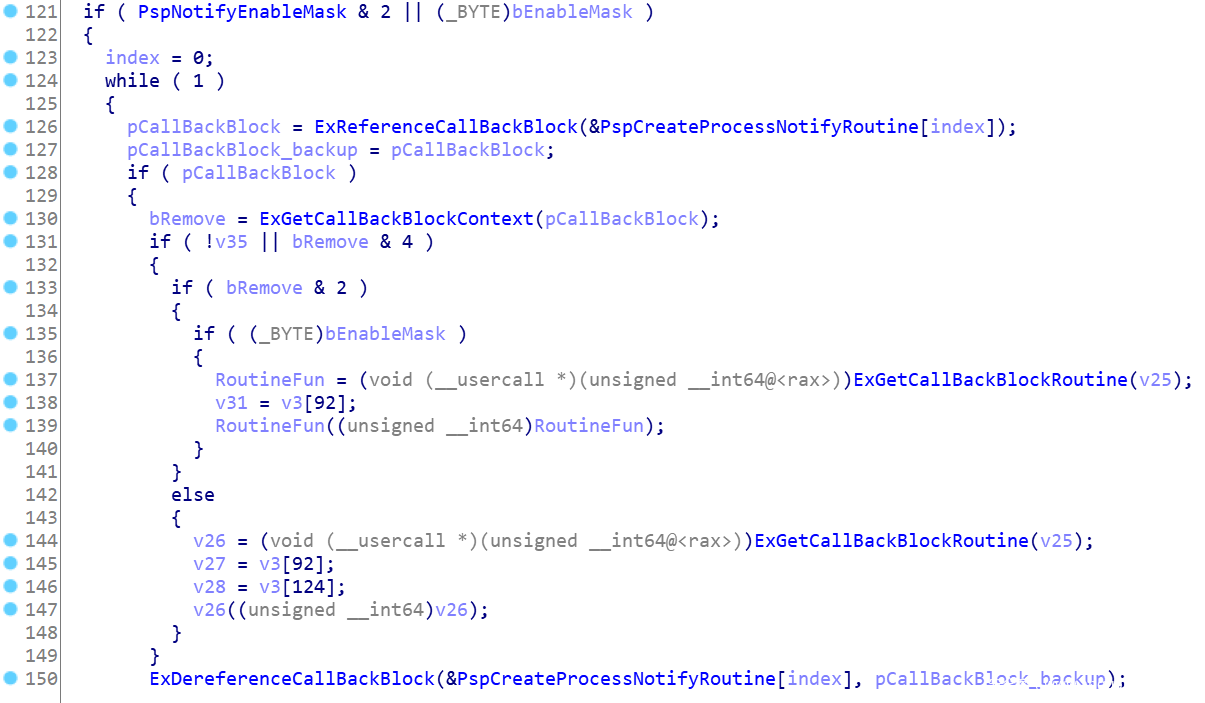
Through the while loop, traverse all callback routines installed in the PspCreateProcessNotifyRoutine array and execute them in turn.
The operation of pspnotifyenablemask & 2 is to judge whether callback routines are installed in the current array and speed up the execution efficiency of the program. The value of this variable is set when installing callback routines in PsSetCreateProcessNotifyRoutine. The if branch of bremove & 2 is used to determine whether the current callback routine is installed through PsSetCreateProcessNotifyRoutine or PsSetCreateProcessNotifyRoutineEx. Because the prototypes of callback routines installed by the two API s are different, the parameters passed in during actual call are also different. The callback routines of the two are:
void PcreateProcessNotifyRoutine(HANDLE ParentId,HANDLE ProcessId,BOOLEAN Create)and void PcreateProcessNotifyRoutineEx(PEPROCESS Process,HANDLE ProcessId,PPS_CREATE_NOTIFY_INFO CreateInfo).
In addition, the pseudo-C code routinefun ((unsigned _int64) routinefun) given by IDA in Figure 8 is obviously wrong, because the number of parameters of the callback routine is 3, while the parameters analyzed by Ida are only 1, which is obviously a problem. Directly look at the disassembly code, as shown in the figure
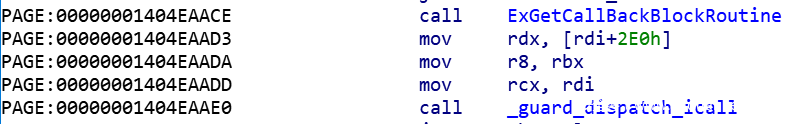
According to the calling convention under x64, the first four parameters of the function are passed through rcx, rdx, r8 and r9 registers. The figure shows the first three parameters of the callback routine_ guard_dispatch_icall will call directly from the value of rax, and the value of rax is the function address of the callback routine returned by the ExGetCallBackBlockRoutine call.
The second function in the above figure involving the PspCreateProcessNotifyRoutine array is the pspenumeratiecallback function, which is an internal function of the system and has not been exported. Its specific implementation is shown in the figure.
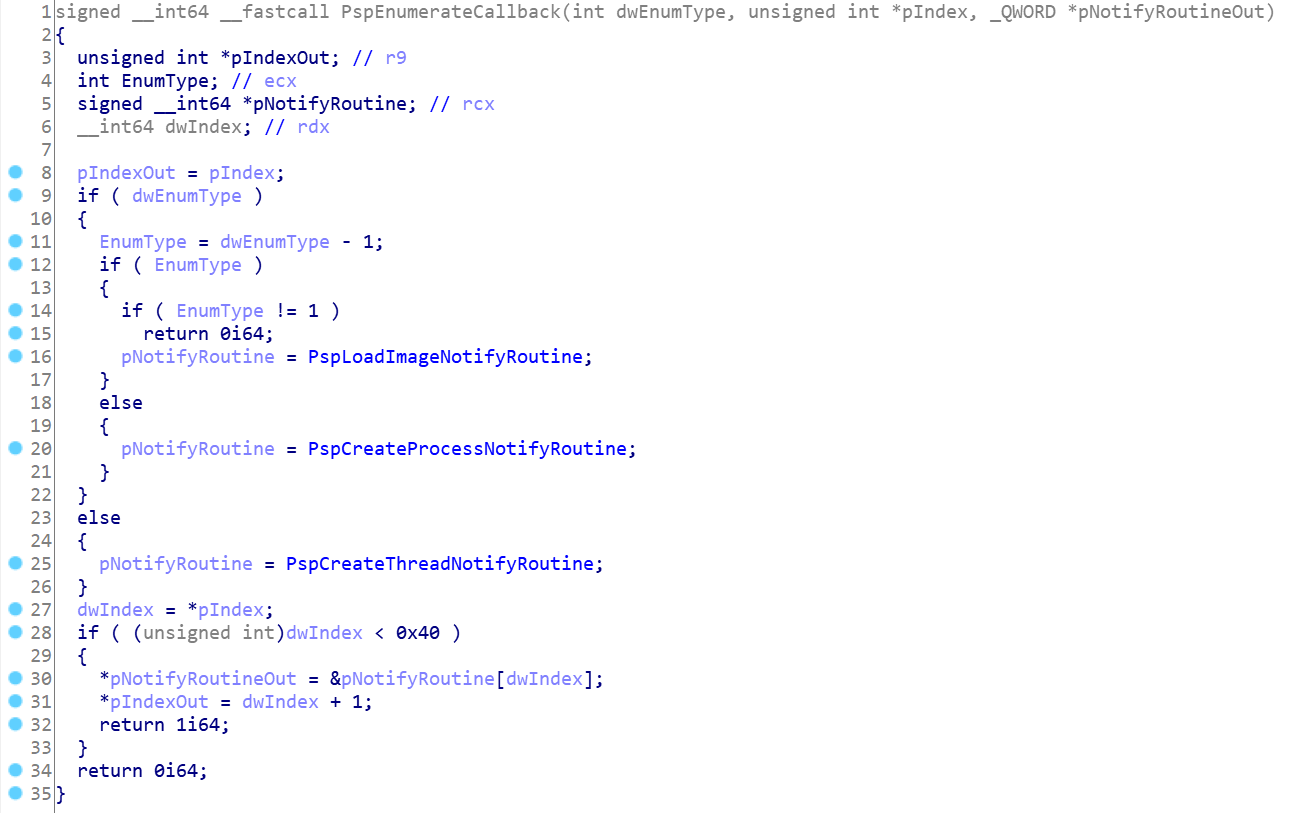
This function judges which array you want to enumerate according to dwEnumType. From the code analysis, the system kernel maintains three callback related arrays: image loading callback array, process creating exit callback array and thread creating exit array. Similar to the previous function verification, it also detects whether the index exceeds 0x40. If it exceeds 0x40, it returns 0 to indicate failure.
1.3 call chain analysis of trigger call
The previous section analyzes the direct call to the superior function of the callback routine. This section analyzes the whole call chain, mainly the call source and the key functions involved in the call process. The cross reference diagram given by IDA is shown in the figure.
There are many function calls involved, and many irrelevant ones are also included, which is not convenient for analysis. The key API s in the call chain after manual analysis and sorting are shown in the figure.
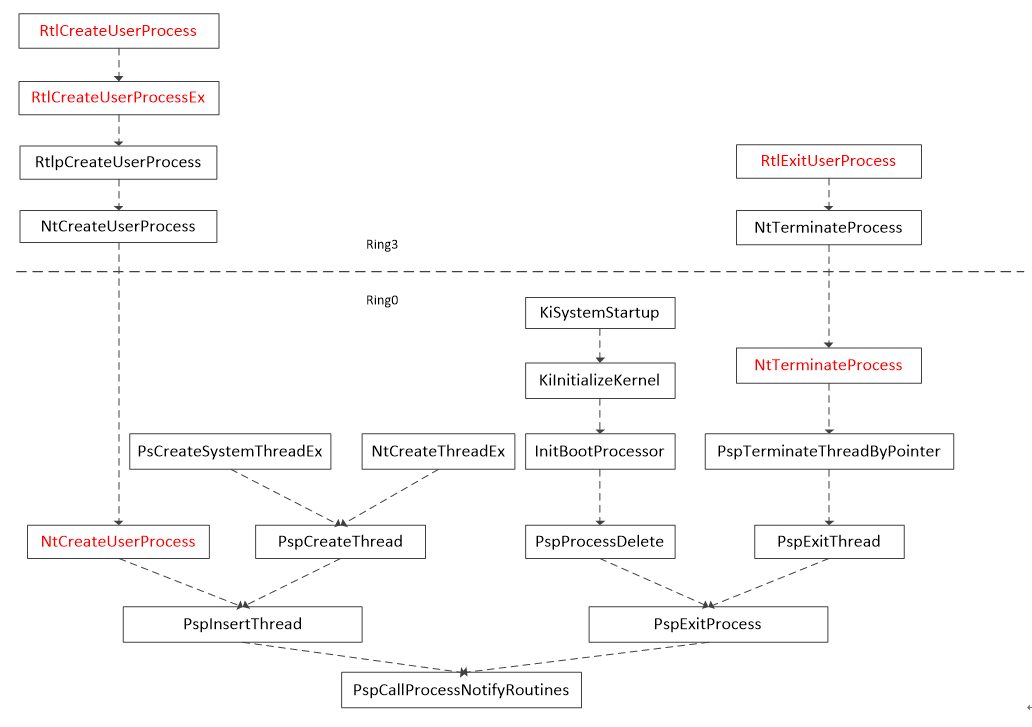
The part above the dotted line is the user state program, and the part below the dotted line is the kernel state program. All the APIs marked in red are standard exported APIs.
According to figure 12, when the user state process calls RtlCreateUserProcess, rtlcreateuserprocessex or RtlExitUserProcess, the kernel will traverse the PspCreateProcessNotifyRoutine array, execute the callback routine in turn, and notify the driver to do the corresponding processing.
After the driver takes over, it can do security verification, analyze the parent process of the process or further analyze the process chain. In addition, it can also do defense means such as feature code matching, PE fingerprint identification and import table detection for the child process to be pulled up.
This method does not need to go to any API of Hook, nor does it need to do repetitive and cumbersome work such as feature code positioning. It is completely based on the callback mechanism provided by the system, and can be seamlessly connected in Windows system. And there is no competition among various security manufacturers, which greatly reduces the risk of system blue screen.
In Figure 12, NtCreateUserProcess calls ppinsertthread because the main thread of the process will be created inside the API that created the process. It is more reasonable to unify the work of traversing the callback routine array into PspInsertThread and call the underlying pspcallprocessnotifyroutes.
2 experiment
2.1 observe the callback routines installed in the system
The experimental environment is shown in Table 1. Dual machine debugging is carried out with the help of VMWare.
Guest OS Build 10.0.16299.125
Host OS Build 10.0.17134.885
Windbg Version 10.0.17134.1
VMWare 14.1.1 build-7528167
PCHunter V1.56
Observe the PspCreateProcessNotifyRoutine array in Windbg. There are 14 valid data items in total, as shown below;
1: kd> dd PspCreateProcessNotifyRoutineCount  l1
fffff802`151f4e78  00000009

1: kd> dd PspCreateProcessNotifyRoutineExCount l1
fffff802`151f4e7c  00000005

1: kd> dq PspCreateProcessNotifyRoutine l40
fffff802`14da2a80  ffffcc8b`d884b9bf  ffffcc8b`d8d9c96f
fffff802`14da2a90  ffffcc8b`d939975f  ffffcc8b`da00044f
fffff802`14da2aa0  ffffcc8b`d9bd382f  ffffcc8b`da41e8df
fffff802`14da2ab0  ffffcc8b`da53815f  ffffcc8b`da5ca8bf
fffff802`14da2ac0  ffffcc8b`dac5178f  ffffcc8b`dbef624f
fffff802`14da2ad0  ffffcc8b`dce333af  ffffcc8b`dcec67df
fffff802`14da2ae0  ffffcc8b`dc735def  ffffcc8b`dcabd32f
Disassemble the first item and find its corresponding callback routine, as follows:
1: kd> dq ffffcc8b`d884b9b0 l3
ffffcc8b`d884b9b0  00000000`00000020 fffff802`13fd6268
ffffcc8b`d884b9c0  00000000`00000000
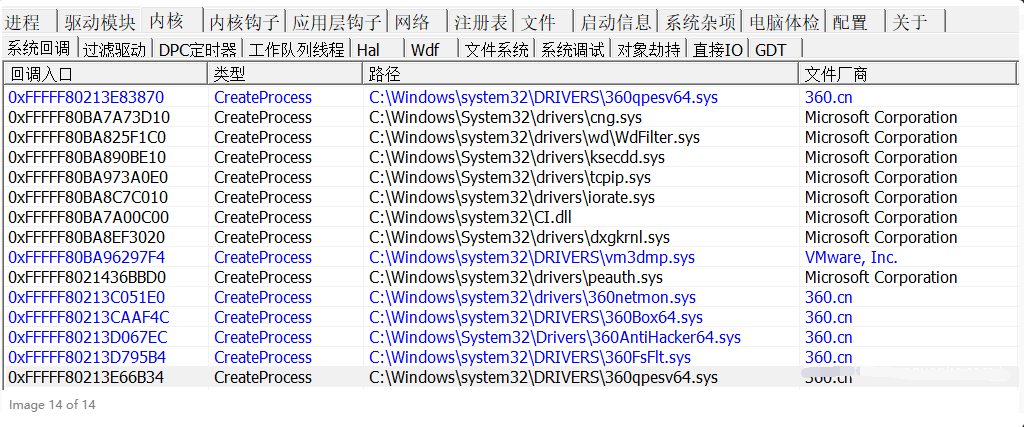
It can be seen that the starting address of the installed callback routine is fffff802`13fd6268, and you can also know that Remove is 0, that is, this is already installed. Find the driver module corresponding to the callback routine, as follows:
1: kd> u fffff802`13fd6268
360qpesv64+0x26268:
fffff802`13fd6268  mov  qword ptr [rsp+08h],rbx
fffff802`13fd626d  mov  qword ptr [rsp+10h],rbp
fffff802`13fd6272  mov  qword ptr [rsp+18h],rsi
fffff802`13fd6277  push rdi

1: kd> lmvm 360qpesv64
start              end                 module name
fffff802`13fb0000 fffff802`14002000 360qpesv64
Loaded symbol image file: 360qpesv64.sys
Image path: 360qpesv64.sys
Image name: 360qpesv64.sys
Timestamp:  Wed May 27 20:13:22 2020 (5ECF2C52)
CheckSum:   00054A2A
ImageSize:  00052000
It can be seen that the callback routine is officially provided by 360. With the help of PCHunter, the data given is shown in the figure
2.2 dynamic debugging callback routine
Taking item 14 of the table item as an example, the contents are as follows,
1: kd> dq ffffcc8b`dcabd320 l3
ffffcc8b`dcabd320  00000000`00000020 fffff802`13d795b4
ffffcc8b`dcabd330  00000000`00000006

1: kd> bp fffff802`13d795b4
1: kd> g
When the breakpoint hits, view the related information of the parent process, as shown below,
Breakpoint 0 hit
fffff802`13d795b4 48895c2408      mov     qword ptr [rsp+8],rbx
1: kd> dt _EPROCESS @$proc -yn ImageFileName
nt!_EPROCESS
  +0x450 ImageFileName : [15]  "svchost.exe"
It can be seen that it is svchost Exe, the parent process, creates or destroys a child process. More specific information is analyzed as follows; View the current context;
1: kd> r
rax=fffff80213d795b4 rbx=ffffcb8050526c80 rcx=ffffcc8bdd67e080
rdx=0000000000001f28 rsi=000000000000000d rdi=ffffcc8bdd67e080
rip=fffff80213d795b4 rsp=ffffcb8050526c38 rbp=ffffcb8050526ca9
r8=ffffcb8050526c80  r9=ffffcc8bdc735de0 r10=ffff9401cdcc2760
r11=0000000000000000 r12=0000000000000001 r13=0000000000000000
r14=ffffcc8bdcabd320 r15=fffff80214da2ae8
iopl=0         nv up ei pl zr na po nc
cs=0010  ss=0018  ds=002b  es=002b  fs=0053  gs=002b             efl=00000246

according to x64 According to the calling convention of, rcx Stored in the register is EPROCESS Object pointer, which stores the relevant information of the sub process to be created. The key information that can be obtained as identity recognition or security detection is as follows:
1: kd> dt _EPROCESS ffffcc8bdd67e080 -yn ImageFile
ntdll!_EPROCESS
   +0x448 ImageFilePointer : 0xffffcc8b`dc97c5c0 _FILE_OBJECT
   +0x450 ImageFileName : [15]  "UpdateAssistan"

1: kd> dt 0xffffcc8b`dc97c5c0 _FILE_OBJECT -yn FileName
ntdll!_FILE_OBJECT
   +0x058 FileName : _UNICODE_STRING "\Windows\UpdateAssistant\UpdateAssistant.exe"

1: kd> .process /p ffffcc8bdd67e080; !peb 186ef07000
Implicit process is now ffffcc8b`dd67e080
.cache forcedecodeuser done
PEB at 000000186ef07000
    CurrentDirectory:  'C:\Windows\system32\'
    WindowTitle:  'C:\Windows\UpdateAssistant\UpdateAssistant.exe'
    ImageFile:    'C:\Windows\UpdateAssistant\UpdateAssistant.exe'
CommandLine:  'C:\Windows\UpdateAssistant\UpdateAssistant.exe /ClientID Win10Upgrade:VNL:NHV19:{} /CalendarRun'
You can obtain the EXE path of the process, the command line parameters at the time of creation, the PID of the parent process and other information, which are sufficient for the detection of security software.
The complete call stack of the parent process is as follows:,
1: kd> k
 # Child-SP          RetAddr           Call Site
00 ffffcb80`50526c38 fffff802`14ef4ae5 0xfffff802`13d795b4
01 ffffcb80`50526c40 fffff802`14ef752c nt!PspCallProcessNotifyRoutines+0x249
02 ffffcb80`50526d10 fffff802`14f2797b nt!PspInsertThread+0x5a4
03 ffffcb80`50526dd0 fffff802`14b79553 nt!NtCreateUserProcess+0x9c7
04 ffffcb80`50527a10 00007ffe`547d1654 nt!KiSystemServiceCopyEnd+0x13
05 0000002f`4b67d258 00007ffe`50b406df ntdll!NtCreateUserProcess+0x14
06 0000002f`4b67d260 00007ffe`50b3d013 KERNELBASE!CreateProcessInternalW+0x1b3f
07 0000002f`4b67dec0 00007ffe`5216ee0f KERNELBASE!CreateProcessAsUserW+0x63
08 0000002f`4b67df30 00007ffe`4ce0a136 KERNEL32!CreateProcessAsUserWStub+0x5f
09 0000002f`4b67dfa0 00007ffe`4ce0bdd9 UBPM!UbpmpLaunchAction+0xb36
0a 0000002f`4b67e280 00007ffe`4ce08ee0 UBPM!UbpmLaunchTaskExe+0x279
0b 0000002f`4b67e490 00007ffe`4ce10a86 UBPM!UbpmpLaunchOneTask+0x6c0
0c 0000002f`4b67e8f0 00007ffe`4ce0b8bc UBPM!UbpmpHandleGroupSid+0x236
0d 0000002f`4b67ea10 00007ffe`4ce0b78b UBPM!UbpmpLaunchExeAction+0xec
0e 0000002f`4b67eaf0 00007ffe`4ce0b5a3 UBPM!UbpmpTakeAction+0xeb
0f 0000002f`4b67eb50 00007ffe`4ce0b193 UBPM!UbpmpPerformTriggerActions+0x293
10 0000002f`4b67eca0 00007ffe`4ce1316c UBPM!UbpmpHandleTriggerArrived+0x563
11 0000002f`4b67ef50 00007ffe`508c32d0 UBPM!UbpmpRepetitionArrived+0x1c
12 0000002f`4b67ef90 00007ffe`508c3033 EventAggregation!EaiSignalAggregateEvent+0x16c
13 0000002f`4b67f060 00007ffe`508c27aa EventAggregation!EaiSignalCallback+0xe7
14 0000002f`4b67f140 00007ffe`508c253e EventAggregation!EaiProcessNotification+0x1aa
15 0000002f`4b67f270 00007ffe`508caef8 EventAggregation!WnfEventCallback+0x506
16 0000002f`4b67f3a0 00007ffe`5476769f EventAggregation!AggregateEventWnfCallback+0x38
17 0000002f`4b67f3f0 00007ffe`54767a51 ntdll!RtlpWnfWalkUserSubscriptionList+0x29b
18 0000002f`4b67f4e0 00007ffe`5476b510 ntdll!RtlpWnfProcessCurrentDescriptor+0x105
19 0000002f`4b67f560 00007ffe`54766b59 ntdll!RtlpWnfNotificationThread+0x80
1a 0000002f`4b67f5c0 00007ffe`54764b70 ntdll!TppExecuteWaitCallback+0xe1
1b 0000002f`4b67f600 00007ffe`52171fe4 ntdll!TppWorkerThread+0x8d0
1c 0000002f`4b67f990 00007ffe`5479ef91 KERNEL32!BaseThreadInitThunk+0x14
1d 0000002f`4b67f9c0 00000000`00000000 ntdll!RtlUserThreadStart+0x21
Since the first four parameters are passed through registers, they cannot be directly traced back to the parameters through the stack, but can be obtained by manual analysis. Analyze ntdll! The assembly code at the return address of the calling parent function of ntcreateuserprocess is as follows:
1: kd> ub 00007ffe`50b406df
KERNELBASE!CreateProcessInternalW+0x1b11:
00007ffe`50b406b1 488b842440040000 mov     rax,qword ptr [rsp+440h]
00007ffe`50b406b9 4889442420      mov     qword ptr [rsp+20h],rax
00007ffe`50b406be b800000002      mov     eax,2000000h
00007ffe`50b406c3 448bc8          mov     r9d,eax
00007ffe`50b406c6 448bc0          mov     r8d,eax
00007ffe`50b406c9 488d942448010000 lea     rdx,[rsp+148h]
00007ffe`50b406d1 488d8c24e0000000 lea     rcx,[rsp+0E0h]
00007ffe`50b406d9 ff1521901600    call    qword ptr [KERNELBASE!_imp_NtCreateUserProcess (00007ffe`50ca9700)]

You know, NtCreateUserProcess The first parameter and the second parameter rsp+0xE0 and rsp+0x148 Division; Check the data here as follows:
1: kd> dpu 0000002f`4b67d260+E0 0000002f`4b67d260+148
0000002f`4b67d340  00000000`00000000
0000002f`4b67d348  00000000`00000004
0000002f`4b67d350  00000100`00000000
0000002f`4b67d358  00000000`00000020
0000002f`4b67d360  000001f2`d9b87cc0 "C:\Windows\UpdateAssistant\UpdateAssistant.exe"
0000002f`4b67d368  00000000`00000000
0000002f`4b67d370  00000000`00000000
0000002f`4b67d378  0000002f`00000000
0000002f`4b67d380  000001f2`d8d43580 "C:\Windows\UpdateAssistant\UpdateAssistant.exe /ClientI"
0000002f`4b67d388  00000000`00000000
0000002f`4b67d390  00000000`00008664
0000002f`4b67d398  000001f2`d9d73c40 "ALLUSERSPROFILE=C:\ProgramData"
0000002f`4b67d3a0  00000000`00000000
0000002f`4b67d3a8  00000000`00000000
Therefore, the child process pulled up by svchost is updateassistant Exe, which is also consistent with the parameters obtained by previous analysis. It can be seen from the call stack that the child process updateassistant is created in svchost Exe, and notify the driver software to do corresponding processing.
I am a penetration testing worker who loves penetration and penetrates attentively. In order to make it easier for everyone to study and read, I sort out the documents in the article, including penetration testing and attack and defense documents. Documents are required I'll pick it up!!!
3 conclusion
This paper analyzes the internal principle of the system's process callback security mechanism in detail, reverses the system image file with the help of IDA tool, analyzes the key code part of the implementation, and obtains the key data structure and the additional data detection and verification algorithm of the system. The role of key global variables is also explained in detail.
In addition, through reverse analysis, the call source and call chain of the whole mechanism are given. Finally, based on the dual machine debugging environment, the process callback routine table maintained in the kernel is dynamically viewed, and the breakpoint actually dynamically debugs the whole process.
For driver development, researchers related to kernel security provide the implementation principle and mechanism of this technology. Based on the obtained key data structure and system data inspection and protection algorithm, it can detect the malicious code in the table item after decrypting the key fields. It can also be used for security manufacturers to manually build the table item completely away from the API provided by the system in the process of confrontation, so as to achieve the purpose of monitoring the system behavior.