catalogue
0 demand analysis
The data is the anchor ID,stt represents the start time and edt represents the next time.
| id | stt | edt |
| 1001 | 2021-06-14 12:12:12 | 2021-06-14 18:12:12 |
| 1003 | 2021-06-14 13:12:12 | 2021-06-14 16:12:12 |
| 1004 | 2021-06-14 13:15:12 | 2021-06-14 20:12:12 |
| 1002 | 2021-06-14 15:12:12 | 2021-06-14 16:12:12 |
| 1005 | 2021-06-14 15:18:12 | 2021-06-14 20:12:12 |
| 1001 | 2021-06-14 20:12:12 | 2021-06-14 23:12:12 |
| 1006 | 2021-06-14 21:12:12 | 2021-06-14 23:15:12 |
| 1007 | 2021-06-14 22:12:12 | 2021-06-14 23:10:12 |
Requirements:
- (1) What is the maximum number of anchors online on the platform one day?
- (2) What is the peak time period?
1 data preparation
(1) Data
vim play.txt
id	stt			        edt
1001	2021-06-14 12:12:12	        2021-06-14 18:12:12
1003	2021-06-14 13:12:12		2021-06-14 16:12:12
1004	2021-06-14 13:15:12		2021-06-14 20:12:12
1002	2021-06-14 15:12:12		2021-06-14 16:12:12
1005	2021-06-14 15:18:12		2021-06-14 20:12:12
1001	2021-06-14 20:12:12		2021-06-14 23:12:12
1006	2021-06-14 21:12:12		2021-06-14 23:15:12
1007	2021-06-14 22:12:12		2021-06-14 23:10:12
(2) Build table
create table if not exists play(

id string,
stt string,
edt string

)

row format delimited
fields terminated by '\t'

;
(3) loading data
load data local inpath "/home/centos/dan_test/play.txt" into table play;
(4) Query data
hive> select * from play;
OK
1001	2021-06-14 12:12:12	2021-06-14 18:12:12
1003	2021-06-14 13:12:12	2021-06-14 16:12:12
1004	2021-06-14 13:15:12	2021-06-14 20:12:12
1002	2021-06-14 15:12:12	2021-06-14 16:12:12
1005	2021-06-14 15:18:12	2021-06-14 20:12:12
1001	2021-06-14 20:12:12	2021-06-14 23:12:12
1006	2021-06-14 21:12:12	2021-06-14 23:15:12
1007	2021-06-14 22:12:12	2021-06-14 23:10:12
Time taken: 0.087 seconds, Fetched: 8 row(s)
2 data analysis
Problem 1 Analysis:
If it is difficult to start directly from SQL itself, we might as well change our thinking. Assuming we get a piece of data, what can we do with java program now? In fact, it is the idea of an accumulator (such as SPARK accumulator). First, we need to split such a record into different records or data streams into the accumulator, and then mark each record. If the broadcast is started, the record is recorded as 1 and if the broadcast is down, it is recorded as - 1. At this time, the data streams enter the accumulator in chronological order, and then stack in the accumulator, The maximum cumulative result is the desired result. In fact, the essence is to use the idea of accumulator, but the data entering the accumulator is the sequential flow data arranged in time order (the data enters in time order).
The above ideas are summarized as follows:
- (1) Segment data by start time and end time
- (2) Label the data. The record of broadcasting is recorded as 1 and the record of broadcasting is recorded as - 1 for accumulation
- (2) Sort data by time
- (3) The data enters the accumulator for accumulation
- (4) Gets the maximum value of the current accumulated value in the accumulator
With the above ideas, we convert them into SQL solution ideas.
(1) Data segmentation: in fact, it is to convert the start time and next time into records. That is, column to row conversion. We use the familiar UNION operation to convert.
select id,stt dt from play
union
select id,edt dt from play
--------------------------------------------------------------------------------
OK
1001	2021-06-14 12:12:12
1001	2021-06-14 18:12:12
1001	2021-06-14 20:12:12
1001	2021-06-14 23:12:12
1002	2021-06-14 15:12:12
1002	2021-06-14 16:12:12
1003	2021-06-14 13:12:12
1003	2021-06-14 16:12:12
1004	2021-06-14 13:15:12
1004	2021-06-14 20:12:12
1005	2021-06-14 15:18:12
1005	2021-06-14 20:12:12
1006	2021-06-14 21:12:12
1006	2021-06-14 23:15:12
1007	2021-06-14 22:12:12
1007	2021-06-14 23:10:12
Time taken: 20.502 seconds, Fetched: 16 row(s)
(2) Data marker. Mark directly on the basis of the above SQL If the data is originally separated, mark it with case when.
select id,stt dt , 1 flag from play
union
select id,edt dt ,-1 flag from play
--------------------------------------------------------------------------------
OK
1001	2021-06-14 12:12:12	1
1001	2021-06-14 18:12:12	-1
1001	2021-06-14 20:12:12	1
1001	2021-06-14 23:12:12	-1
1002	2021-06-14 15:12:12	1
1002	2021-06-14 16:12:12	-1
1003	2021-06-14 13:12:12	1
1003	2021-06-14 16:12:12	-1
1004	2021-06-14 13:15:12	1
1004	2021-06-14 20:12:12	-1
1005	2021-06-14 15:18:12	1
1005	2021-06-14 20:12:12	-1
1006	2021-06-14 21:12:12	1
1006	2021-06-14 23:15:12	-1
1007	2021-06-14 22:12:12	1
1007	2021-06-14 23:10:12	-1
Time taken: 7.408 seconds, Fetched: 16 row(s)
(3) The data is sorted by time and enters the accumulator for accumulation (sorting by time is the key to accumulation)
select id
     ,dt
     ,sum(flag) over(order by dt) as cur_cnt
from(
     select id,stt dt , 1 flag from play
     union
     select id,edt dt ,-1 flag from play
    ) t
-------------------------------------------------------------------------------- OK 1001 2021-06-14 12:12:12 1 1003 2021-06-14 13:12:12 2 1004 2021-06-14 13:15:12 3 1002 2021-06-14 15:12:12 4 1005 2021-06-14 15:18:12 5 1002 2021-06-14 16:12:12 3 1003 2021-06-14 16:12:12 3 1001 2021-06-14 18:12:12 2 1001 2021-06-14 20:12:12 1 1004 2021-06-14 20:12:12 1 1005 2021-06-14 20:12:12 1 1006 2021-06-14 21:12:12 2 1007 2021-06-14 22:12:12 3 1007 2021-06-14 23:10:12 2 1001 2021-06-14 23:12:12 1 1006 2021-06-14 23:15:12 0 Time taken: 8.133 seconds, Fetched: 16 row(s)
(4) Get the maximum value accumulated at the current time in the accumulator, that is, the maximum number of people broadcasting at the same time
select max(cur_cnt)
from(
	select id
		 ,dt
		 ,sum(flag) over(order by dt) as cur_cnt
	from(
		select id,stt dt , 1 flag from play
		union
		select id,edt dt ,-1 flag from play
	) t
) m
--------------------------------------------------------------------------------
OK
5
Time taken: 13.087 seconds, Fetched: 1 row(s)
Problem 2 Analysis:
The second question is the time period when the peak occurs, that is, the start time and end time of the peak, or the duration.
Based on the results of the first question:
select *,max(cur_cnt) over()
from(
     select id
           ,dt
           ,sum(flag) over(order by dt) as cur_cnt
     from(
          select id,stt dt , 1 flag from play
          union
          select id,edt dt ,-1 flag from play
     ) t
) m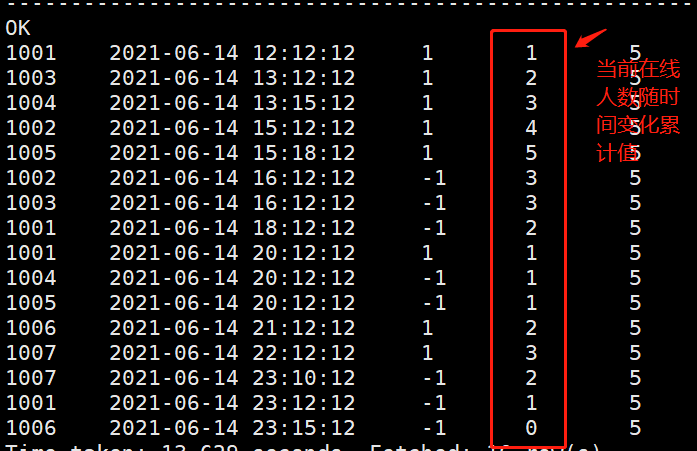
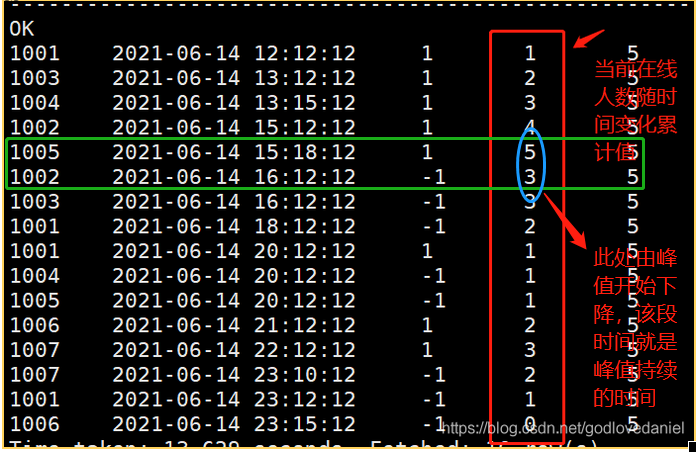
From the above figure, we can see that when the number of people decreases from the recording time of the peak to the next record, this period is the duration of the peak, or the peak period, that is, the time of the next record of the peak and the time of the record corresponding to the peak is the high peak period. Therefore, it is easy to find the answer to the question by using the lead() function. The SQL is as follows:
select max_cur_cnt
      ,dt as start_time
       ,lead_dt as end_time
from(
     select *
            ,lead(dt,1,dt) over(order by dt) lead_dt
     from(
           select *,max(cur_cnt) over() as max_cur_cnt
           from(
                  select id
                           ,dt
                           ,flag
                           ,sum(flag) over(order by dt) as cur_cnt
                  from(
                          select id,stt dt , 1 flag from play
                          union
                          select id,edt dt ,-1 flag from play
                  ) t
           ) m
     ) n
) p
where cur_cnt=max_cur_cnt
The calculation results are as follows:
--------------------------------------------------------------------------------
OK
5	2021-06-14 15:18:12	2021-06-14 16:12:12
Time taken: 17.513 seconds, Fetched: 1 row(s)
3 Summary
This paper analyzes the problem of SQL statistics on the number of people online at the same time, and uses the accumulator idea to solve the problem. Finally, it is classified into time series data for time series data analysis (common skills: labeling, forming sequences, and analyzing multiple sequences). Finally, sum() over() is used to accumulate the labels to calculate the current number of people online. The thinking method of this question is worth learning from, and can also be compared with the previous article to count the number and duration of power failure( https://blog.csdn.net/godlovedaniel/article/details/118027222 )To form a unified analysis method for such problems. The key point of this topic is the idea of converting into time series data and accumulator. I hope readers can master it