

The world is rarely perfect, and so are real-life data.
Creating information is like any creative process. It starts by finding the material (in this case, the data source) and then continues to clean up, join, and organize the dataset. When you're done, you've built something beautiful and gained new insights to share - and then you start again.
Python is one of the most widely used languages in information creation. It is loved by data scientists, engineers and analysts because it has a powerful ecosystem of existing libraries for data collation.
This blog post explores three such libraries: pandas,ddlgenerator, and psychopg2 These three enable us to clean up the dataset and push it to the PostgreSQL database, where we can later query the data and expose it to a variety of company data.
Today, the goal is simple: we will explore a happiness data set and try to find out where we should move to in the world to live a happy life!
0. Get dataset
As mentioned earlier, first find the dataset. Kaggle is a website widely used in the data science community, providing data sets for challenge, competition or learning. They have this very good data set about world happiness. They only need to download a login. It contains five CSV files, one each year, listing the happiness ranking of each country and some other indicators.
Let's create a folder named happiness and a subfolder named data storage file:
mkdir -p happiness/data
cd happiness
Next, download the data from Kaggle and put five CSV S into the happiness/data folder.
1. Clean up data
Because it happens so often, the source dataset is not always clean and tidy. This also applies to our happiness data set.
When browsing the file, we can notice that 2015 CSV and 2016 CSV shares the same column name and data format. In 2017 CSV has a missing Region column, and some people have different names and orders (Generosity and Trust are exchanged). The same applies to document 2018 CSV and 2019 CSV we can no longer find the confidence interval. In addition, the year is included only in the file name, not in the column.
Before we start our cleanup, it's a good practice to create a separate virtual environment every time we start a new Python project. This ensures that our default Python environment is not overloaded with potentially conflicting libraries. We can create a virtual environment and enable it like this:
python -m venv python_pg
source python_pg/bin/activate
These files need some work to produce a consistent data view, so let's wear our Python superhero mask. First, install the pandas library, which will help us with data operation and analysis by executing the following code in the terminal:
pip install pandas
Now we can prepare Py creates a file named in our happiness folder and starts to include some Python code in it. We will first import the previously installed libraries and the libraries that should be installed by default, and os glob enable interaction with the operating system and pathname mode extension respectively.
import pandas as pd
import glob, os
Next, define the column name we will use in the target DataFrame, all_years_df is used to store cleaned data sets. Add the following line to prepare Py file:
column_names = ['survey_yr', 'country', 'overall_rank',
                'score', 'gdp', 'generosity', 'freedom',
                'social_support', 'life_exp', 'gov_trust']

all_years_df = pd.DataFrame()
Now it's time to restore order and parse all CSV files in the file data folder. Add the following code to prepare Py file:
files = glob.glob('data/*.csv')

for fp in files:
    # Handling file names as new column
    file_year = os.path.basename(fp).split('.')[0]
    file_content = pd.read_csv(fp).assign(Year=int(file_year)-2000)

    # Picking the right column for each file based on the year
    uniformed_columns = find_columns(file_content, file_year)

    # Conforming column names and appending the parsed year data to all_years_df
    uniformed_columns.columns = column_names
    all_years_df = pd.concat([all_years_df, uniformed_columns])

all_years_df.to_csv('results.csv', index=False)
The glob function returns the file list in the file happiness/data folder. We iterate through it. For each file, we use read file OS path. Basename name, at point (.) Split the name and take the first part, and only extract the Year information. This file_ The content line uses the read of pandas_ The CSV function loads the file data and fills the new column with the last two digits of the assign Year (int(file_year)-2000) (using this function).
Next, we call find_columns is the function to be defined. Select the correct column from the source file according to the year.
After that, we merged unified_ Columns is the column name in the DataFrame containing only one year's data, and then all_years_df attaches it to the DataFrame that will contain the entire dataset at the end of the process. Finally, we store the final results in the folder named CSV file results happiness in CSV.
Select the correct column
The missing part is find_columns we combine the function definitions of column names and orders. As mentioned above, depending on the year, we need to select the correct column from the source file. Add the following code to prepare Py file, just after the import statement, to execute the technique in different years:
def find_columns(file_content, file_year):
    if file_year in ['2015', '2016']:
        uniformed_columns = file_content[[
            'Year', 'Country', 'Happiness Rank', 'Happiness Score',
            'Economy (GDP per Capita)', 'Generosity', 'Freedom', 'Family',
            'Health (Life Expectancy)', 'Trust (Government Corruption)'
            ]]

    elif file_year in ['2017']:
        uniformed_columns = file_content[[
            'Year', 'Country', 'Happiness.Rank', 'Happiness.Score',
            'Economy..GDP.per.Capita.', 'Generosity', 'Freedom', 'Family',
            'Health..Life.Expectancy.', 'Trust..Government.Corruption.'
            ]]

    else:
        uniformed_columns = file_content[[
            'Year', 'Country or region', 'Overall rank', 'Score',
            'GDP per capita', 'Generosity', 'Freedom to make life choices',
            'Social support', 'Healthy life expectancy',
            'Perceptions of corruption'
            ]]

    return uniformed_columns
This function selects the correct columns for each year and returns the resulting data frames.
It's time to check that the pipes are working properly. The terminal is located in the happiness folder. Let's do the following:
python prepare.py
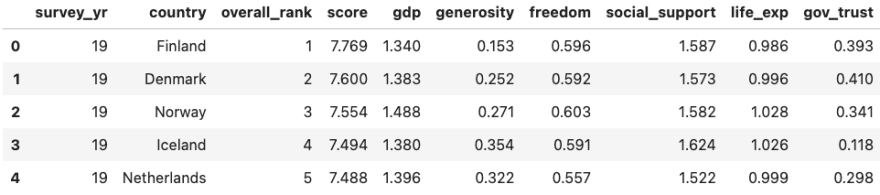
Now check the folder results The happiness file in CSV to verify that the code is valid. The results shall be as follows:
2. Create a PostgreSQL instance
The second step is to store our data in the PostgreSQL table. However, before storage, we need a PG database. Let's use Aiven CLI to create one in the terminal
avn service create demo-pg    \
  -t pg                       \
  --cloud google-europe-west3 \
  -p hobbyist
The above command creates a PostgreSQL instance named demo pgon using the plan. You can view all PostgreSQL plans on our pricing page. To connect to it, we need the information contained, as well as the default user. We can retrieve it in the following way: google-europe-west3hobbyistservice URI host port avnadmin password
avn service get demo-pg --format '{service_uri}'
Now relax for a few minutes while waiting in the terminal for the instance to be ready for the following call
avn service wait demo-pg
3. Push data to PostgreSQL
After the service runs, return to Python and prepare for data push.
We will use the ddlgenerator library to automatically generate SQL statements to create PostgreSQL tables and interact with the database using psychopg2. We can install them in the terminal using the following lines:
pip install psycopg2 ddlgenerator
Now create a new push Py file and add import and connect to database statements. Replace < service in the following code_ URI_ Replace the output > parameter with the output of the above avn service get command:
import psycopg2

conn = psycopg2.connect('<SERVICE_URI_OUTPUT>')
Connection established. We can now create tables and push data. ddlgenerator provides a good function to create DDL tables and insert statements from CSV files. We can attach the following code to push Py file:
from ddlgenerator.ddlgenerator import Table

table = Table('results.csv', table_name='HAPPINESS')
sql = table.sql('postgresql', inserts=True)
After importing the Table class from ddlgenerator, the code creates a parsing result The instance of CSV file, and the target Table name is HAPPINESS The last line creates a Table definition SQL, including insert statements for each row (inserts=True). If we print the SQL statement, it should be as follows:
DROP TABLE IF EXISTS happiness;

CREATE TABLE happiness (
    survey_yr INTEGER NOT NULL,
    country VARCHAR(24) NOT NULL,
    overall_rank INTEGER NOT NULL,
    score DECIMAL(15, 14) NOT NULL,
    gdp DECIMAL(17, 16) NOT NULL,
    generosity DECIMAL(16, 16) NOT NULL,
    freedom DECIMAL(16, 16) NOT NULL,
    social_support DECIMAL(16, 15) NOT NULL,
    life_exp DECIMAL(17, 16) NOT NULL,
    gov_trust DECIMAL(16, 16)
);

INSERT INTO happiness (survey_yr, country, overall_rank, score, gdp, generosity, freedom, social_support, life_exp, gov_trust) VALUES (19, 'Finland', 1, 7.769, 1.34, 0.153, 0.596, 1.587, 0.986, 0.393);
INSERT INTO happiness (survey_yr, country, overall_rank, score, gdp, generosity, freedom, social_support, life_exp, gov_trust) VALUES (19, 'Denmark', 2, 7.6, 1.383, 0.252, 0.592, 1.573, 0.996, 0.41);
...
We can now add the following code to push Py file to execute sql statements on the database
cur = conn.cursor()
cur.execute(sql)
conn.commit()
cur.close()
conn.close()
We created a cursor, executed sql statements, committed changes to the database, and closed the cursor and connection. It's time to run the code. Using the same terminal on the happiness folder, run the following command:
python push.py
Congratulations, the data is now loaded into PostgreSQL.
Querying data in PostgreSQL
Let's verify that the data is correctly populated into the PostgreSQLhappiness table. Create a new Python file query Py, as follows (as before, modify the connection service uri):
import psycopg2

conn = psycopg2.connect('<SERVICE_URI_OUTPUT>')

cur = conn.cursor()
cur.execute('''
SELECT SURVEY_YR, COUNTRY, OVERALL_RANK
from HAPPINESS
WHERE OVERALL_RANK <= 3
ORDER BY SURVEY_YR, OVERALL_RANK
''')

print(cur.fetchall())
cur.close()
conn.close()
According to push Py file, we are creating a connection with PostgreSQL, and then executing a query to check which countries / regions rank the top three in different years. The result should be similar to:
[
(15, 'Switzerland', 1),   (15, 'Iceland', 2),       (15, 'Denmark', 3),
(16, 'Denmark', 1),       (16, 'Switzerland', 2),   (16, 'Iceland', 3),
(17, 'Norway', 1),        (17, 'Denmark', 2),       (17, 'Iceland', 3),
(18, 'Finland', 1),       (18, 'Norway', 2),        (18, 'Denmark', 3),
(19, 'Finland', 1),       (19, 'Denmark', 2),       (19, 'Norway', 3)
]
It seems that the Nordic countries are very suitable for living! Please pay special attention to the performance of Elvin's motherland, Finland, in the past two years.
These data can now be used in PostgreSQL relational tables, and all major analysis and reporting tools can be queried and exposed, so that the data can be accessed by a wider audience.
Wrapping up
Finding the right data set is just the beginning: cleaning up, collating, and publishing data creates information to help people make decisions. Python is well suited to this field and is widely adopted by the data community. The pandas,ddlgenerator and psychopg2 libraries mentioned in the blog can easily process data and push it to PostgreSQL. This lays a solid foundation for data discovery or company reporting.