catalogue
1.2. There are still many pits to fill after deployment
2. Dashboard deployment (visualization)
2.5 the default dashboard does not have permission to operate the cluster and requires authorization
2.6 cluster operation through web
1. Metrics-Server
1.0 preliminary preparation
k8s Chinese official website
gitee official website
1.1 metrics server deployment
-
Metrics server is the aggregator of cluster core monitoring data (cpu and memory), which is used to replace the previous heapster.
-
Container related Metrics mainly come from the built-in C advisor service of kubelet. With Metrics server, users can pass the standard Kubernetes API to access these monitoring data.
The Metrics API can only query the current measurement data and does not save historical data.
The Metrics API URI is / APIs / metrics k8s. IO /, at k8s IO / metrics maintenance.
Metrics server must be deployed to use this API. Metrics server obtains data by calling Kubelet Summary API. -
Example:
http://127.0.0.1:8001/apis/metrics.k8s.io/v1beta1/nodes
http://127.0.0.1:8001/apis/metrics.k8s.io/v1beta1/nodes/<node-name>
http://127.0.0.1:8001/apis/metrics.k8s.io/v1beta1/namespace/<namespace-name>/pods/<pod-name> -
Metrics Server is not a part of Kube apiserver, but a unified external service with Kube apiserver under the condition of independent deployment through the plug-in mechanism of Aggregator.
-
Kube aggregator (default self startup) is actually a proxy server that selects a specific API backend according to the URL.
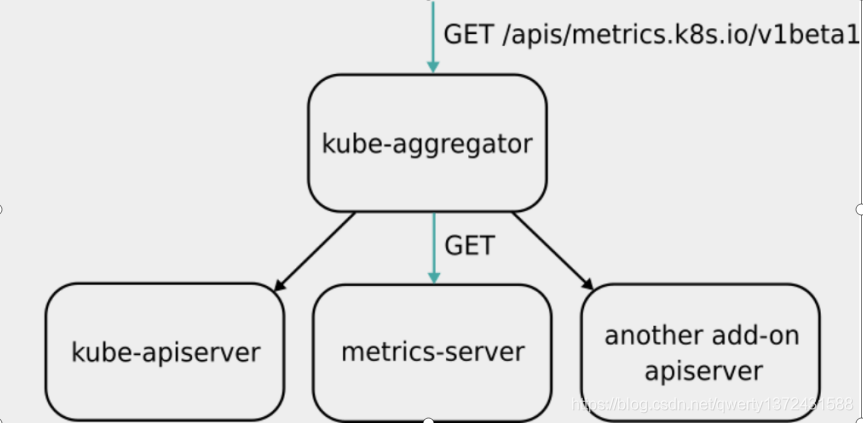
-
Metrics server belongs to core metrics and provides API metrics k8s. IO, which only provides the CPU and memory usage of Node and Pod. Other custom metrics are completed by Prometheus and other components.
Resource download -
Metrics server deployment:
$ kubectl apply -f https://github.com/kubernetes-sigs/metrics-server/releases/download/v0.3.6/components.yaml
[root@server2 ~]# kubectl top node   ##Check whether there is metric
error: Metrics API not available
[root@server2 ~]# kubectl api-versions | grep metric

##1. Pull the image
[root@server1 harbor]# docker pull bitnami/metrics-server:0.4.0 ##Pull the image. You can specify the version later. The latest version is 0.4.2
[root@server1 harbor]# docker tag bitnami/metrics-server:0.4.0 reg.westos.org/library/metrics-server:0.4.0   ##Change name
[root@server1 harbor]# docker push reg.westos.org/library/metrics-server:0.4.0  ##Upload image

##2. Configuration
[root@server2 metric-server]# pwd  ##Create experiment directory
/root/metric-server
[root@server2 metric-server]# wget https://github.com/kubernetes-sigs/metrics-server/releases/latest/download/components.yaml ## deployment profile
[root@server2 metric-server]# ll components.yaml
[root@server2 metric-server]# vim components.yaml
[root@server2 metric-server]# cat components.yaml
apiVersion: v1
kind: ServiceAccount
metadata:
  labels:
    k8s-app: metrics-server
  name: metrics-server
  namespace: kube-system
---
apiVersion: rbac.authorization.k8s.io/v1
kind: ClusterRole
metadata:
  labels:
    k8s-app: metrics-server
    rbac.authorization.k8s.io/aggregate-to-admin: "true"
    rbac.authorization.k8s.io/aggregate-to-edit: "true"
    rbac.authorization.k8s.io/aggregate-to-view: "true"
  name: system:aggregated-metrics-reader
rules:
- apiGroups:
  - metrics.k8s.io
  resources:
  - pods
  - nodes
  verbs:
  - get
  - list
  - watch
---
apiVersion: rbac.authorization.k8s.io/v1
kind: ClusterRole
metadata:
  labels:
    k8s-app: metrics-server
  name: system:metrics-server
rules:
- apiGroups:
  - ""
  resources:
  - pods
  - nodes
  - nodes/stats
  - namespaces
  - configmaps
  verbs:
  - get
  - list
  - watch
---
apiVersion: rbac.authorization.k8s.io/v1
kind: RoleBinding
metadata:
  labels:
    k8s-app: metrics-server
  name: metrics-server-auth-reader
  namespace: kube-system
roleRef:
  apiGroup: rbac.authorization.k8s.io
  kind: Role
  name: extension-apiserver-authentication-reader
subjects:
- kind: ServiceAccount
  name: metrics-server
  namespace: kube-system
---
apiVersion: rbac.authorization.k8s.io/v1
kind: ClusterRoleBinding
metadata:
  labels:
    k8s-app: metrics-server
  name: metrics-server:system:auth-delegator
roleRef:
  apiGroup: rbac.authorization.k8s.io
  kind: ClusterRole
  name: system:auth-delegator
subjects:
- kind: ServiceAccount
  name: metrics-server
  namespace: kube-system
---
apiVersion: rbac.authorization.k8s.io/v1
kind: ClusterRoleBinding
metadata:
  labels:
    k8s-app: metrics-server
  name: system:metrics-server
roleRef:
  apiGroup: rbac.authorization.k8s.io
  kind: ClusterRole
  name: system:metrics-server
subjects:
- kind: ServiceAccount
  name: metrics-server
  namespace: kube-system
---
apiVersion: v1
kind: Service
metadata:
  labels:
    k8s-app: metrics-server
  name: metrics-server
  namespace: kube-system
spec:
  ports:
  - name: https
    port: 443
    protocol: TCP
    targetPort: https
  selector:
    k8s-app: metrics-server
---
apiVersion: apps/v1
kind: Deployment
metadata:
  labels:
    k8s-app: metrics-server
  name: metrics-server
  namespace: kube-system
spec:
  selector:
    matchLabels:
      k8s-app: metrics-server
  strategy:
    rollingUpdate:
      maxUnavailable: 0
  template:
    metadata:
      labels:
        k8s-app: metrics-server
    spec:
      containers:
      - args:
        - --cert-dir=/tmp
        - --secure-port=4443
        - --kubelet-preferred-address-types=InternalIP,ExternalIP,Hostname
        - --kubelet-use-node-status-port
        image: metrics-server:0.4.0
        imagePullPolicy: IfNotPresent
        livenessProbe:
          failureThreshold: 3
          httpGet:
            path: /livez
            port: https
            scheme: HTTPS
          periodSeconds: 10
        name: metrics-server
        ports:
        - containerPort: 4443
          name: https
          protocol: TCP
        readinessProbe:
          failureThreshold: 3
          httpGet:
            path: /readyz
            port: https
            scheme: HTTPS
          periodSeconds: 10
        securityContext:
          readOnlyRootFilesystem: true
          runAsNonRoot: true
          runAsUser: 1000
        volumeMounts:
        - mountPath: /tmp
          name: tmp-dir
      nodeSelector:
        kubernetes.io/os: linux
      priorityClassName: system-cluster-critical
      serviceAccountName: metrics-server
      volumes:
      - emptyDir: {}
        name: tmp-dir
---
apiVersion: apiregistration.k8s.io/v1
kind: APIService
metadata:
  labels:
    k8s-app: metrics-server
  name: v1beta1.metrics.k8s.io
spec:
  group: metrics.k8s.io
  groupPriorityMinimum: 100
  insecureSkipTLSVerify: true
  service:
    name: metrics-server
    namespace: kube-system
  version: v1beta1
  versionPriority: 100

[root@server2 metric-server]# kubectl -n kube-system get pod  ##Running but not ready
[root@server2 metric-server]# kubectl -n kube-system get svc   ##View services
NAME             TYPE        CLUSTER-IP     EXTERNAL-IP   PORT(S)                  AGE
kube-dns         ClusterIP   10.96.0.10     <none>        53/UDP,53/TCP,9153/TCP   11d
metrics-server   ClusterIP   10.111.23.49   <none>        443/TCP                  3m
[root@server2 metric-server]# kubectl api-versions | grep metric
metrics.k8s.io/v1beta1
[root@server2 metric-server]# kubectl -n kube-system describe pod metrics-server-cc476ccf8-sq92s    ##Failed to run successfully. See the detailed description
[root@server2 metric-server]# kubectl -n kube-system logs metrics-server-cc476ccf8-sq92s  ##Run successfully, error viewing log
[root@server2 metric-server]# vim /var/lib/kubelet/config.yaml   ##Resolve error 2. Each machine needs to modify the configuration file and restart. Add servertlsbootstrap in the last line: true
[root@server2 metric-server]# systemctl restart kubelet.service

[root@server2 metric-server]# kubectl get csr   ##View csr
[root@server2 metric-server]# kubectl certificate approve csr-252k4 csr-bxcq2 csr-d7wd9 csr-dbl6s csr-q55sf csr-tfhpk       ####grant a certificate
[root@server2 metric-server]# kubectl -n kube-system get pod   ##Check whether to run
[root@server2 metric-server]# kubectl -n kube-system top pod   ##View pod allocation
[root@server2 metric-server]# kubectl top node
1.2. There are still many pits to fill after deployment
View after deployment Metrics-server of Pod journal:
	Error 1: dial tcp: lookup server2 on 10.96.0.10:53: no such host
		This is because there is no intranet DNS Server, so metrics-server Unable to resolve node name. It can be modified directly coredns of configmap,Add the host name of each node to the hosts In this way, all Pod Can be from CoreDNS Resolve the name of each node in.
		$ kubectl edit configmap coredns -n kube-system
		apiVersion: v1
		data:
		  Corefile: |
		    ...
		        ready
		        hosts {
		           172.25.0.11 server1
		           172.25.0.12 server2
		           172.25.0.13 server3
		           fallthrough
		        }
		        kubernetes cluster.local in-addr.arpa ip6.arpa {


	Error 2: x509: certificate signed by unknown authority(The new version has only error 2)
		Metric Server One parameter is supported --kubelet-insecure-tls,You can skip this check, but officials also made it clear that this method is not recommended for production.
		Enable TLS Bootstrap Certificate issuance
		# vim /var/lib/kubelet/config.yaml
		...
		serverTLSBootstrap: true
		# systemctl  restart kubelet
		$ kubectl get csr
			NAME        AGE     REQUESTOR                     CONDITION
			csr-f29hk   5s      system:node:node-standard-2   Pending
			csr-n9pvr   3m31s   system:node:node-standard-3   Pending
		$ kubectl certificate approve csr-n9pvr   ##grant a certificate


	Error reporting 3: Error from server (ServiceUnavailable): the server is currently unable to handle the request (get nodes.metrics.k8s.io)
		If metrics-server It starts normally without error. It should be a network problem. modify metrics-server of Pod Network mode:
		hostNetwork: true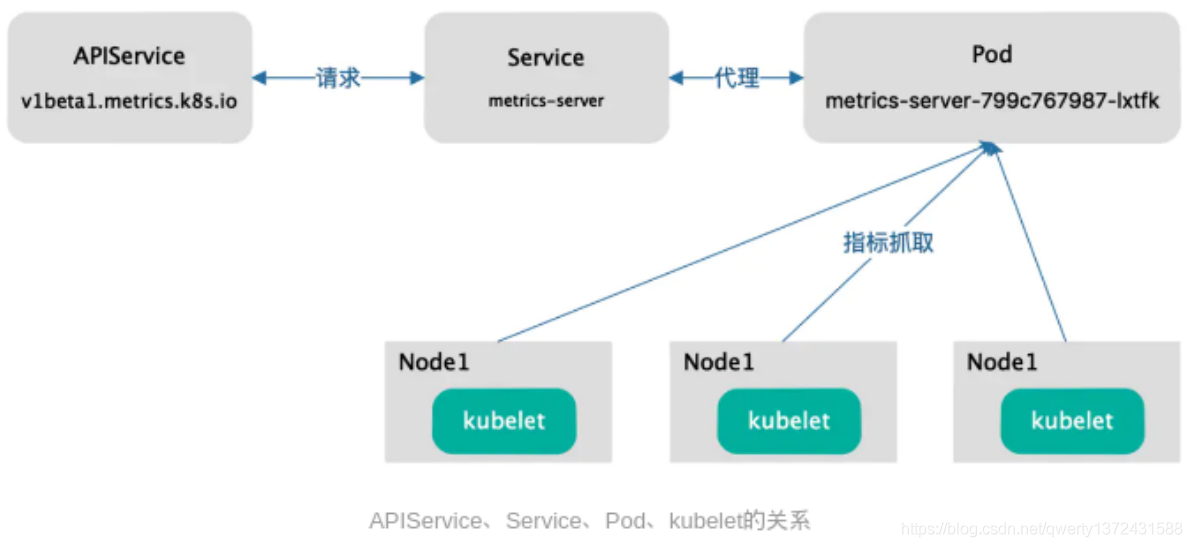
2. Dashboard deployment (visualization)
- Dashboard can provide users with a visual Web interface to view various information of the current cluster. Users can use Kubernetes Dashboard to deploy containerized applications, monitor the status of applications, perform troubleshooting tasks, and manage various Kubernetes resources.
##1. Pull the image
[root@server1 harbor]# docker pull kubernetesui/dashboard:v2.2.0
[root@server1 harbor]# docker tag kubernetesui/dashboard:v2.2.0 reg.westos.org/kubernetesui/kubernetesui/dashboard:v2.2.0
[root@server1 harbor]# docker push reg.westos.org/kubernetesui/kubernetesui/dashboard:v2.2.0

[root@server1 harbor]# docker pull kubernetesui/metrics-scraper:v1.0.6
[root@server1 harbor]# docker tag kubernetesui/metrics-scraper:v1.0.6 reg.westos.org/kubernetesui/metrics-scraper:v1.0.6
[root@server1 harbor]# docker push reg.westos.org/kubernetesui/metrics-scraper:v1.0.6

## 2. Configuration
[root@server2 dashboard]# wget https://raw.githubusercontent.com/kubernetes/dashboard/v2.2.0/aio/deploy/recommended.yaml ## downloads the configuration file. There is no need to change the file inside
[root@server2 dashboard]# cat recommended.yaml
# Copyright 2017 The Kubernetes Authors.
#
# Licensed under the Apache License, Version 2.0 (the "License");
# you may not use this file except in compliance with the License.
# You may obtain a copy of the License at
#
#     http://www.apache.org/licenses/LICENSE-2.0
#
# Unless required by applicable law or agreed to in writing, software
# distributed under the License is distributed on an "AS IS" BASIS,
# WITHOUT WARRANTIES OR CONDITIONS OF ANY KIND, either express or implied.
# See the License for the specific language governing permissions and
# limitations under the License.

apiVersion: v1
kind: Namespace
metadata:
  name: kubernetes-dashboard

---

apiVersion: v1
kind: ServiceAccount
metadata:
  labels:
    k8s-app: kubernetes-dashboard
  name: kubernetes-dashboard
  namespace: kubernetes-dashboard

---

kind: Service
apiVersion: v1
metadata:
  labels:
    k8s-app: kubernetes-dashboard
  name: kubernetes-dashboard
  namespace: kubernetes-dashboard
spec:
  ports:
    - port: 443
      targetPort: 8443
  selector:
    k8s-app: kubernetes-dashboard

---

apiVersion: v1
kind: Secret
metadata:
  labels:
    k8s-app: kubernetes-dashboard
  name: kubernetes-dashboard-certs
  namespace: kubernetes-dashboard
type: Opaque

---

apiVersion: v1
kind: Secret
metadata:
  labels:
    k8s-app: kubernetes-dashboard
  name: kubernetes-dashboard-csrf
  namespace: kubernetes-dashboard
type: Opaque
data:
  csrf: ""

---

apiVersion: v1
kind: Secret
metadata:
  labels:
    k8s-app: kubernetes-dashboard
  name: kubernetes-dashboard-key-holder
  namespace: kubernetes-dashboard
type: Opaque

---

kind: ConfigMap
apiVersion: v1
metadata:
  labels:
    k8s-app: kubernetes-dashboard
  name: kubernetes-dashboard-settings
  namespace: kubernetes-dashboard

---

kind: Role
apiVersion: rbac.authorization.k8s.io/v1
metadata:
  labels:
    k8s-app: kubernetes-dashboard
  name: kubernetes-dashboard
  namespace: kubernetes-dashboard
rules:
  # Allow Dashboard to get, update and delete Dashboard exclusive secrets.
  - apiGroups: [""]
    resources: ["secrets"]
    resourceNames: ["kubernetes-dashboard-key-holder", "kubernetes-dashboard-certs", "kubernetes-dashboard-csrf"]
    verbs: ["get", "update", "delete"]
    # Allow Dashboard to get and update 'kubernetes-dashboard-settings' config map.
  - apiGroups: [""]
    resources: ["configmaps"]
    resourceNames: ["kubernetes-dashboard-settings"]
    verbs: ["get", "update"]
    # Allow Dashboard to get metrics.
  - apiGroups: [""]
    resources: ["services"]
    resourceNames: ["heapster", "dashboard-metrics-scraper"]
    verbs: ["proxy"]
  - apiGroups: [""]
    resources: ["services/proxy"]
    resourceNames: ["heapster", "http:heapster:", "https:heapster:", "dashboard-metrics-scraper", "http:dashboard-metrics-scraper"]
    verbs: ["get"]

---

kind: ClusterRole
apiVersion: rbac.authorization.k8s.io/v1
metadata:
  labels:
    k8s-app: kubernetes-dashboard
  name: kubernetes-dashboard
rules:
  # Allow Metrics Scraper to get metrics from the Metrics server
  - apiGroups: ["metrics.k8s.io"]
    resources: ["pods", "nodes"]
    verbs: ["get", "list", "watch"]

---

apiVersion: rbac.authorization.k8s.io/v1
kind: RoleBinding
metadata:
  labels:
    k8s-app: kubernetes-dashboard
  name: kubernetes-dashboard
  namespace: kubernetes-dashboard
roleRef:
  apiGroup: rbac.authorization.k8s.io
  kind: Role
  name: kubernetes-dashboard
subjects:
  - kind: ServiceAccount
    name: kubernetes-dashboard
    namespace: kubernetes-dashboard

---

apiVersion: rbac.authorization.k8s.io/v1
kind: ClusterRoleBinding
metadata:
  name: kubernetes-dashboard
roleRef:
  apiGroup: rbac.authorization.k8s.io
  kind: ClusterRole
  name: kubernetes-dashboard
subjects:
  - kind: ServiceAccount
    name: kubernetes-dashboard
    namespace: kubernetes-dashboard

---

kind: Deployment
apiVersion: apps/v1
metadata:
  labels:
    k8s-app: kubernetes-dashboard
  name: kubernetes-dashboard
  namespace: kubernetes-dashboard
spec:
  replicas: 1
  revisionHistoryLimit: 10
  selector:
    matchLabels:
      k8s-app: kubernetes-dashboard
  template:
    metadata:
      labels:
        k8s-app: kubernetes-dashboard
    spec:
      containers:
        - name: kubernetes-dashboard
          image: kubernetesui/dashboard:v2.2.0
          imagePullPolicy: Always
          ports:
            - containerPort: 8443
              protocol: TCP
          args:
            - --auto-generate-certificates
            - --namespace=kubernetes-dashboard
            # Uncomment the following line to manually specify Kubernetes API server Host
            # If not specified, Dashboard will attempt to auto discover the API server and connect
            # to it. Uncomment only if the default does not work.
            # - --apiserver-host=http://my-address:port
          volumeMounts:
            - name: kubernetes-dashboard-certs
              mountPath: /certs
              # Create on-disk volume to store exec logs
            - mountPath: /tmp
              name: tmp-volume
          livenessProbe:
            httpGet:
              scheme: HTTPS
              path: /
              port: 8443
            initialDelaySeconds: 30
            timeoutSeconds: 30
          securityContext:
            allowPrivilegeEscalation: false
            readOnlyRootFilesystem: true
            runAsUser: 1001
            runAsGroup: 2001
      volumes:
        - name: kubernetes-dashboard-certs
          secret:
            secretName: kubernetes-dashboard-certs
        - name: tmp-volume
          emptyDir: {}
      serviceAccountName: kubernetes-dashboard
      nodeSelector:
        "kubernetes.io/os": linux
      # Comment the following tolerations if Dashboard must not be deployed on master
      tolerations:
        - key: node-role.kubernetes.io/master
          effect: NoSchedule

---

kind: Service
apiVersion: v1
metadata:
  labels:
    k8s-app: dashboard-metrics-scraper
  name: dashboard-metrics-scraper
  namespace: kubernetes-dashboard
spec:
  ports:
    - port: 8000
      targetPort: 8000
  selector:
    k8s-app: dashboard-metrics-scraper

---

kind: Deployment
apiVersion: apps/v1
metadata:
  labels:
    k8s-app: dashboard-metrics-scraper
  name: dashboard-metrics-scraper
  namespace: kubernetes-dashboard
spec:
  replicas: 1
  revisionHistoryLimit: 10
  selector:
    matchLabels:
      k8s-app: dashboard-metrics-scraper
  template:
    metadata:
      labels:
        k8s-app: dashboard-metrics-scraper
      annotations:
        seccomp.security.alpha.kubernetes.io/pod: 'runtime/default'
    spec:
      containers:
        - name: dashboard-metrics-scraper
          image: kubernetesui/metrics-scraper:v1.0.6
          ports:
            - containerPort: 8000
              protocol: TCP
          livenessProbe:
            httpGet:
              scheme: HTTP
              path: /
              port: 8000
            initialDelaySeconds: 30
            timeoutSeconds: 30
          volumeMounts:
          - mountPath: /tmp
            name: tmp-volume
          securityContext:
            allowPrivilegeEscalation: false
            readOnlyRootFilesystem: true
            runAsUser: 1001
            runAsGroup: 2001
      serviceAccountName: kubernetes-dashboard
      nodeSelector:
        "kubernetes.io/os": linux
      # Comment the following tolerations if Dashboard must not be deployed on master
      tolerations:
        - key: node-role.kubernetes.io/master
          effect: NoSchedule
      volumes:
        - name: tmp-volume
          emptyDir: {}

[root@server2 dashboard]# kubectl apply -f recommended.yaml
[root@server2 dashboard]# kubectl get ns   ##Use metallb. For external access, you can also use nortport and ingress
metallb-system           Active   7d1h

[root@server2 dashboard]# kubectl -n kubernetes-dashboard get pod
[root@server2 dashboard]# kubectl -n metallb-system get pod    ##View the pod corresponding to metallb

[root@server2 dashboard]# kubectl -n kubernetes-dashboard edit svc kubernetes-dashboard
##Edit the configuration file and set it to LoadBalancer
[root@server2 dashboard]# kubectl -n kubernetes-dashboard get svc   ##View assigned VIPs
NAME                        TYPE           CLUSTER-IP       EXTERNAL-IP     PORT(S)         AGE
dashboard-metrics-scraper   ClusterIP      10.107.103.161   <none>          8000/TCP        6m58s
kubernetes-dashboard        LoadBalancer   10.105.128.116   172.25.13.101   443:30250/TCP   6m58s
2.1 pulling image
2.2 configuration
2.3. Test: log in to Firefox browser and enter https://172.25.13.101 , access succeeded, but token authorization is required
2.4 authorization
 - land dashboard Need certification, need to obtain dashboard pod of token:
	$ kubectl describe secrets  kubernetes-dashboard-token-g2g6g -n kubernetes-dashboard
[root@server2 dashboard]# kubectl -n kubernetes-dashboard get sa
NAME                   SECRETS   AGE
default                1         14m
kubernetes-dashboard   1         14m
[root@server2 dashboard]# kubectl -n kubernetes-dashboard describe sa kubernetes-dashboard
[root@server2 dashboard]# kubectl describe secrets  kubernetes-dashboard-token-c7l79 -n kubernetes-dashboard     ##View the specific information of token

##Go to the browser and enter the token information
2.5 the default dashboard does not have permission to operate the cluster and requires authorization
[root@server2 dashboard]# vim rbac.yaml
[root@server2 dashboard]# cat rbac.yaml
apiVersion: rbac.authorization.k8s.io/v1
kind: ClusterRoleBinding
metadata:
  name: kubernetes-dashboard-admin
roleRef:
  apiGroup: rbac.authorization.k8s.io
  kind: ClusterRole
  name: cluster-admin
subjects:
- kind: ServiceAccount
  name: kubernetes-dashboard
  namespace: kubernetes-dashboard
[root@server2 dashboard]# kubectl apply -f rbac.yaml

##Go to browser operation
2.6 cluster operation through web
2.7 supplement
- If the Dashboard cannot display the data indicators of metrics server, it can be solved in the following two ways:
Modify the Pod network mode of dashboard metrics scraper: hostNetwork: true
Through the affinity setting of node or pod, make the dashboard metrics scraper and the pod of metrics server on the same node.