Now move!
Pandas is a powerful tool set for analyzing structured data; It is based on Numpy (providing high-performance matrix operation); It is used for data mining and data analysis, and also provides data cleaning function. It is a powerful tool for data work under Python. It is widely used in many fields, such as data analysis, machine learning, finance, statistics and so on. If you want to get involved in these fields, pandas suggests that you must learn.
Two data structures
- DataFrame -- labeled, variable size, two-dimensional heterogeneous table
- Series -- one dimensional isomorphic array with label
Focus on DataFrame, which is a tabular data structure in Pandas. It contains a set of ordered columns. Each column can be of different value types (numeric, string, Boolean, etc.). DataFrame has both row index and column index, which can be regarded as a dictionary composed of Series.
Obtain financial data Dataframe
Jukuan is a good quantitative trading cloud platform in China. At present, it can obtain the right to use local data through application. After authorization, you can get the data you want through the SDK provided by it. Here, we will show the use of DataFrame through an example of obtaining financial data of listed companies.
import jqdatasdk as d

def auth(username, password):
    d.auth(username, password)
    if not d.is_auth():
        raise Exception('Auth failed')


def get_financial_report():
    q = d.query(
        d.valuation, d.income
    ).filter(
        d.valuation.code.in_(['000001.XSHE', '600519.XSHG', '000009.XSHE', '600000.XSHG'])
    )
    df = d.get_fundamentals(q, date='2015-10-15')
    return df


if __name__ == '__main__':
    auth('Your telephone number', 'password')
    res = get_financial_report()
    print(res)
D.get here_ Fundamentals returns a DataFrame object. As mentioned above, DataFrame is a two-dimensional table. What is the specific situation. We can pass Columns method to view the supported columns:
> df.index
> Index(['id', 'code', 'pe_ratio', 'turnover_ratio', 'pb_ratio', 'ps_ratio',
       'pcf_ratio', 'capitalization', 'market_cap', 'circulating_cap',
       ...,
       'ci_minority_owners'],
      dtype='object')
Since the financial data we obtained here is aggregated wide, we can see that a lot of columns are returned.
We can use the tail() method to easily return a piece of data at the specified tail, or we can view the first piece of data through the head() method.
> df.tail(1)
> [1 rows x 56 columns]
        id         code  ...  ci_parent_company_owners  ci_minority_owners
0  5024884  000001.XSHE  ...                       NaN                 0.0
describe view simple statistics
DataFrame also provides a method called describe() to quickly view the statistical summary of data. For example, here you can view the statistical summary of these companies.
                 id   pe_ratio  ...  ci_parent_company_owners  ci_minority_owners
count  4.000000e+00   4.000000  ...              3.000000e+00        3.000000e+00
mean   5.130738e+07  26.053175  ...              9.289807e+09        3.540128e+08
std    1.152475e+03  21.007061  ...              8.683778e+09        3.138209e+08
min    5.130583e+07   5.946700  ...              6.309906e+07        1.260925e+08
25%    5.130700e+07  10.042600  ...              5.283211e+09        1.750462e+08
50%    5.130756e+07  23.860150  ...              1.050332e+10        2.240000e+08
75%    5.130794e+07  39.870725  ...              1.390316e+10        4.679730e+08
max    5.130859e+07  50.545700  ...              1.730300e+10        7.119460e+08
The fields automatically calculated by the describe() function include count, unique, top and freq
rolling moving window function
This is a very useful function in quantitative analysis. For example, for the closing price of a stock in a period of time, if you want to quickly obtain the highest price in the last 30 days of each day in this period of time, you can use this function to quickly obtain it.
stock_dataframe.High.rolling(window=30).max()
Series
As mentioned earlier, Series is isomorphic one-dimensional data. In fact, here is a column in DataFrame, such as Ci_ parent_ company_ If you want to obtain the data in this column, use DF ci_ parent_ company_ Owners or df['ci_parent_company_owners'].
Convenient drawing ability
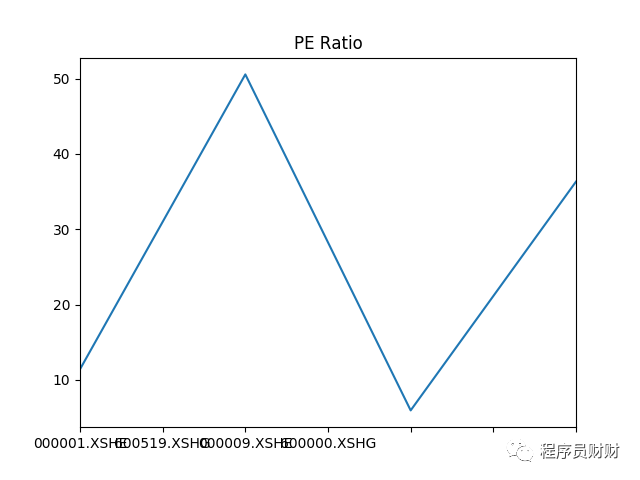
We can easily draw rich charts like Matlab by using Pandas. For example, we can show the P / E ratio data of four companies obtained in the above code by adding the following code:
plot = df['pe_ratio'].plot(title='PE Ratio')
plot.set_xticklabels(['000001.XSHE', '600519.XSHG', '000009.XSHE', '600000.XSHG'])
plt.show()
last
The functions of Pandas are far more than those listed here. It just opens a door here. The world outside the door still needs you and me to explore together. In data analysis, Pandas is undoubtedly our magic weapon. We can use it to calculate various functions and display icons conveniently, which will greatly improve our work efficiency. In the future, I will gradually record more interesting ways to play.