Forum original address (continuously updated): http://www.armbbs.cn/forum.php?mod=viewthread&tid=99514
Chapter 16} implementation of ThreadX original task statistical analysis function (used by ThreadX plug-in with IAR)
This chapter explains the implementation of the original task statistical analysis function of ThreadX, which supports MDK, IAR and GCC.
catalogue
16.1 implementation principle of task statistical analysis of ThreadX
16.2 transplantation of task statistical analysis function of ThreadX
16.2.1} add task analysis code
16.2.2 setting macro definitions
16.2.3} enable DWT clock cycle timer
16.2.4} display task statistics method
16.3 implementation of ThreadX plug-in of IAR
16.1 implementation principle of ThreadX task statistical analysis
For Cortex-M core, DWT clock cycle counter is provided. For example, if the main frequency of the chip is 100MHz, the clock cycle resolution of DWT statistics is 10ns.
ThreadX implements task statistical analysis with this function. It is simple to use and can be used only by enabling. M3, M4 and M7 cores all have this function, but M0 core does not. Pay attention to it in use.
16.2 transplantation of task statistical analysis function of ThreadX
Here, taking the transplantation to MDK as an example, the transplantation methods of other IAR and GCC are the same.
16.2.1} add task analysis code
From ThreadX kernel V6 Since version 1.7, the task statistical analysis function has been added, which is located in the following path of the source software package:
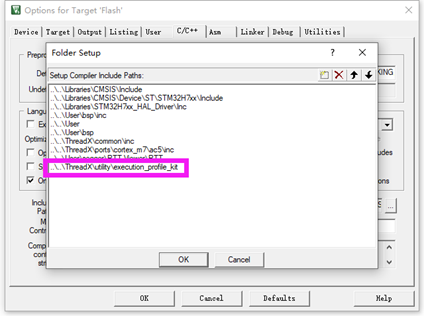
ThreadX\utility\execution_profile_kit .
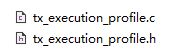
According to the migration method in the previous chapter, upgrade the version of ThreadX kernel to V6 After 1.7, add this file.
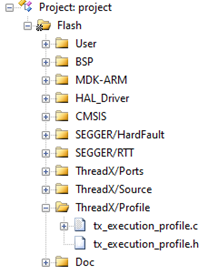
Don't forget to add the appropriate path:
16.2.2 setting macro definitions
C file to add macro definition: TX_EXECUTION_PROFILE_ENABLE, TX_CORTEX_M_EPK
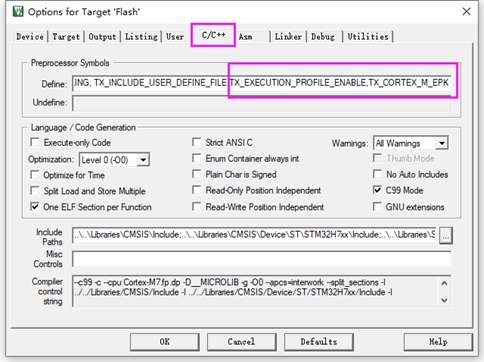
Macro definition to be added to assembly file: TX_EXECUTION_PROFILE_ENABLE,TX_ENABLE_EXECUTION_CHANGE_NOTIFY
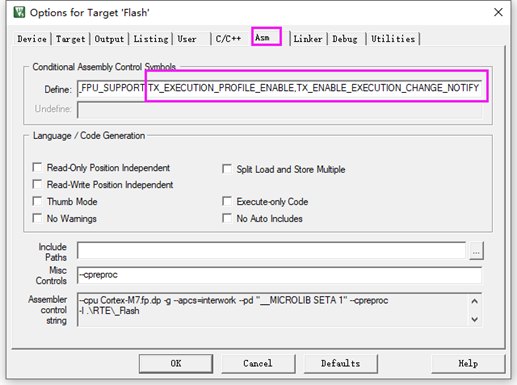
For MDK AC5, Misc Controls plus – cpreproc
16.2.3} enable DWT clock cycle timer
By default, the migration file TX of ThreadX_ initialize_ low_ level. S with DWT clock cycle counter enable:
    /* Enable the cycle count register.  */

    LDR     r0, =0xE0001000                         ; Build address of DWT register
    LDR     r1, [r0]                                ; Pickup the current value
    ORR     r1, r1, #1                              ; Set the CYCCNTENA bit
STR     r1, [r0]                                ; Enable the cycle count register
To be on the safe side, at BSP C file also calls the function bsp_InitDWT() initializes.
16.2.4} display task statistics method
Threadx provides statistical time information of three 64bit global variables. The unit is the system clock counter. For example, if the dominant frequency is 100MHz, the unit is 10ns.
- _tx_execution_thread_time_total
Count the total running time of all tasks since power on.
- _tx_execution_idle_time_total
Count the total idle time since power on.
- _tx_execution_isr_time_total
Count the total implementation of interrupt service program from power on.
To facilitate CPU utilization statistics, you can use:
_tx_execution_thread_time_total/(_tx_execution_thread_time_total + _tx_execution_idle_time_total + _tx_execution_isr_time_total)
However, this kind of statistics cannot reflect the instantaneous change of CPU utilization, so an instantaneous statistical method is made to make statistics every 200ms:
/*
*********************************************************************************************************
*    Function name: AppTaskStart
*    Function Description: start task.
*    Formal parameter: thread_input is the formal parameter passed when the task is created
*    Return value: None
    Priority: 2
*********************************************************************************************************
*/
static  void  AppTaskStart (ULONG thread_input)
{
    EXECUTION_TIME TolTime, IdleTime, deltaTolTime, deltaIdleTime;
    uint32_t uiCount = 0;
    (void)thread_input;


    /* After the kernel is turned on, restore the time benchmark in HAL */
    HAL_ResumeTick();

    /* Peripheral initialization */
    bsp_Init();

    /* Create task */
    AppTaskCreate();

    /* Create inter task communication mechanism */
    AppObjCreate();

    /* Calculate CPU utilization */
    IdleTime = _tx_execution_idle_time_total;
    TolTime = _tx_execution_thread_time_total + _tx_execution_isr_time_total + _tx_execution_idle_time_total;
    while (1)
    {
        /* Programs requiring periodic processing correspond to systick called by bare metal projects_ ISR */
        bsp_ProPer1ms();

        /* CPU Utilization statistics */
        uiCount++;
        if(uiCount == 200)
        {
            uiCount = 0;
            deltaIdleTime = _tx_execution_idle_time_total - IdleTime;
            deltaTolTime = _tx_execution_thread_time_total + _tx_execution_isr_time_total +
_tx_execution_idle_time_total - TolTime;
            OSCPUUsage = (double)deltaIdleTime/deltaTolTime;
            OSCPUUsage = 100- OSCPUUsage*100;
            IdleTime = _tx_execution_idle_time_total;
            TolTime = _tx_execution_thread_time_total + _tx_execution_isr_time_total +
 _tx_execution_idle_time_total;
        }

        tx_thread_sleep(1);
    }
}
The task information is printed through the DispTaskInfo function:
/*
*********************************************************************************************************
*    Function name: DispTaskInfo
*    Function Description: print the ThreadX task information through the serial port
*    Formal parameters: None
*    Return value: None
*********************************************************************************************************
*/
static void DispTaskInfo(void)
{
    TX_THREAD      *p_tcb;            /* Define a task control block pointer */

    p_tcb = &AppTaskStartTCB;

    /* Print title */
    App_Printf("===============================================================\r\n");
    App_Printf("CPU Utilization rate = %5.2f%%\r\n", OSCPUUsage);
    App_Printf("Task execution time = %.9fs\r\n", (double)_tx_execution_thread_time_total/SystemCoreClock);
    App_Printf("Idle execution time = %.9fs\r\n", (double)_tx_execution_idle_time_total/SystemCoreClock);
    App_Printf("Interrupt execution time = %.9fs\r\n", (double)_tx_execution_isr_time_total/SystemCoreClock);
    App_Printf("Total system execution time = %.9fs\r\n", (double)(_tx_execution_thread_time_total + \
                                                       _tx_execution_idle_time_total +  \
                                                       _tx_execution_isr_time_total)/SystemCoreClock);
    App_Printf("===============================================================\r\n");
    App_Printf(" Task priority task stack size current stack maximum stack task name\r\n");
    App_Printf("   Prio     StackSize   CurStack    MaxStack   Taskname\r\n");

    /* Traverse the task control list (TCB list) and print the priority and name of all tasks */
    while (p_tcb != (TX_THREAD *)0)
    {

        App_Printf("   %2d        %5d      %5d       %5d      %s\r\n",
                    p_tcb->tx_thread_priority,
                    p_tcb->tx_thread_stack_size,
                    (int)p_tcb->tx_thread_stack_end - (int)p_tcb->tx_thread_stack_ptr,
                    (int)p_tcb->tx_thread_stack_end - (int)p_tcb->tx_thread_stack_highest_ptr,
                    p_tcb->tx_thread_name);


        p_tcb = p_tcb->tx_thread_created_next;

        if(p_tcb == &AppTaskStartTCB) break;
    }
}
effect:
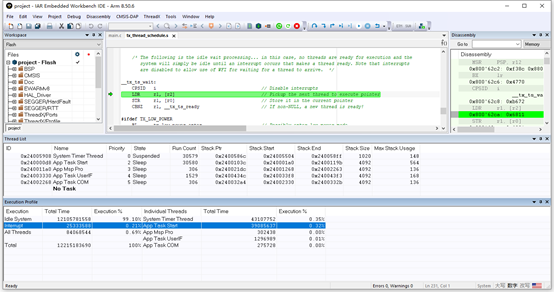
16.3 implementation of ThreadX plug-in of IAR
Like the MDK implementation, IAR is ported to V6 After version 1.7 or above, add statistical analysis files. The rest is the ThreadX plug-in that enables IAR:
- Step 1, enable the ThreadX plug-in:
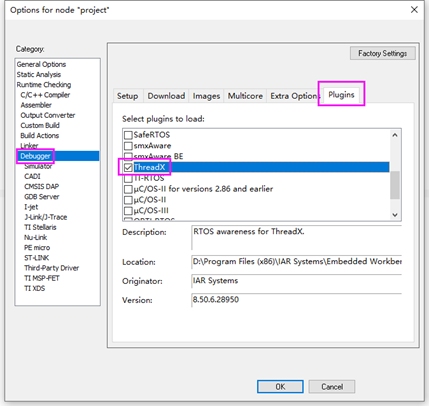
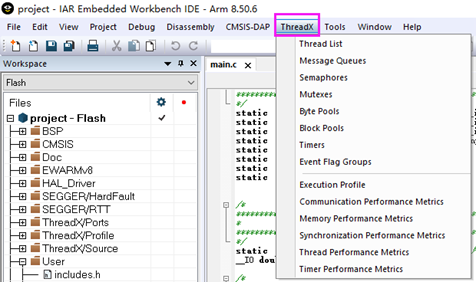
- Step 2: enter the debugging state and add ThreadX components. You can update the information you need to display:
- Step 3: first run at full speed, and then click pause to view the information. The effect is as follows:
16.4 experimental routine
Supporting examples:
V7-3011_ThreadX Task Statistics
Purpose of the experiment:
- ThreadX original task statistical analysis function
Experiment content:
1. The following tasks are created. You can print the usage of task stack through serial port or RTT by pressing the key K1
========================================================
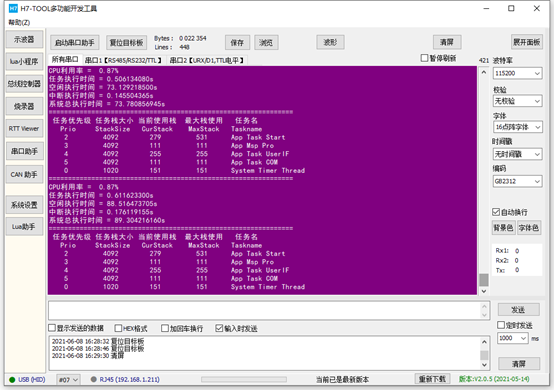
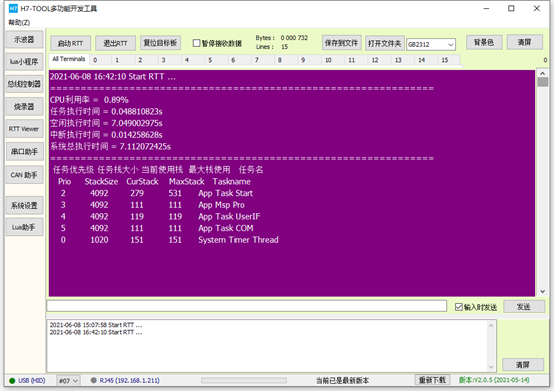
CPU utilization = 0.89%
Task execution time = 0.58645s
Idle execution time = 85.504470575s
Interrupt execution time = 0.173225395s
Total system execution time = 86.264180615s
=======================================================
Task priority task stack size current stack used maximum stack used task name
Prio StackSize CurStack MaxStack Taskname
2 4092 303 459 App Task Start
5 4092 167 167 App Msp Pro
4 4092 167 167 App Task UserIF
5 4092 167 167 App Task COM
0 1020 191 191 System Timer Thread
Serial port software can use SecureCRT or H7-TOOL RTT to view print information.
App Task Start task: start the task, which is used here as a BSP driver package.
App Task MspPro task: message processing, used here as LED flashing.
App Task UserIF task: key message processing.
App Task COM task: used here as LED flashing.
System Timer Thread task: system timer task
2. (1) all functions that use printf function pass through function App_Printf implementation.
(2) App_Printf function does semaphore mutually exclusive operation to solve the problem of resource sharing.
3. The default power on is to print information through the serial port. If RTT is used to print information
(1) MDK AC5, MDK AC6 or IAR enable BSP The macro in the H file can be defined as 1
#define Enable_RTTViewer 1
(2) Embedded Studio continues to use this macro definition as 0 because Embedded Studio only makes RTT view of debugging status.
Serial port printing information mode (AC5, AC6 and IAR):
Baud rate 115200, data bit 8, parity bit none, stop bit 1

RTT printing information mode (AC5, AC6 and IAR):
Embedded Studio only supports RTT printing in debugging status:
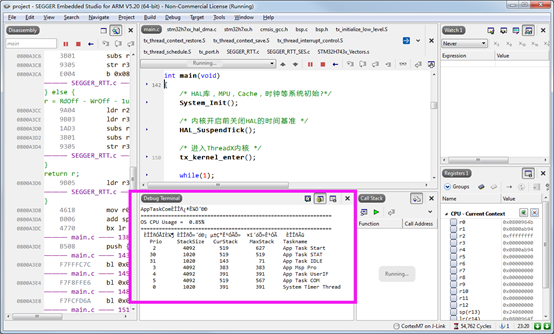
Because Embedded Studio does not support Chinese, the Chinese part displays garbled code, so don't worry.
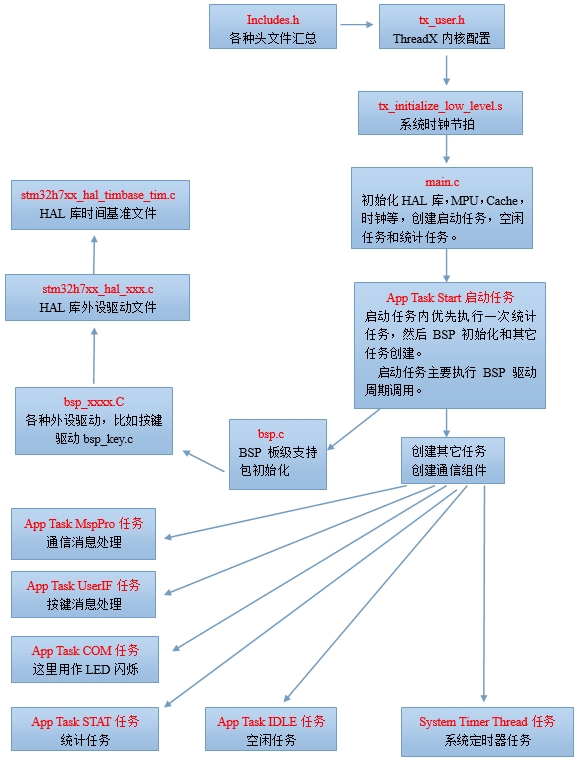
Program execution block diagram:
16.5 summary
This chapter mainly explains the implementation of the original task statistical analysis function of ThreadX, which is more practical.