With the increasing complexity of communication system, the traditional analysis and design methods such as manual analysis and circuit board test can not meet the needs of development. The computer simulation technology of communication system increasingly shows its great advantages. Computer simulation is a method of experimental research using computer according to the model of the real system It has a series of advantages of using the model for simulation, such as low cost, easy to carry out various tests that are difficult to realize in the real system, and easy to realize repeated tests under the same conditions. Matlab simulation software is one of the common tools to analyze communication system.
Matlab is an interactive, matrix based software development environment, which is used for scientific and engineering calculation and visualization. The programming function of MATLAB is simple, and it is easy to expand and create new commands and functions. Complex numerical calculation problems can be easily solved by using MATLAB. MATLAB has a powerful SIMULINK dynamic simulation environment, which can realize visual modeling and file interoperability and data exchange among multiple working environments. Simulink supports continuous, discrete and mixed linear and nonlinear systems, as well as multi rate systems with multiple sampling rates. Simulink provides users with a graphical interface for modeling with block diagram. It is more intuitive, convenient and flexible than the modeling with difference equations and differential equations in traditional simulation software packages. Users can simulate, analyze and modify their models in MATLAB and Simulink. The Communication toolbox (also known as Commlib, Communication toolbox) used to realize communication simulation is a scientific toolkit in MATLAB language. It provides the functions of calculation, research, simulation development, system design and analysis in the communication field. It can be used independently in the MATLAB environment or in conjunction with Simulink. In addition, the Graphical User Interface of Matlab can generate a man-machine interactive interface for the simulation system, which is convenient for the operation of the simulation system. Therefore, MATLAB has been widely used in communication system simulation. This tool is also used to simulate the digital modulation system.
In the digital baseband transmission system, in order to enable the digital baseband signal to be transmitted in the channel, the channel should have the transmission characteristics of low-pass form. However, in the actual channel, most channels have band-pass transmission characteristics, and the digital baseband signal can not be transmitted directly in the channel with such band-pass transmission characteristics. The carrier must be modulated with digital baseband signal to produce various modulated digital signals. The basic structure diagram of digital modulation system is shown in the figure below.

Basic structure diagram of digital modulation system
The principle of digital modulation is the same as that of analog modulation. Generally, analog modulation can be used to realize digital modulation. However, digital baseband signal has different characteristics from analog baseband signal, and its value is limited discrete state. In this way, some discrete states of the carrier can be used to represent the discrete state of the digital baseband signal. The three basic digital modulation modes are amplitude keying (ASK), frequency shift keying (FSK) and phase shift keying (PSK or DPSK).
Amplitude keying is a digital modulation in which the amplitude of sinusoidal carrier varies with the digital baseband signal. When the digital baseband signal is binary, it is binary amplitude keying (2ASK). Let the transmitted binary symbol sequence consist of "0" and "1" sequences, the probability of transmitting "0" symbol is P, and the probability of transmitting "1" symbol is 1-P, which are independent of each other.
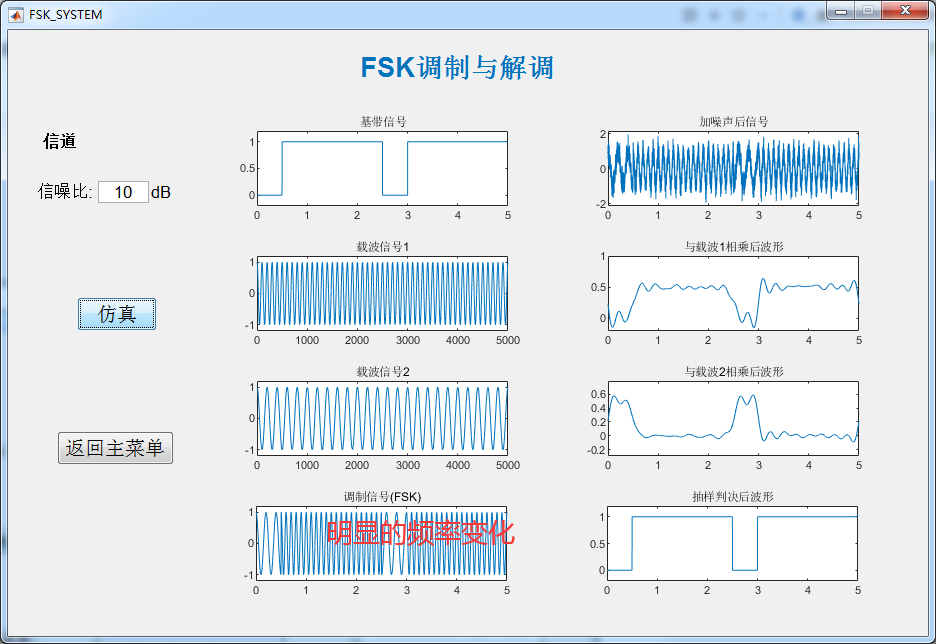
In binary digital modulation, if the frequency of sinusoidal carrier varies between and two frequency points with binary baseband signal, binary frequency shift keying signal (2FSK signal) is generated. The time waveform of the binary frequency shift keying signal is shown in the figure. Waveform g can be decomposed into waveform e and waveform f, that is, the binary frequency shift keying signal can be regarded as the superposition of binary amplitude keying signals of two different carriers.
Binary phase shift keying, abbreviated as 2PSK or BPSK. The "0" and "1" of 2PSK signal symbols are represented by two different initial phases "0" and "" respectively, while their amplitude and frequency remain unchanged.

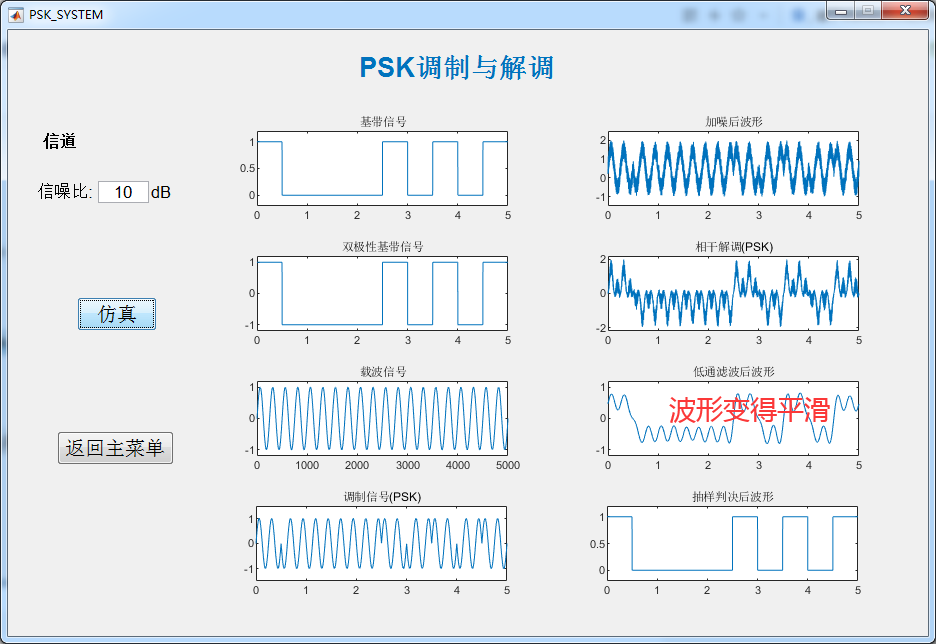
function varargout = PSK_SYSTEM(varargin)
% PSK_SYSTEM MATLAB code for PSK_SYSTEM.fig
%      PSK_SYSTEM, by itself, creates a new PSK_SYSTEM or raises the existing
%      singleton*.
%
%      H = PSK_SYSTEM returns the handle to a new PSK_SYSTEM or the handle to
%      the existing singleton*.
%
%      PSK_SYSTEM('CALLBACK',hObject,eventData,handles,...) calls the local
%      function named CALLBACK in PSK_SYSTEM.M with the given input arguments.
%
%      PSK_SYSTEM('Property','Value',...) creates a new PSK_SYSTEM or raises the
%      existing singleton*.  Starting from the left, property value pairs are
%      applied to the GUI before PSK_SYSTEM_OpeningFcn gets called.  An
%      unrecognized property name or invalid value makes property application
%      stop.  All inputs are passed to PSK_SYSTEM_OpeningFcn via varargin.
%
%      *See GUI Options on GUIDE's Tools menu.  Choose "GUI allows only one
%      instance to run (singleton)".
%
% See also: GUIDE, GUIDATA, GUIHANDLES


% Begin initialization code - DO NOT EDIT
gui_Singleton = 1;
gui_State = struct('gui_Name',       mfilename, ...
                   'gui_Singleton',  gui_Singleton, ...
                   'gui_OpeningFcn', @PSK_SYSTEM_OpeningFcn, ...
                   'gui_OutputFcn',  @PSK_SYSTEM_OutputFcn, ...
                   'gui_LayoutFcn',  [] , ...
                   'gui_Callback',   []);
if nargin && ischar(varargin{1})
    gui_State.gui_Callback = str2func(varargin{1});
end

if nargout
    [varargout{1:nargout}] = gui_mainfcn(gui_State, varargin{:});
else
    gui_mainfcn(gui_State, varargin{:});
end
% End initialization code - DO NOT EDIT


% --- Executes just before PSK_SYSTEM is made visible.
function PSK_SYSTEM_OpeningFcn(hObject, eventdata, handles, varargin)
% This function has no output args, see OutputFcn.
% hObject    handle to figure
% eventdata  reserved - to be defined in a future version of MATLAB
% handles    structure with handles and user data (see GUIDATA)
% varargin   command line arguments to PSK_SYSTEM (see VARARGIN)

% Choose default command line output for PSK_SYSTEM
handles.output = hObject;

% Update handles structure
guidata(hObject, handles);

% UIWAIT makes PSK_SYSTEM wait for user response (see UIRESUME)
% uiwait(handles.figure1);


% --- Outputs from this function are returned to the command line.
function varargout = PSK_SYSTEM_OutputFcn(hObject, eventdata, handles)
% varargout  cell array for returning output args (see VARARGOUT);
% hObject    handle to figure
% eventdata  reserved - to be defined in a future version of MATLAB
% handles    structure with handles and user data (see GUIDATA)

% Get default command line output from handles structure
varargout{1} = handles.output;


% --- Executes on button press in radiobutton1.
function radiobutton1_Callback(hObject, eventdata, handles)
% hObject    handle to radiobutton1 (see GCBO)
% eventdata  reserved - to be defined in a future version of MATLAB
% handles    structure with handles and user data (see GUIDATA)

% Hint: get(hObject,'Value') returns toggle state of radiobutton1
set(handles.radiobutton1,'value',1);
set(handles.radiobutton2,'value',0);

% --- Executes on button press in radiobutton2.
function radiobutton2_Callback(hObject, eventdata, handles)
% hObject    handle to radiobutton2 (see GCBO)
% eventdata  reserved - to be defined in a future version of MATLAB
% handles    structure with handles and user data (see GUIDATA)

% Hint: get(hObject,'Value') returns toggle state of radiobutton2
set(handles.radiobutton1,'value',0);
set(handles.radiobutton2,'value',1);

% --- Executes on button press in pushbutton1.
function pushbutton1_Callback(hObject, eventdata, handles)
% hObject    handle to pushbutton1 (see GCBO)
% eventdata  reserved - to be defined in a future version of MATLAB
% handles    structure with handles and user data (see GUIDATA)
i=10;
j=5000;
fc=4;%carrier frequency
fm=i/5;%chip rate
B=2*fm;
t=linspace(0,5,j);
%% Generate baseband signal
a=round(rand(1,i));%Random sequence,baseband signal
% figure(3);
% stem(a);
st1=t;
for n=1:10
if a(n)<1;
 for m=j/i*(n-1)+1:j/i*n
     st1(m)=0;
end
end
end
axes(handles.axes1)
plot(t,st1);
title('baseband signal ');
axis([0,5,-0.2,1.2]);
%Baseband signal inversion
%because PSK The signal in is a bipolar signal, so the unipolar signal obtained above is inverted to form a bipolar code together with it
st2=t;
for k=1:j
if st1(k)>=1
st2(k)=0;
else
st2(k)=1;
end
end;
axes(handles.axes2)
st3=st1-st2;
plot(t,st3);
title('Bipolar baseband signal');
axis([0,5,-1.2,1.2]);
%carrier signal
s1=sin(2*pi*fc*t);
axes(handles.axes3)
plot(s1);
ylim([-1.2 1.2])
title('carrier signal');

%% modulation
e_psk=st3.*s1;
axes(handles.axes4)
plot(t,e_psk);
ylim([-1.5 1.5])
title('Modulation signal(PSK)');
noise=rand(1,j);
psk=e_psk+noise;%Add noise
axes(handles.axes5)
plot(t,psk);
ylim([-1.5 2.5])
title('Waveform after noise');


%% Coherent demodulation
axes(handles.axes6)
psk=psk.*s1;%Multiply with carrier
plot(t,psk);
ylim([-2.2 2.2])
title('Coherent demodulation(PSK)');
[f,af] = T2F(t,psk);%%%%%%%%%%%Through low-pass filter
[t,psk] = lpf(f,af,B);
axes(handles.axes7)
plot(t,psk);
ylim([-1.2 1.2])
title('Low pass filtered waveform');
%Sample decision
for m=0:i-1;
if psk(1,m*500+250)<0;
for j=m*500+1:(m+1)*500;
     psk(1,j)=0;
end
else
for j=m*500+1:(m+1)*500;
    psk(1,j)=1;
end
end
end
axes(handles.axes8)
plot(t,psk);
axis([0,5,-0.2,1.2]);
title('Waveform after sampling decision')
---------------------—
Welcome to exchange and study. Contact information: Q 2461567431