preface
We will show you a go zero micro service example in detail through a series of articles. The whole series is divided into ten articles, and the directory structure is as follows:
- Environment construction
- Service splitting
- User services
- Product service
- Order service
- Payment services
- RPC service Auth authentication
- Service monitoring (this article)
- Link tracking
- Distributed transaction
Through this series, we hope to take you to quickly develop a mall system by using the Docker environment and go zero on the machine, so that you can quickly start micro services.
Complete sample code: https://github.com/nivin-studio/go-zero-mall
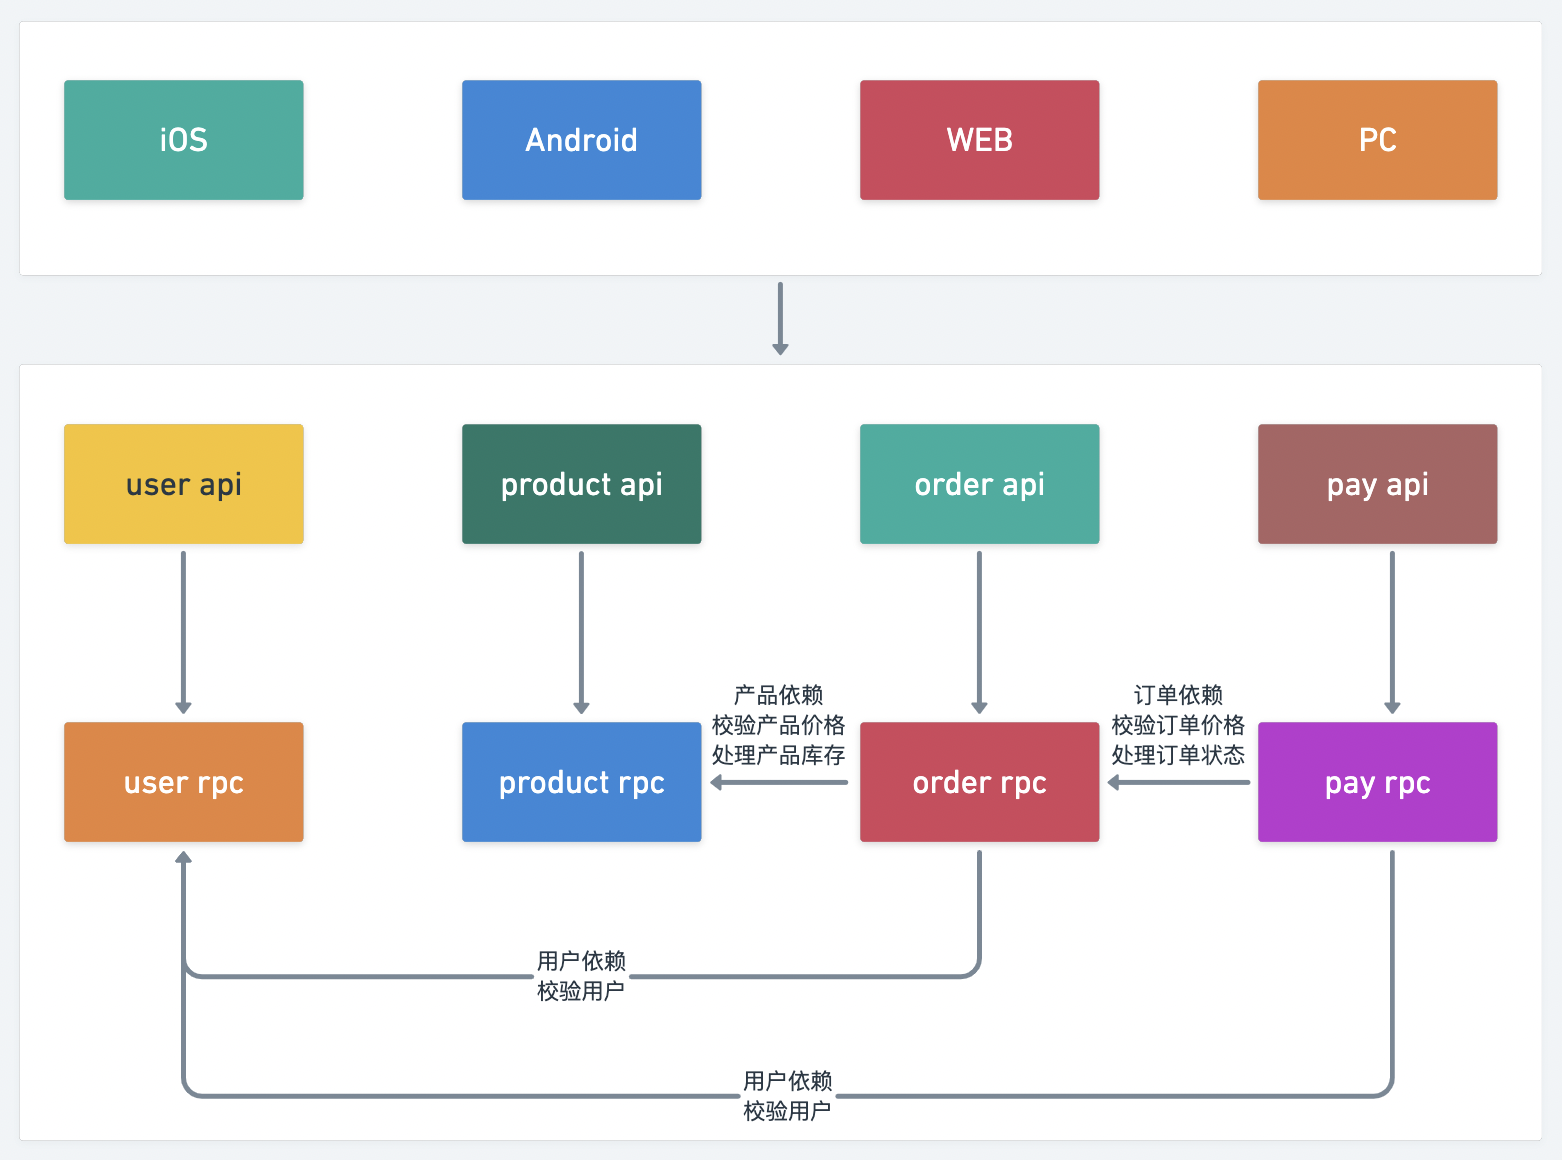
First, let's take a look at the overall service splitting diagram:
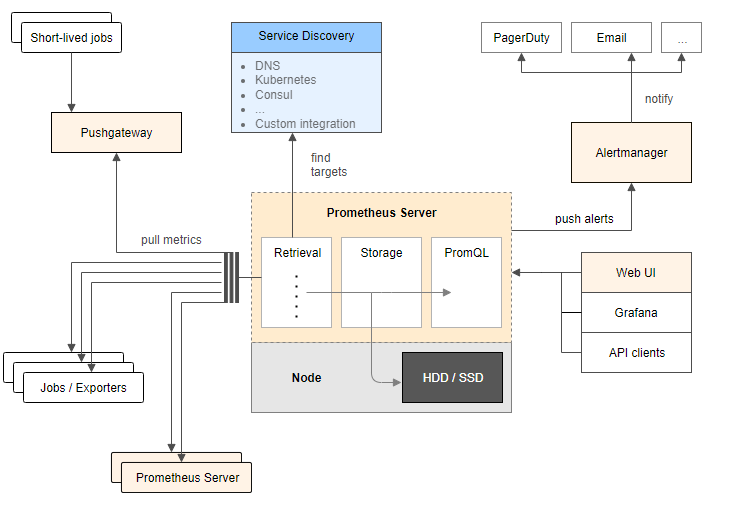
8.1 Prometheus introduction
Prometheus is an open-source monitoring and alarm system based on time series database. Its basic principle is to periodically capture the status of the monitored service through HTTP protocol. Any service can access the monitoring as long as it provides the corresponding HTTP interface. No SDK or other integration process is required. The HTTP interface that outputs the monitored service information is called exporter. At present, most of the services commonly used by Internet companies can be directly used by exporters, such as Varnish, Haproxy, Nginx, MySQL and Linux system information (including disk, memory, CPU, network, etc.). Promethus has the following characteristics:
- Support multidimensional data model (time series data composed of measure name and key value pair)
- It supports PromQL query language and can complete very complex query and analysis, which is very meaningful for chart display and alarm
- Without relying on distributed storage, a single point server can also be used
- Support HTTP protocol active pull method to collect time series data
- Support PushGateway to push time series data
- Support service discovery and static configuration to obtain monitoring targets
- Support access to Grafana
8.2 go zero uses Prometheus monitoring service
The go zero framework integrates Prometheus based service indicator monitoring. At present, go zero adds the monitoring of request indicators to the middleware of http and the interceptor of rpc.
Mainly from the two dimensions of request time-consuming and request error, the request time-consuming adopts the Histogram indicator type, defines multiple Buckets for quantile statistics, the request error adopts the Counter type, adds the path tag in http metric, and adds the method tag in rpc metric for subdivision monitoring.
Next, we add Prometheus monitoring to the services implemented in the previous chapters. First, we review the service splitting in Chapter 2. In order to simulate the distributed deployment of services, we start all services in one container and assign different port numbers to them. Next, we will assign a port number for Prometheus to collect index data for these services.
| service | api service port number | rpc service port number | api index collection port number | rpc index collection port number |
|---|---|---|---|---|
| user | 8000 | 9000 | 9080 | 9090 |
| product | 8001 | 9001 | 9081 | 9091 |
| order | 8002 | 9002 | 9082 | 9092 |
| pay | 8003 | 9003 | 9083 | 9093 |
8.2.1 add user api service Prometheus configuration
$ vim mall/service/user/api/etc/user.yaml
Name: User
Host: 0.0.0.0
Port: 8000

...

Prometheus:
  Host: 0.0.0.0
  Port: 9080
  Path: /metrics
8.2.2 add user rpc service Prometheus configuration
$ vim mall/service/user/rpc/etc/user.yaml
Name: user.rpc
ListenOn: 0.0.0.0:9000

...

Prometheus:
  Host: 0.0.0.0
  Port: 9090
  Path: /metrics
8.2.3 add product api service Prometheus configuration
$ vim mall/service/product/api/etc/product.yaml
Name: Product
Host: 0.0.0.0
Port: 8001

...

Prometheus:
  Host: 0.0.0.0
  Port: 9081
  Path: /metrics
8.2.4 add product rpc service Prometheus configuration
$ vim mall/service/product/rpc/etc/product.yaml
Name: product.rpc
ListenOn: 0.0.0.0:9001

...

Prometheus:
  Host: 0.0.0.0
  Port: 9091
  Path: /metrics
8.2.5 add order api service Prometheus configuration
$ vim mall/service/order/api/etc/order.yaml
Name: Order
Host: 0.0.0.0
Port: 8002

...

Prometheus:
  Host: 0.0.0.0
  Port: 9082
  Path: /metrics
8.2.6 add order rpc service Prometheus configuration
$ vim mall/service/order/rpc/etc/order.yaml
Name: order.rpc
ListenOn: 0.0.0.0:9002

...

Prometheus:
  Host: 0.0.0.0
  Port: 9092
  Path: /metrics
8.2.7 add pay api service Prometheus configuration
$ vim mall/service/pay/api/etc/pay.yaml
Name: Pay
Host: 0.0.0.0
Port: 8003

...

Prometheus:
  Host: 0.0.0.0
  Port: 9083
  Path: /metrics
8.2.8 add pay rpc service Prometheus configuration
$ vim mall/service/pay/rpc/etc/pay.yaml
Name: pay.rpc
ListenOn: 0.0.0.0:9003

...

Prometheus:
  Host: 0.0.0.0
  Port: 9093
  Path: /metrics
Tip: after the configuration is modified, the service needs to be restarted to take effect.
8.2.9 modifying Prometheus configuration
In the first chapter, we integrated the prometheus service. There is a prometheus in the prometheus directory The configuration file of YML. We need to modify this configuration file now.
# my global config
global:
  scrape_interval: 15s # Set the scrape interval to every 15 seconds. Default is every 1 minute.
  evaluation_interval: 15s # Evaluate rules every 15 seconds. The default is every 1 minute.
  # scrape_timeout is set to the global default (10s).

# Alertmanager configuration
alerting:
  alertmanagers:
    - static_configs:
        - targets:
          # - alertmanager:9093

# Load rules once and periodically evaluate them according to the global 'evaluation_interval'.
rule_files:
  # - "first_rules.yml"
  # - "second_rules.yml"

# A scrape configuration containing exactly one endpoint to scrape:
# Here it's Prometheus itself.
scrape_configs:
  # The job name is added as a label `job=<job_name>` to any timeseries scraped from this config.
  - job_name: "prometheus"

    # metrics_path defaults to '/metrics'
    # scheme defaults to 'http'.

    static_configs:
      - targets: ["localhost:9090"]

  # Our own mall project configuration
  - job_name: 'mall'
    static_configs:
      # Collection address of the target
      - targets: ['golang:9080']
        labels:
          # Custom label
          app: 'user-api'
          env: 'test'

      - targets: ['golang:9090']
        labels:
          app: 'user-rpc'
          env: 'test'

      - targets: ['golang:9081']
        labels:
          app: 'product-api'
          env: 'test'

      - targets: ['golang:9091']
        labels:
          app: 'product-rpc'
          env: 'test'

      - targets: ['golang:9082']
        labels:
          app: 'order-api'
          env: 'test'

      - targets: ['golang:9092']
        labels:
          app: 'order-rpc'
          env: 'test'

      - targets: ['golang:9083']
        labels:
          app: 'pay-api'
          env: 'test'

      - targets: ['golang:9093']
        labels:
          app: 'pay-rpc'
          env: 'test'
Tip: after the configuration file is modified, you need to restart the Prometheus service container to take effect.
8.2.10 access Prometheus visual interface
- In the first chapter, we integrated the "Prometheus" service and mapped the host port 3000 for its port number 9090, so enter it in the browser http://127.0.0.1:3000/ Access the Prometheus interface.
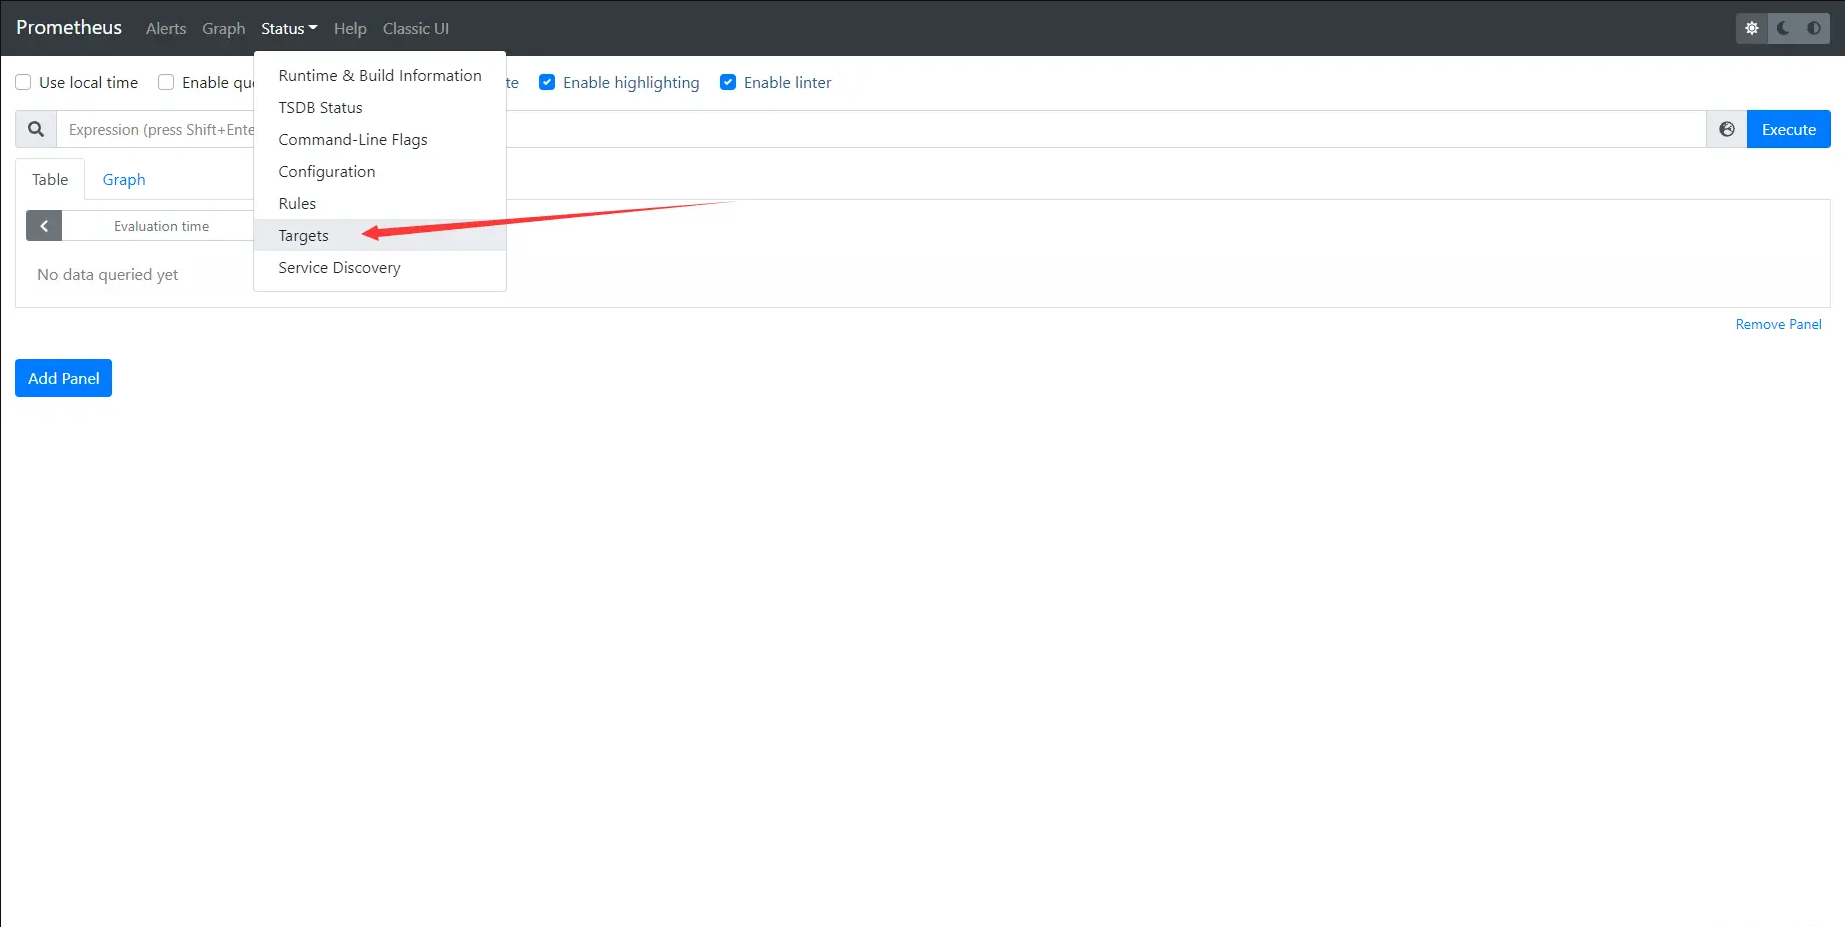
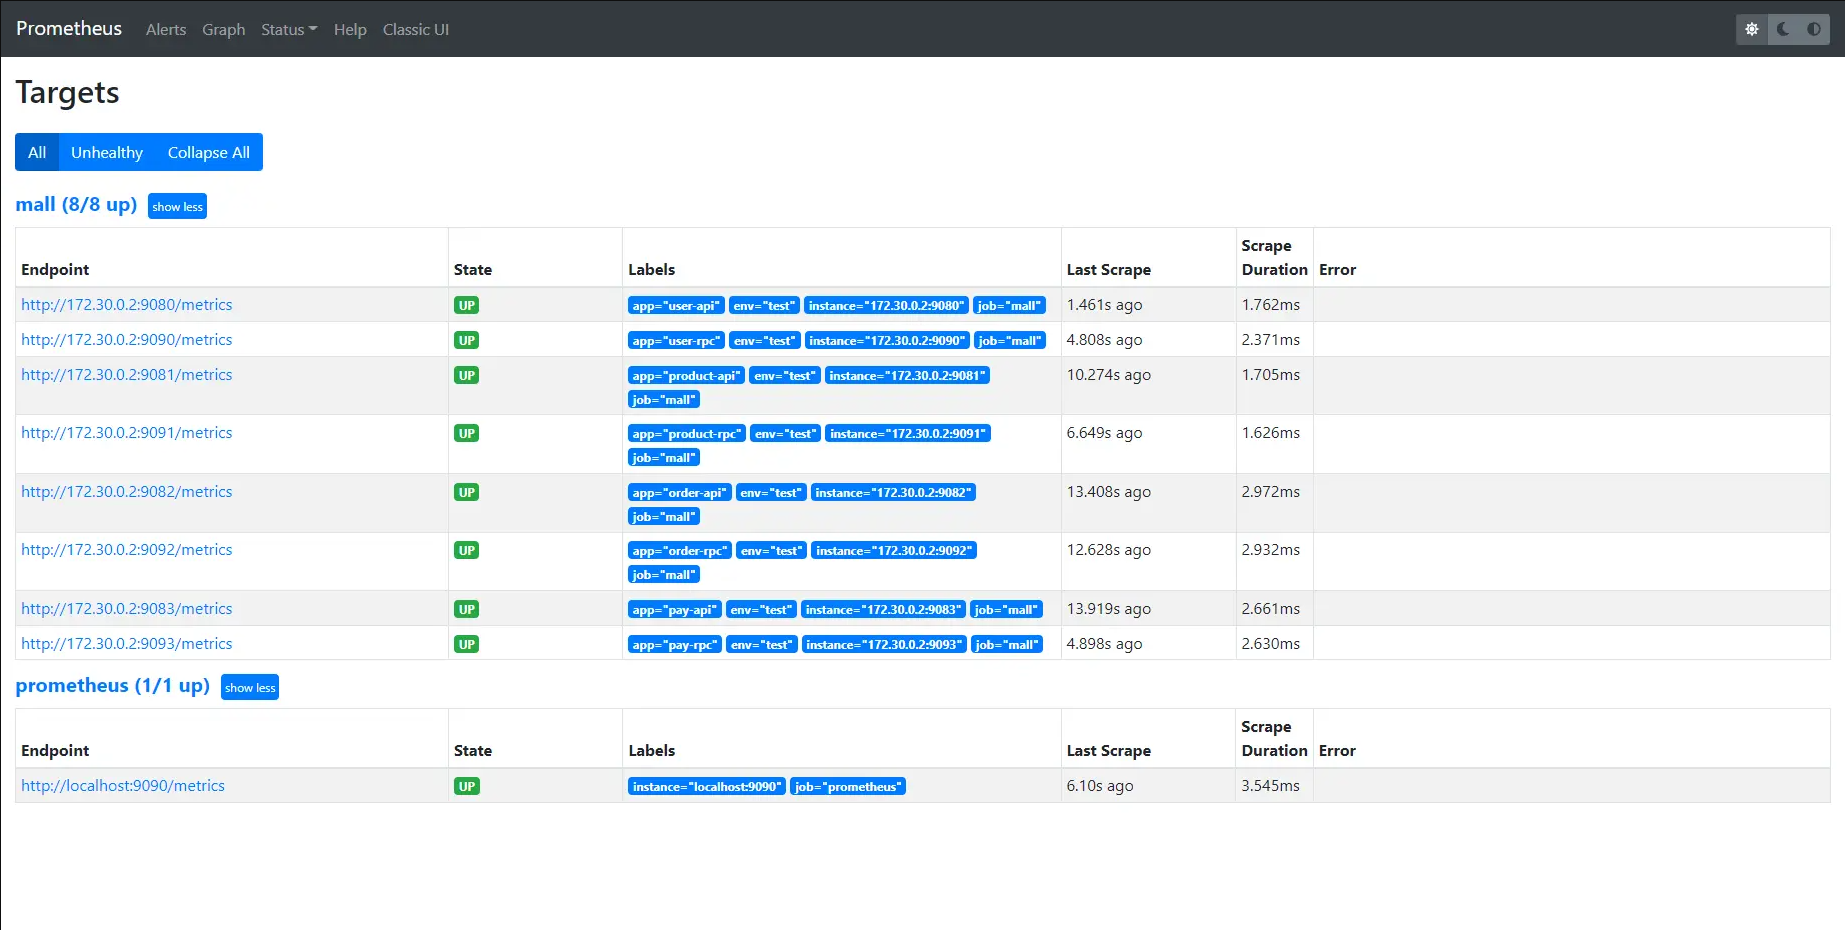
- Select the status - > targets menu to see the status of our configured collection targets and customized labels.
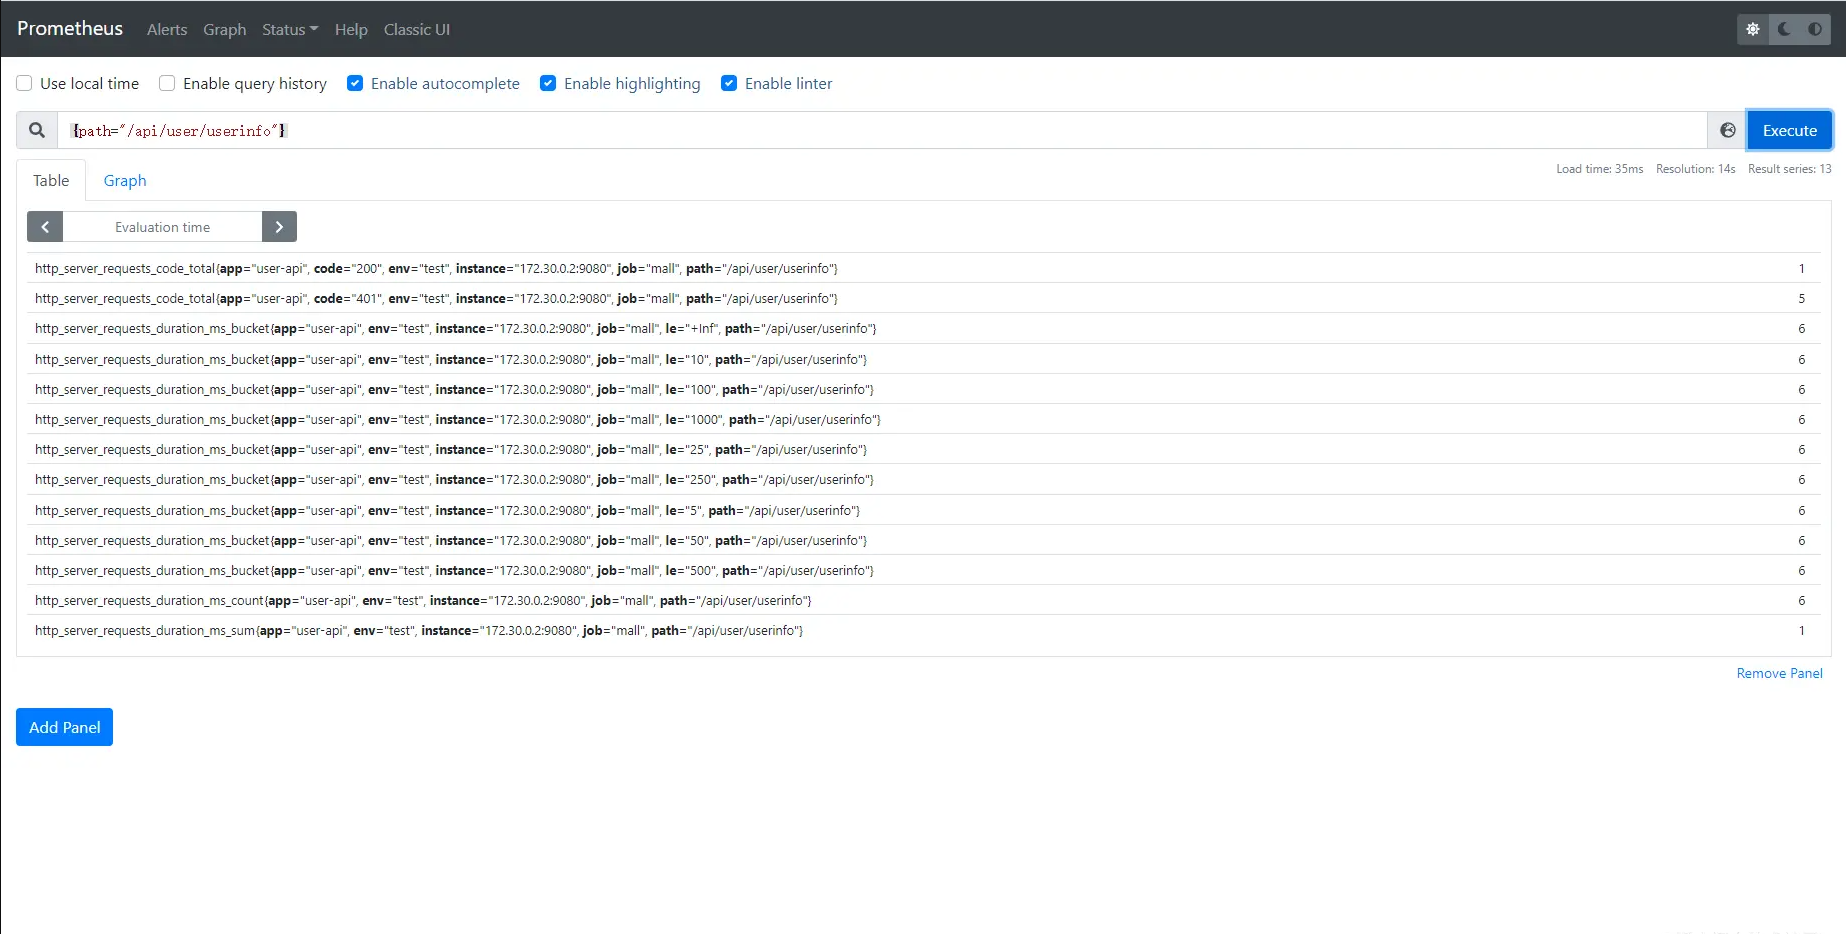
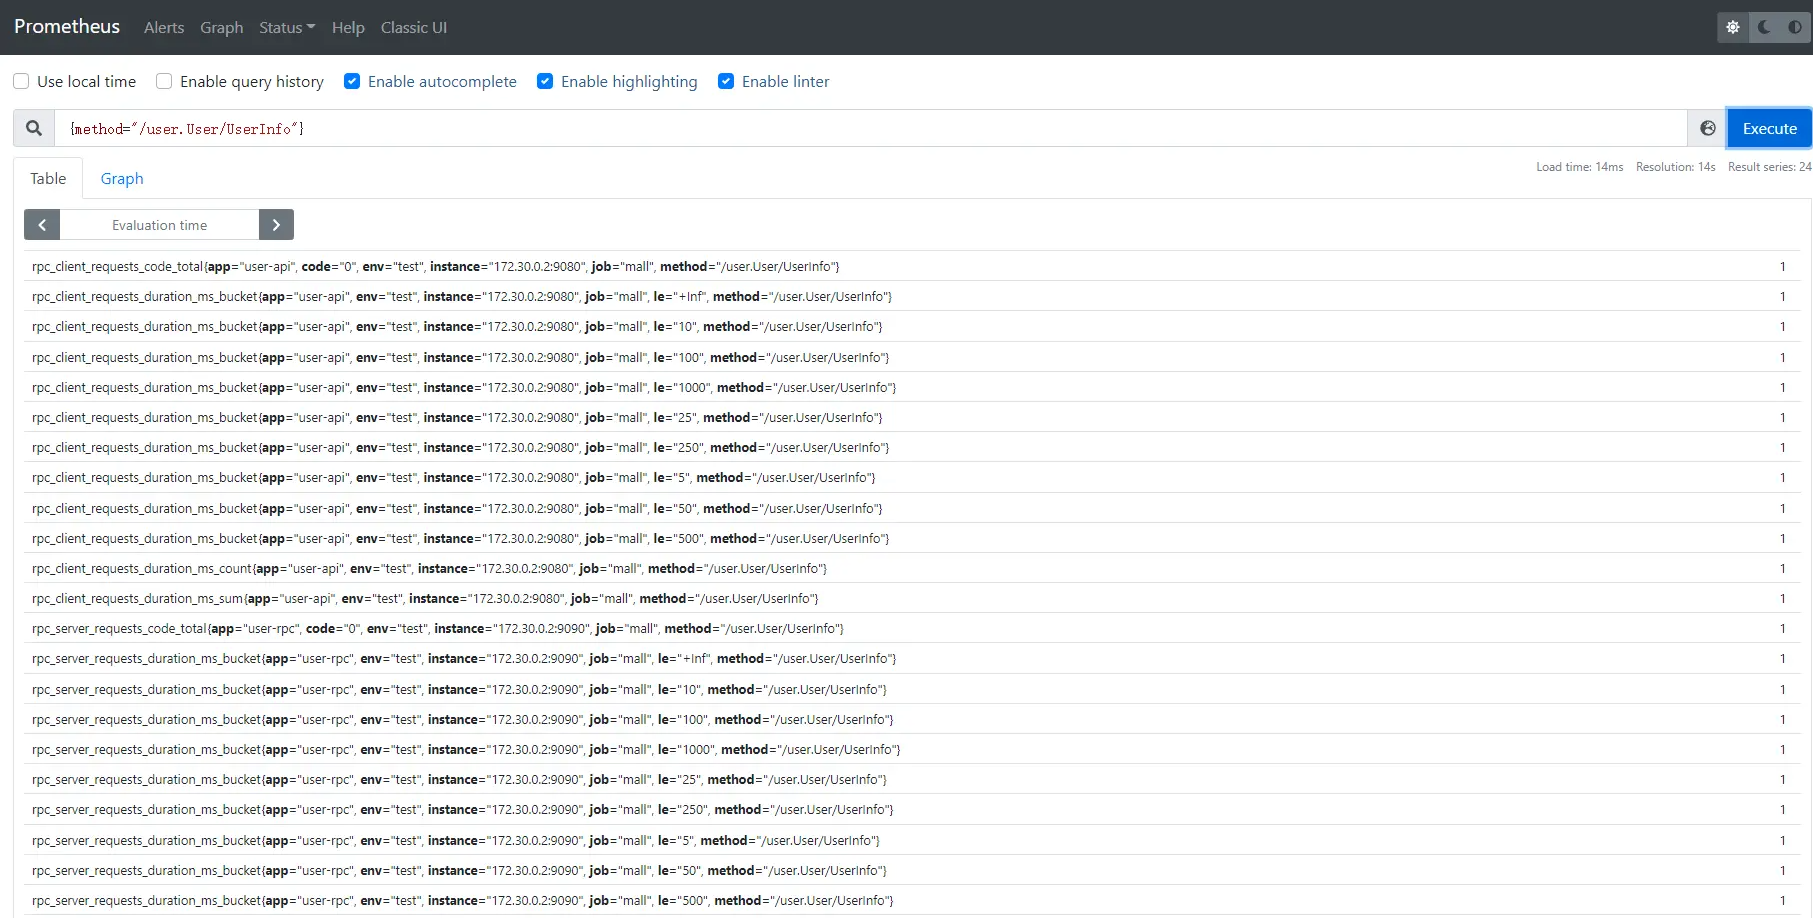
- After accessing the api service interface for many times, select the Graph menu and enter the {path="api interface address"} or {method="rpc interface method"} instruction in the query input box to view the monitoring indicators.
8.3 visualization of Prometheus indicator data using Grafana
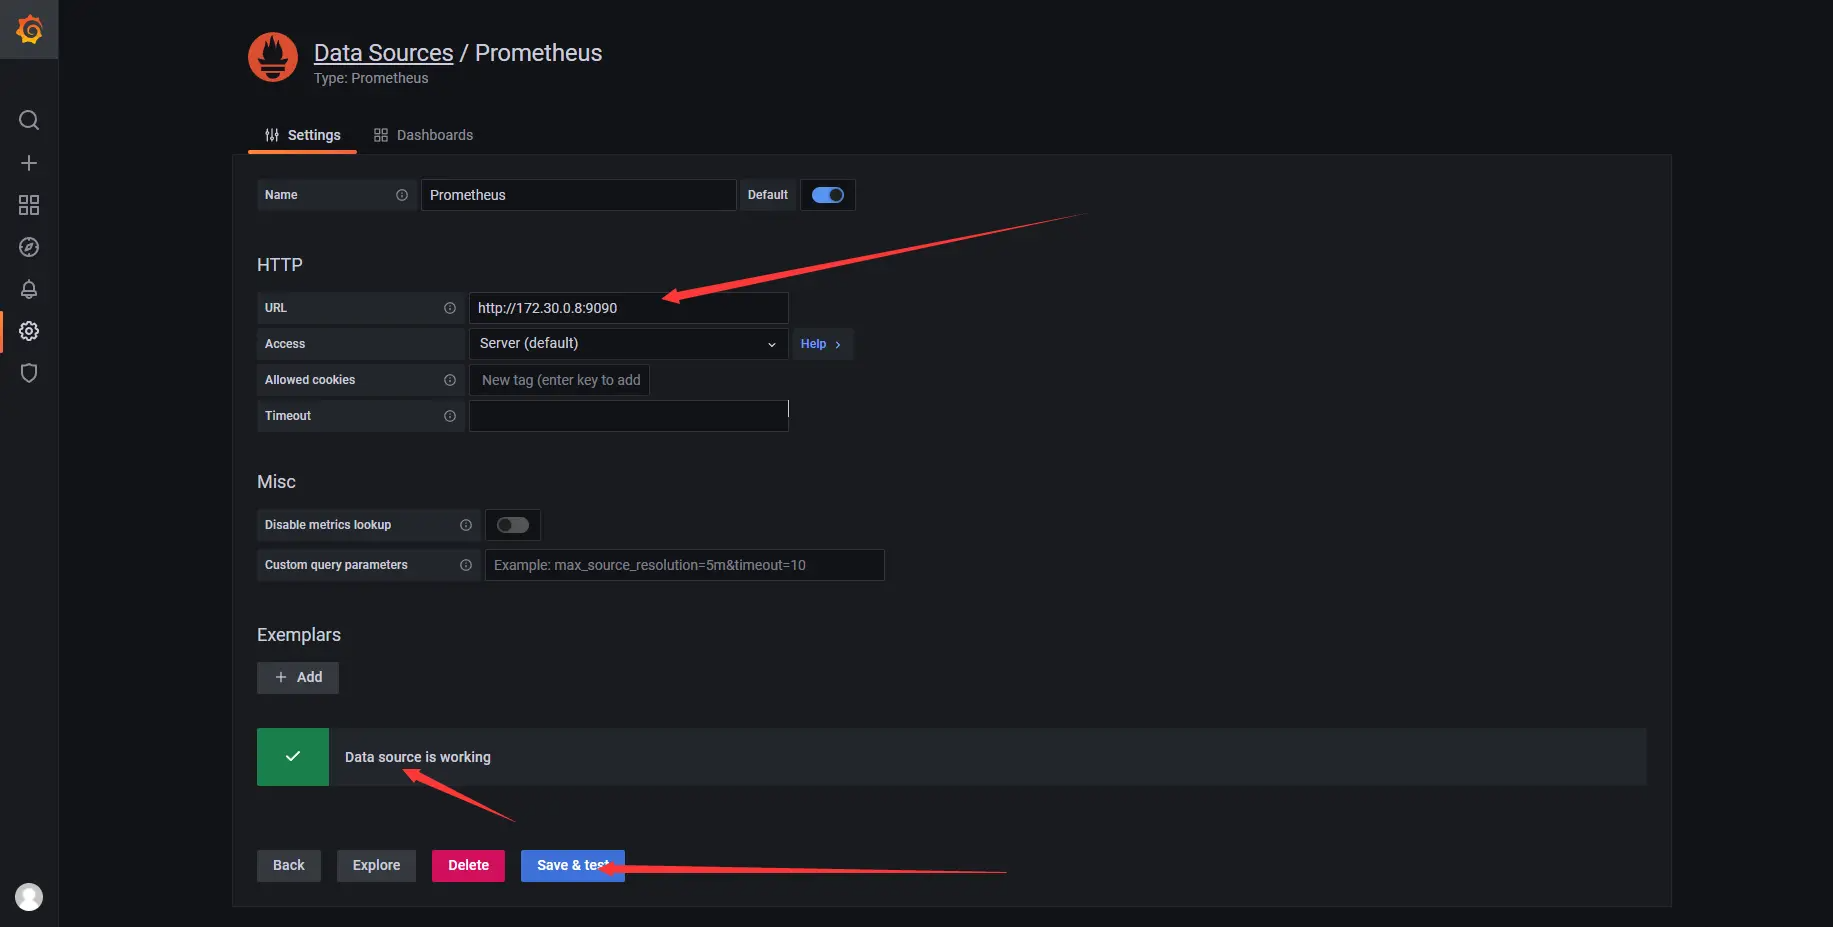
8.3.1 add Prometheus data source
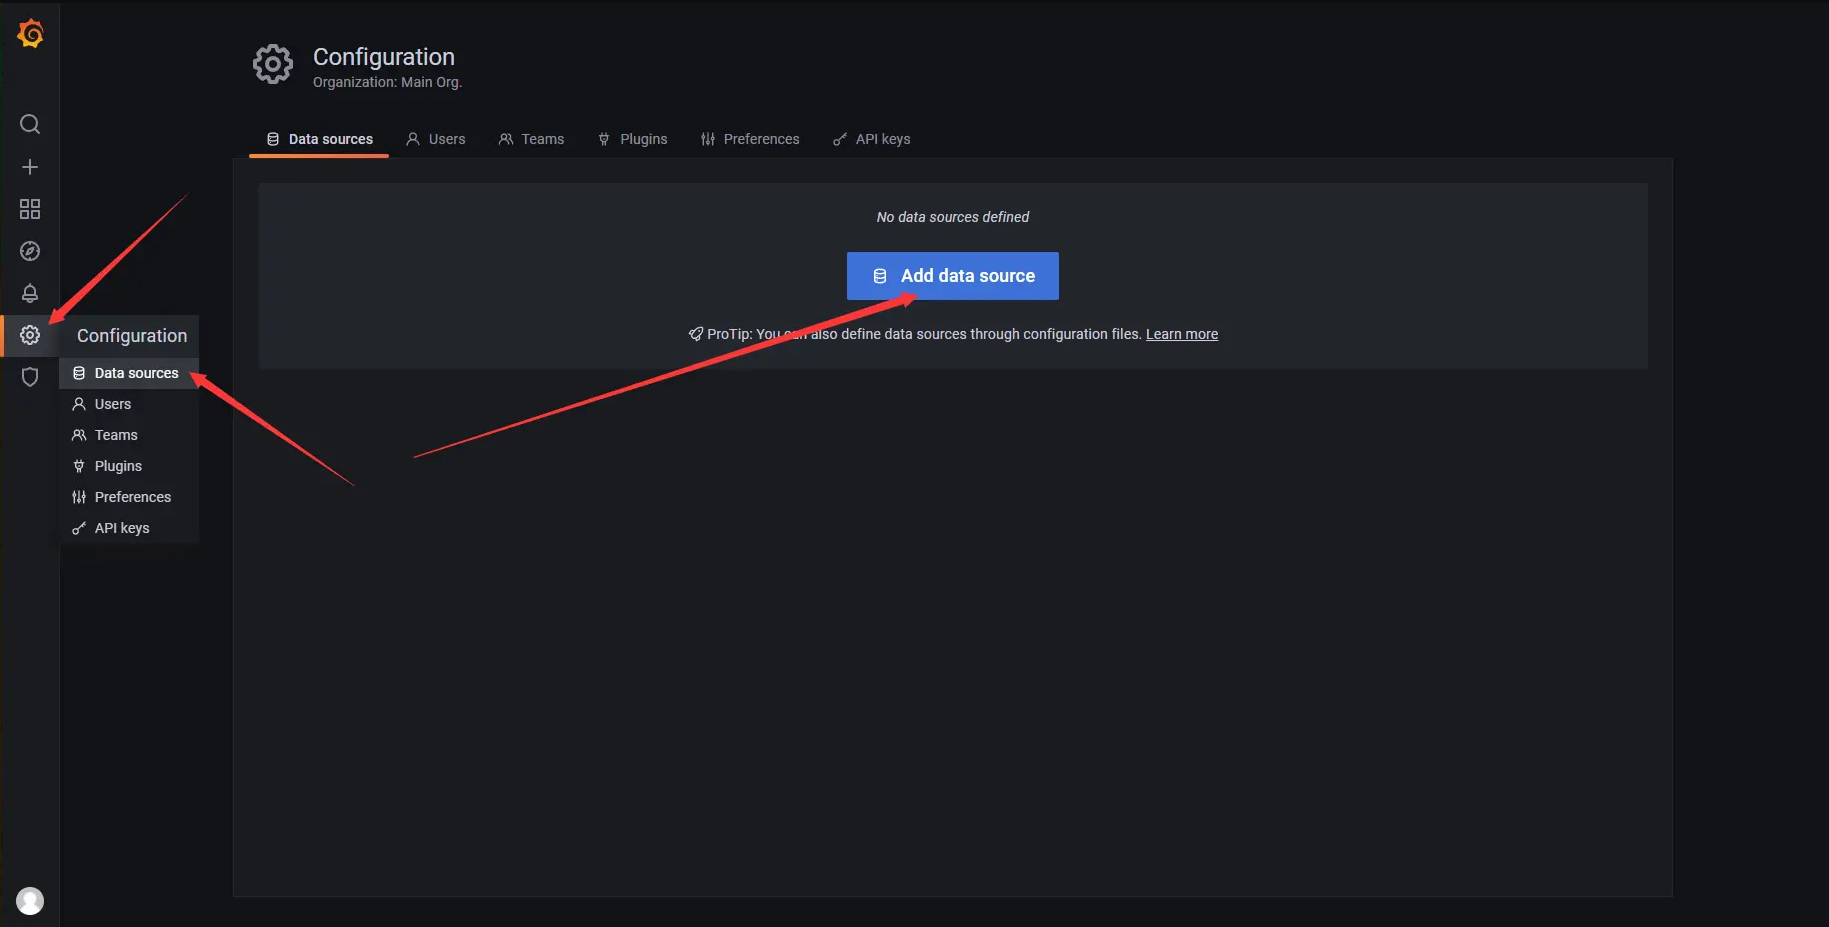
- In the first chapter, we integrated the "Grafana" service and mapped the host port 4000 for its port number 3000, so enter it in the browser http://127.0.0.1:4000/ Access the Grafana interface. Click configuration - > data source - > add data source in the left sidebar to add a data source.
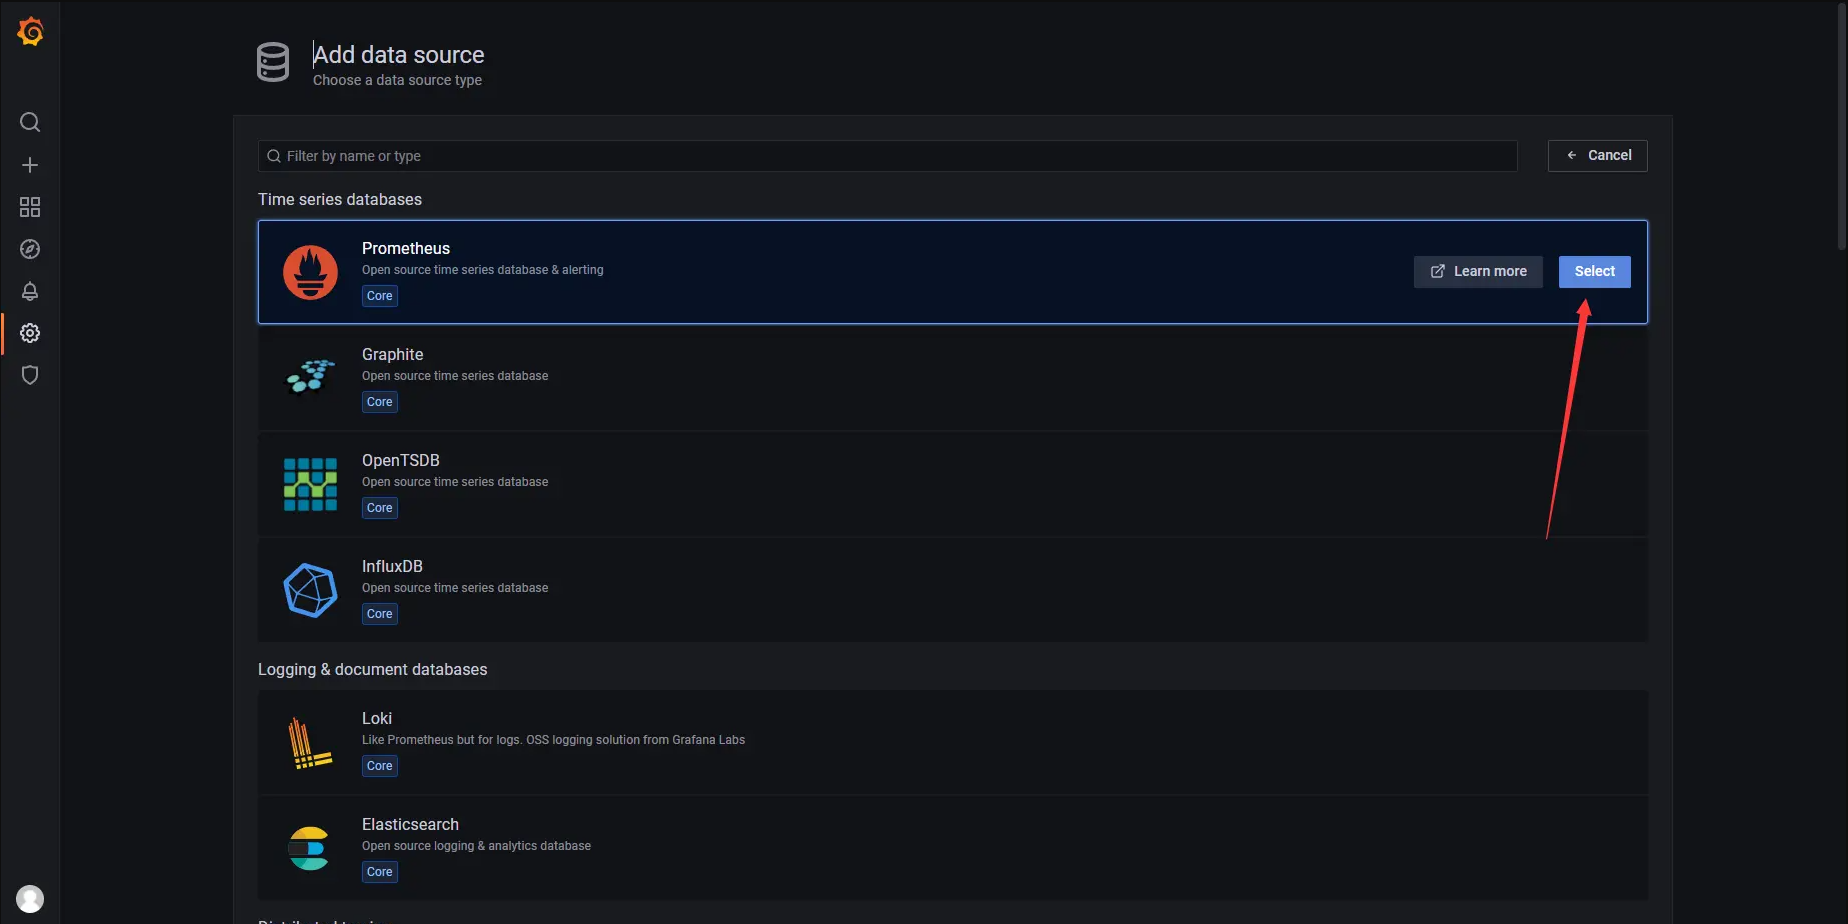
- Then select the Prometheus data source
- Fill in the URL address in the HTTP configuration (the IP address here is the IP address of the container where Prometheus is located), and then click Save & test. The top will prompt Data source is working, indicating that our data source is added successfully and works normally.
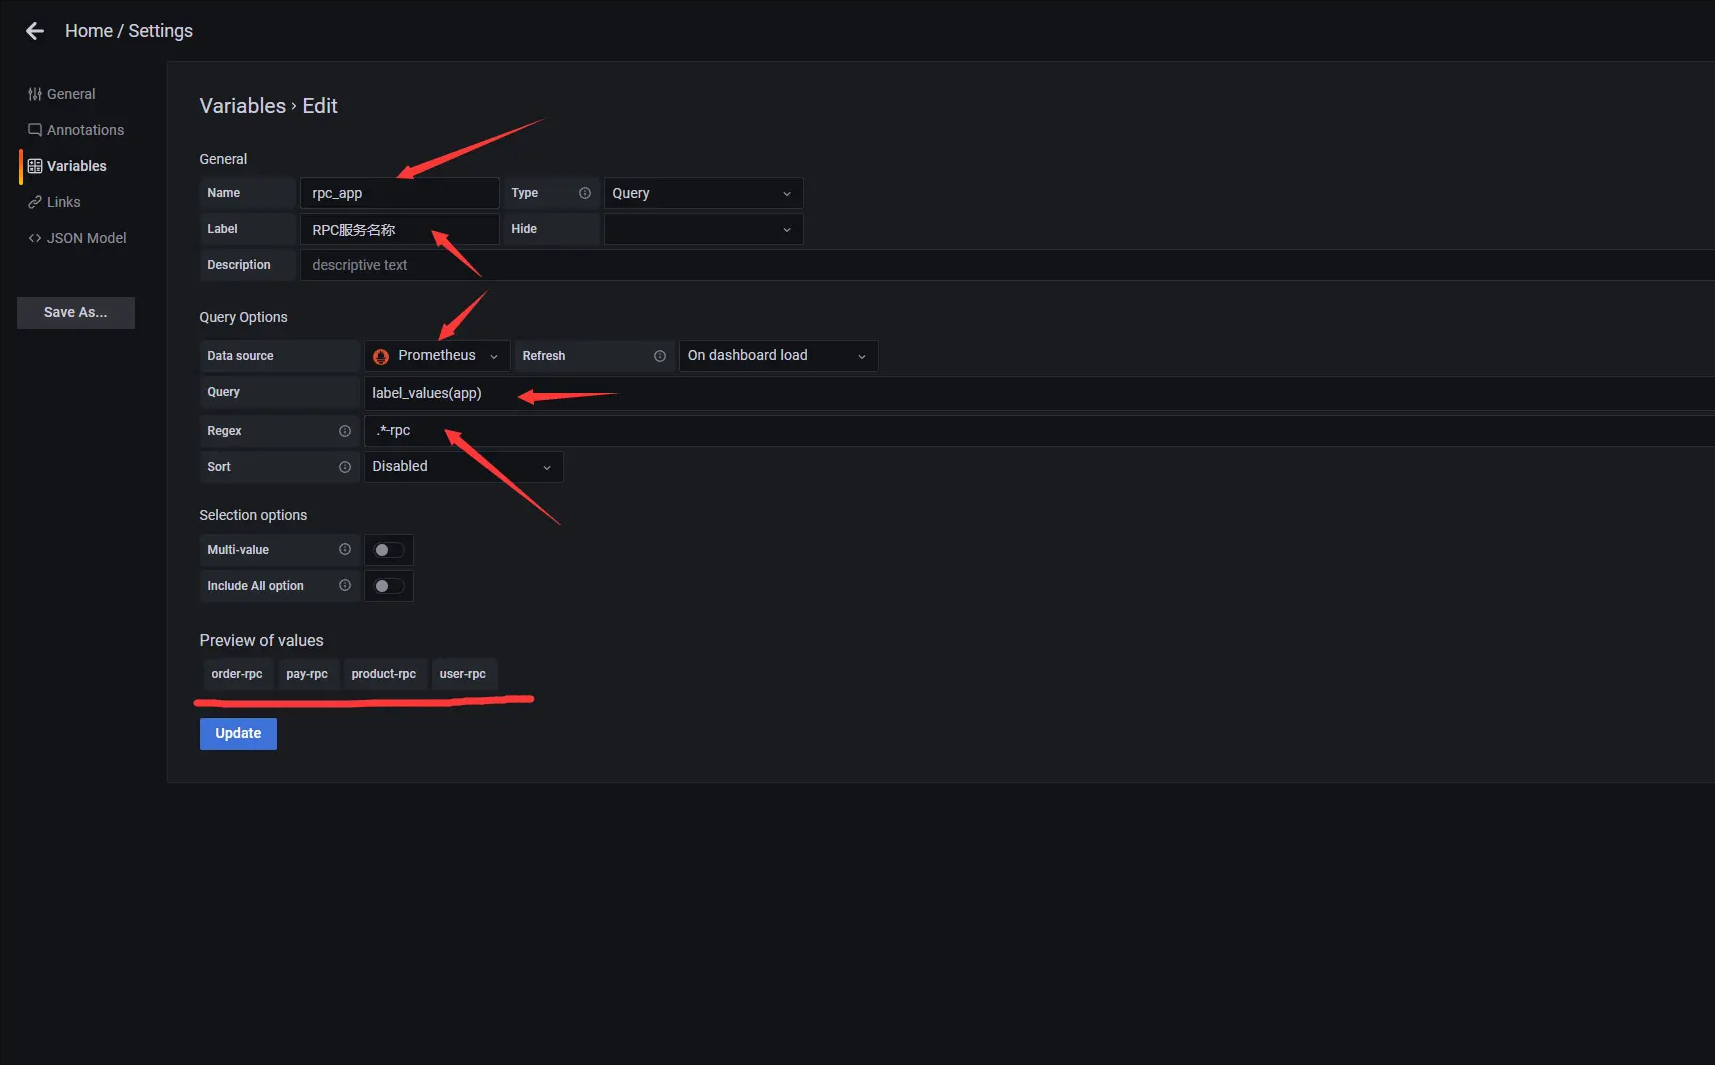
8.3.2 add Variables for service filtering
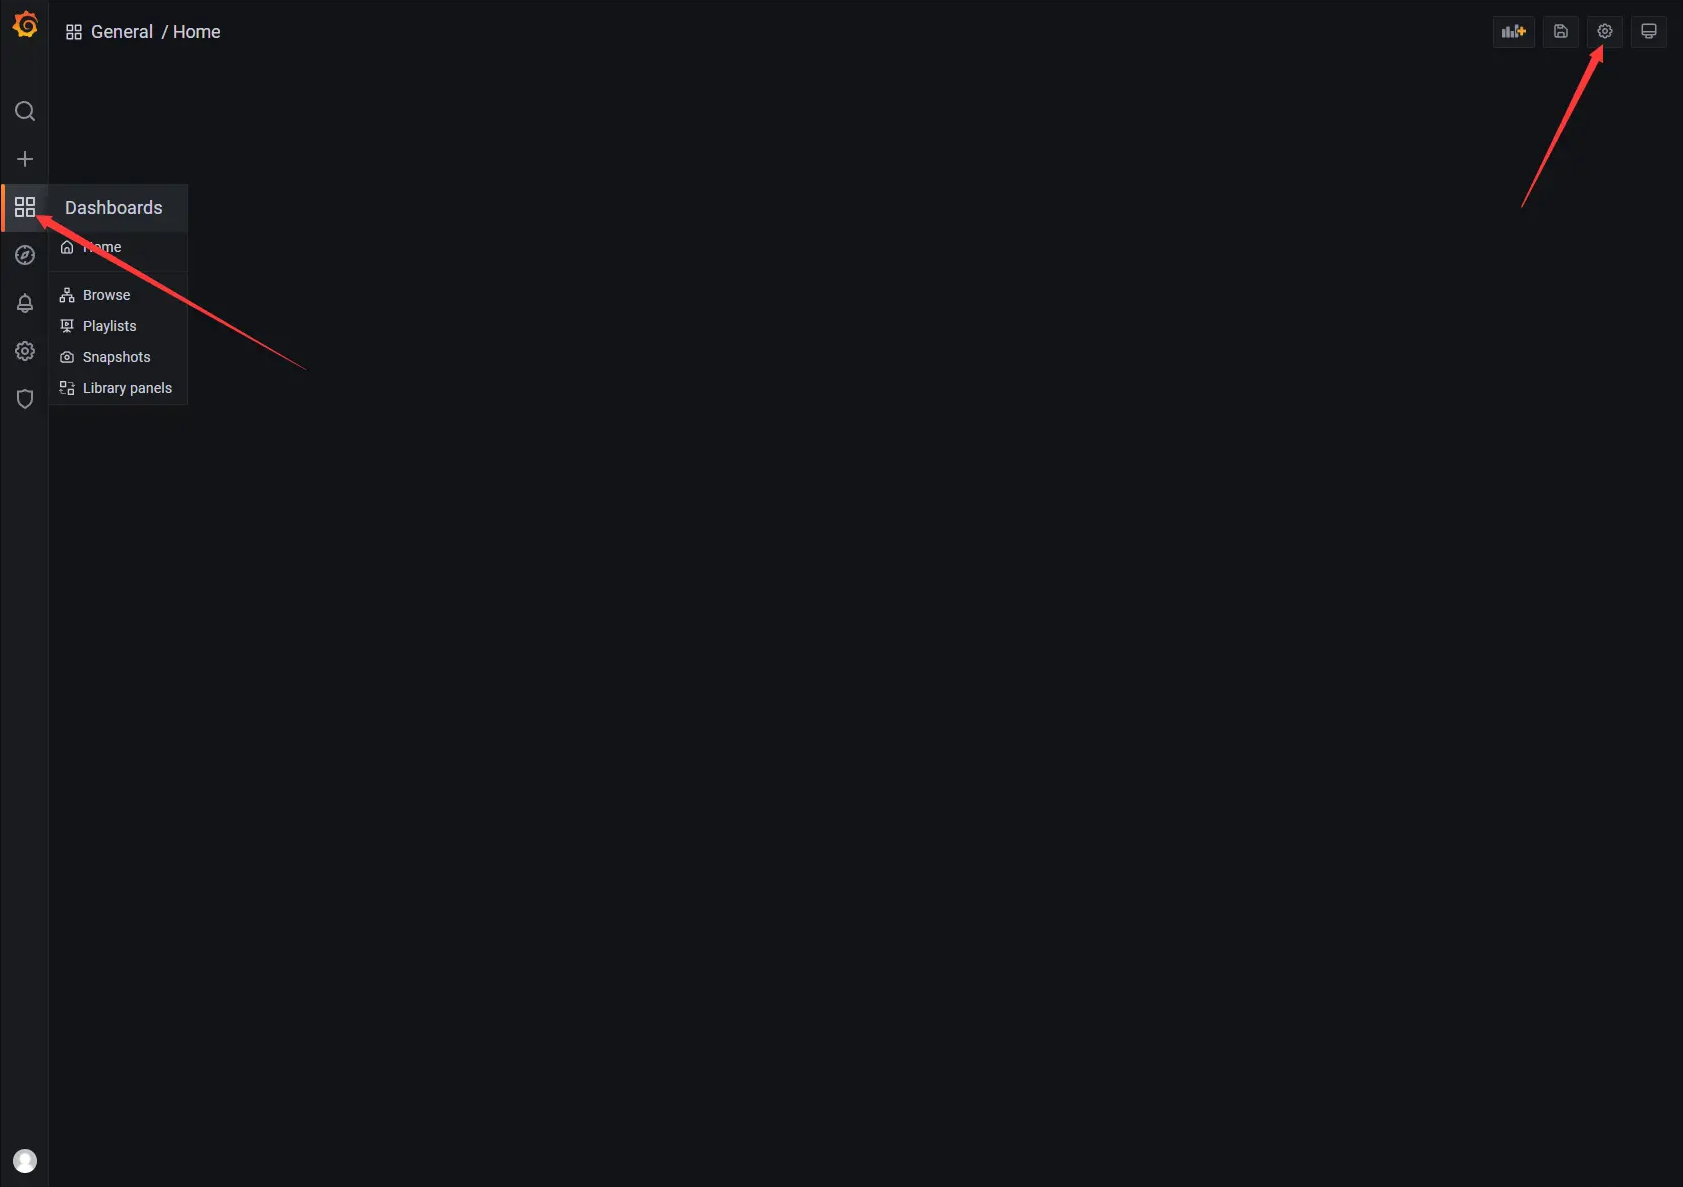
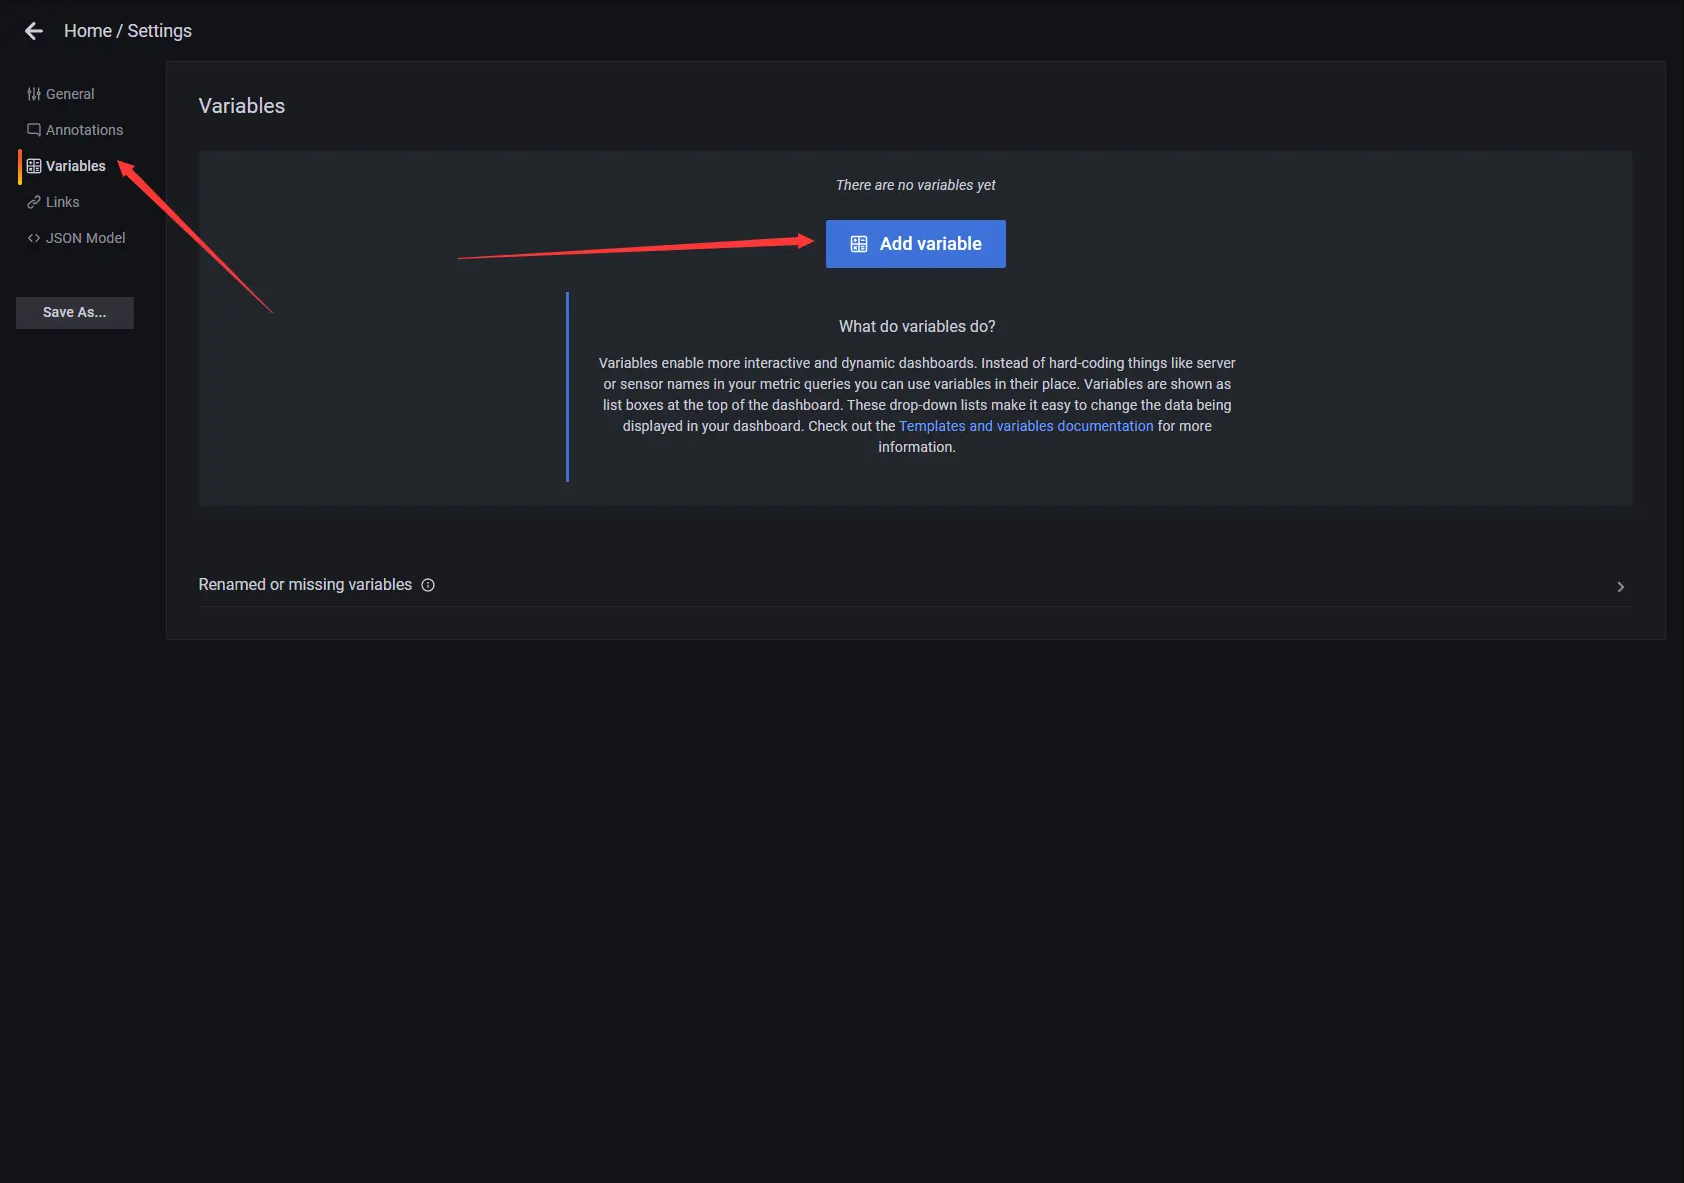
- Click Dashboard in the left sidebar, select the Dashboard settings button in the upper right corner, and select variables - > add variable on the Settings page to add variables to facilitate filtering for different tags.
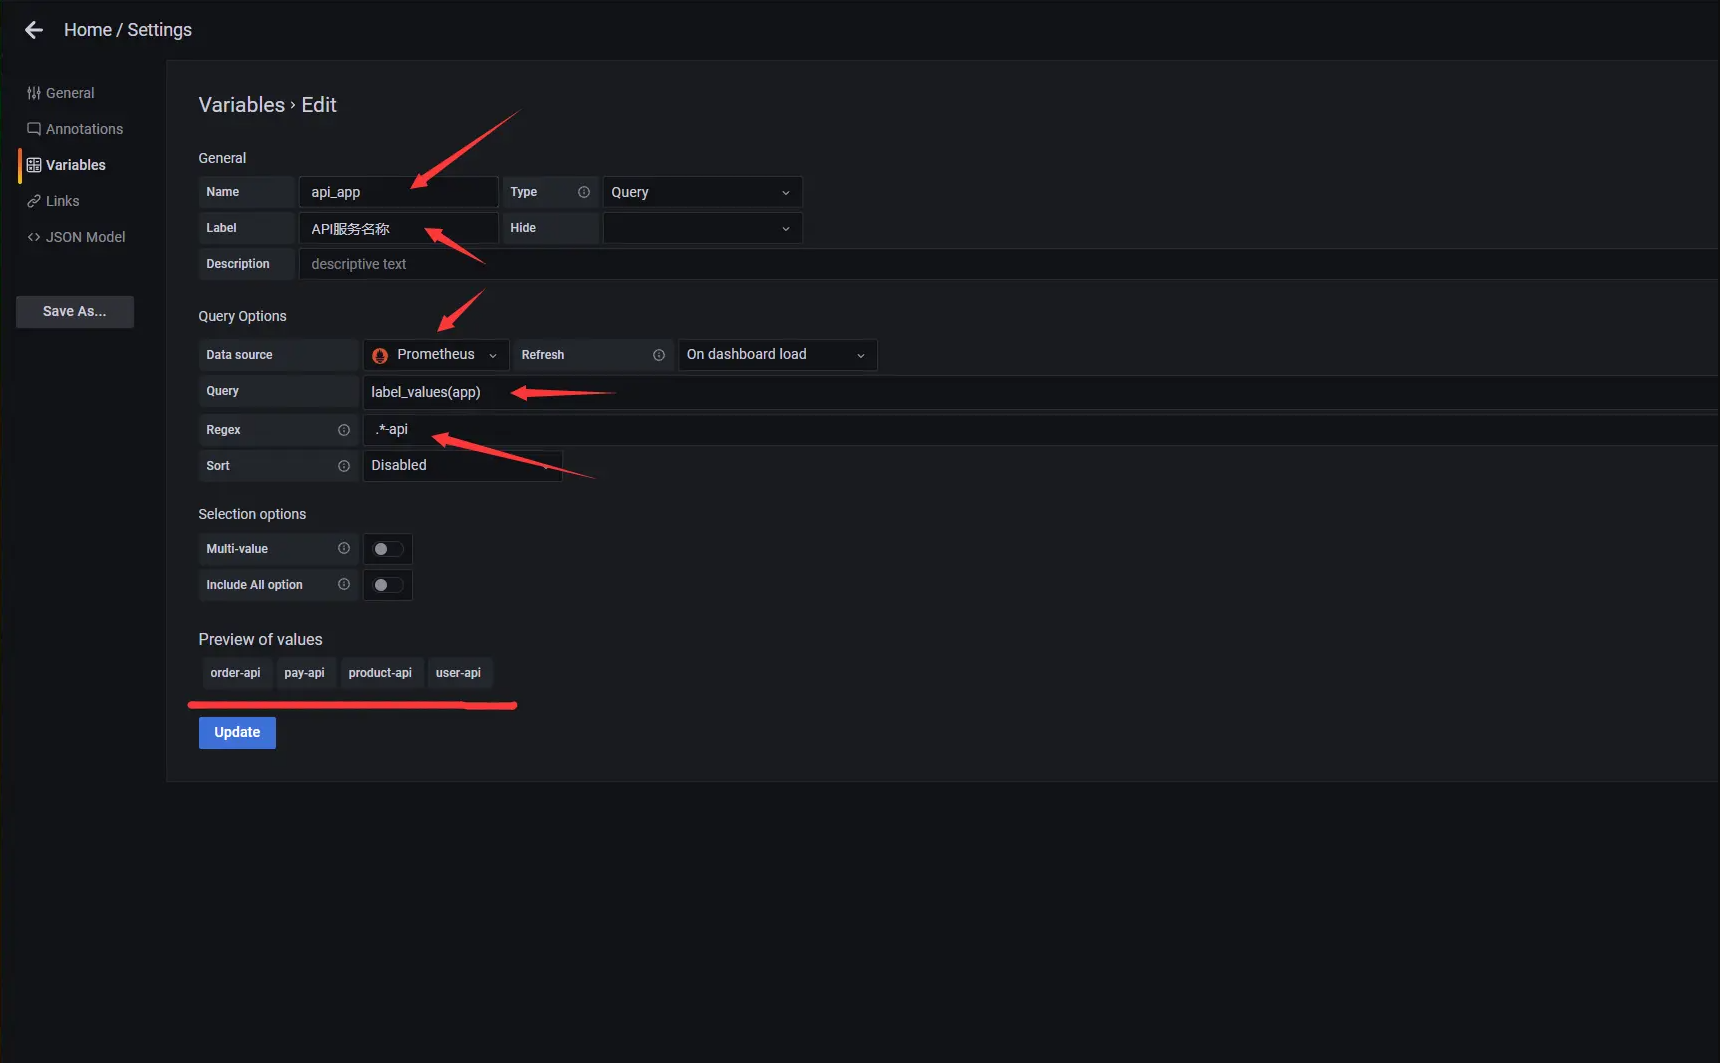
- Add APIs separately_ App API service name, rpc_app RPC service name variable, which is used for filtering different services. The variable data source selects the Prometheus data source, and uses regular expressions to extract the corresponding app tags.
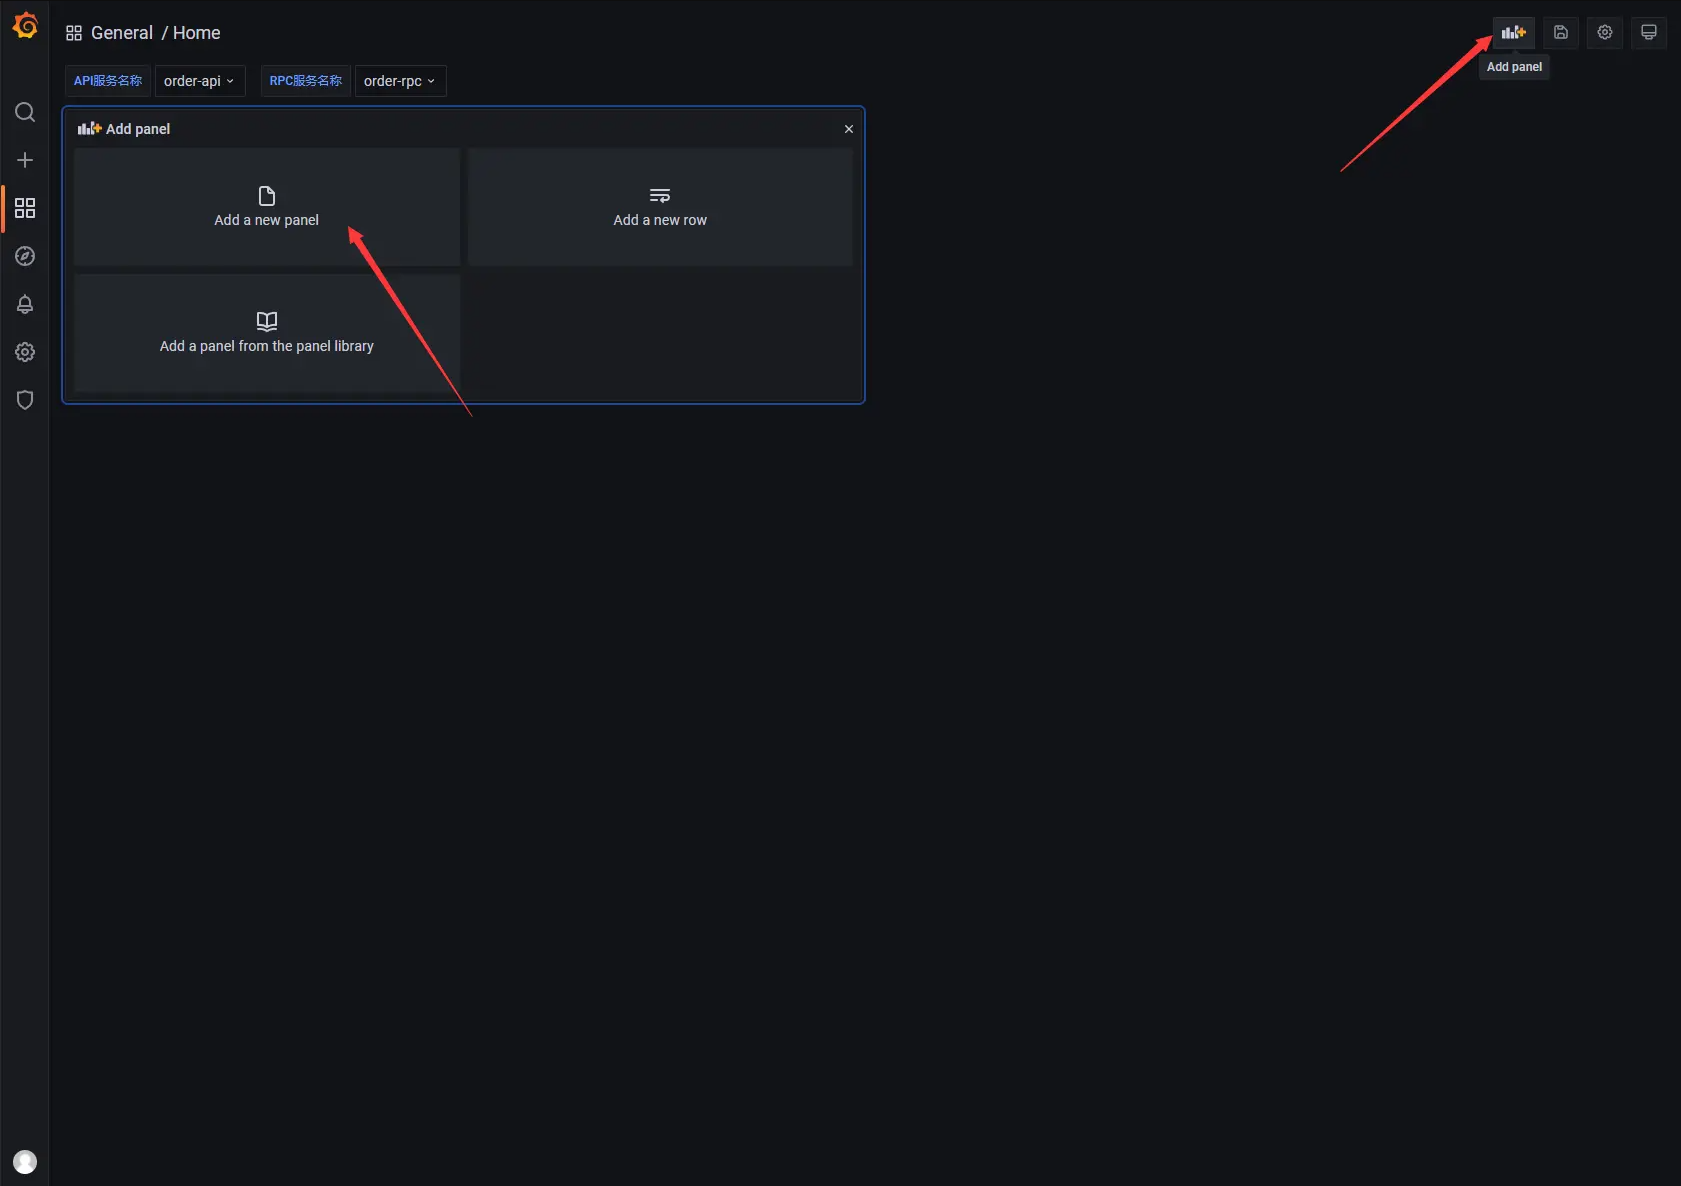
8.3.3 add api interface qps dashboard
- Go back to the Dashboard page, select the Add panel button in the upper right corner, and then select Add an empty panel to Add an empty panel.
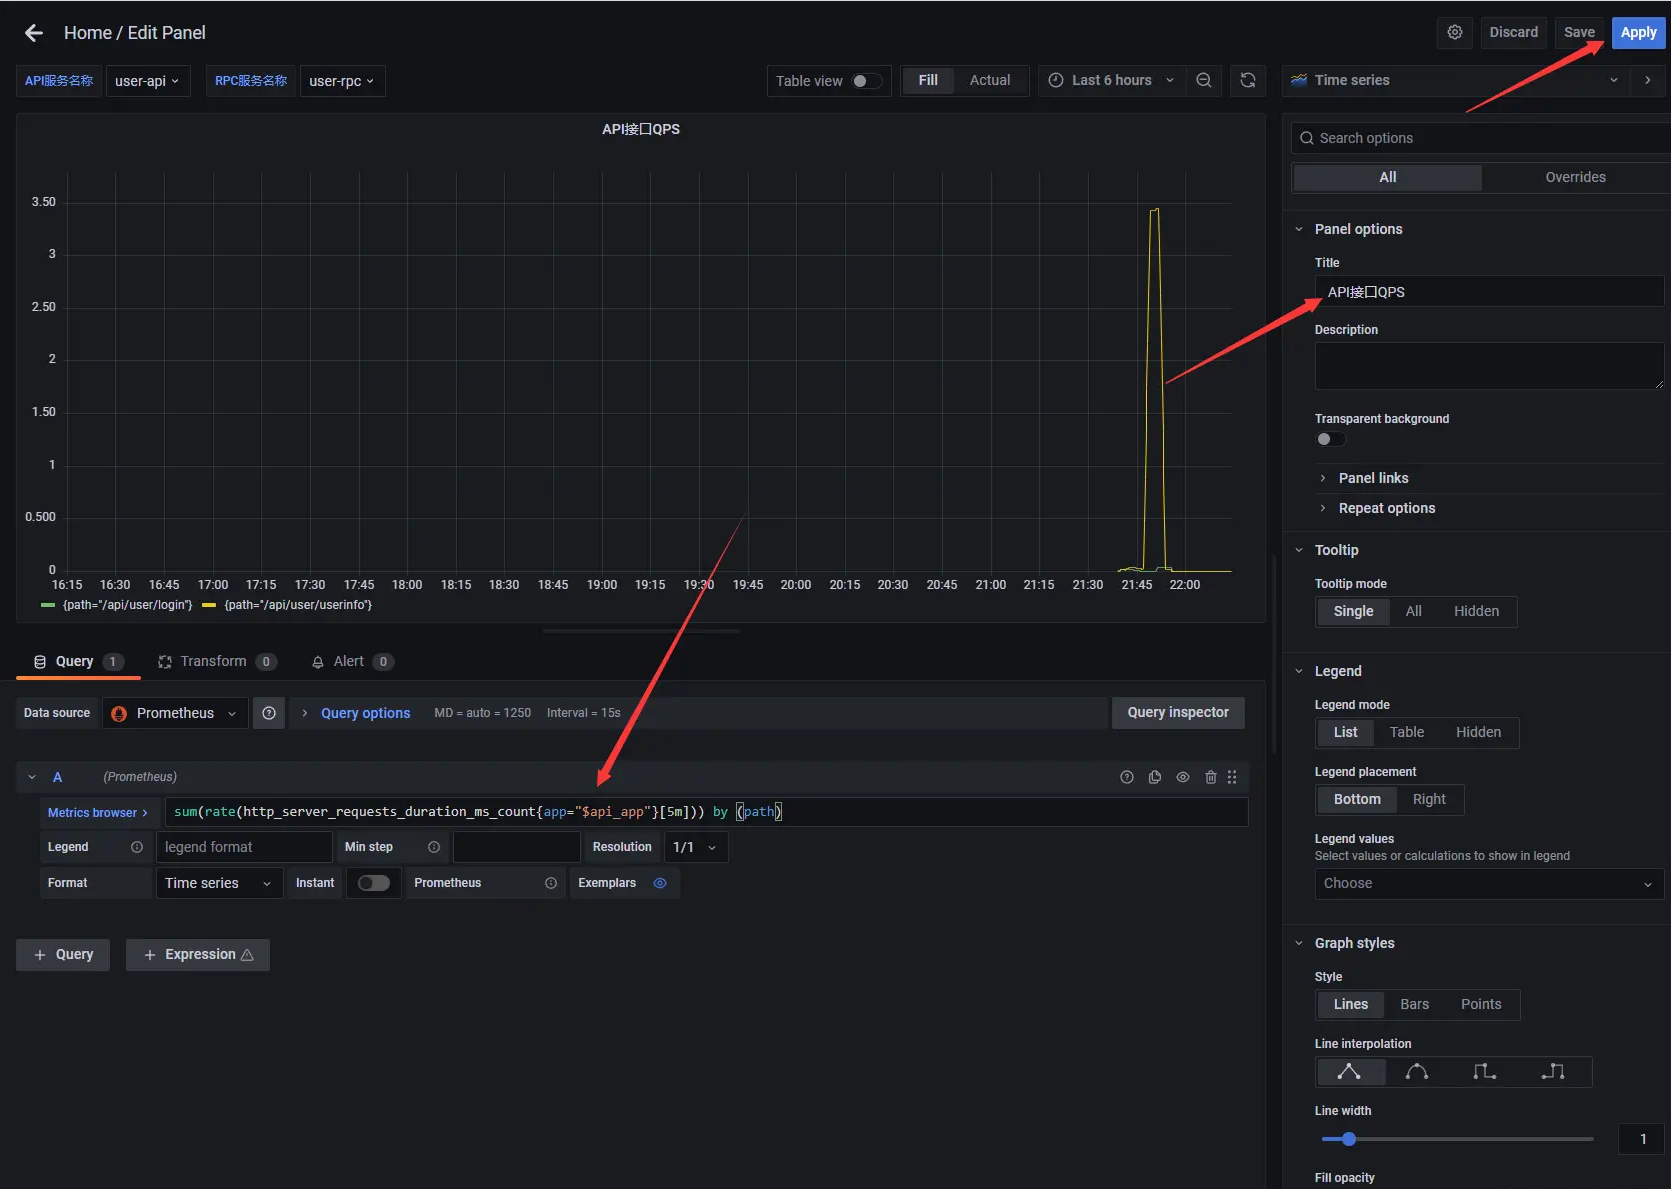
- On the panel editing page, modify the panel title to API interface qps, and enter sum (rate (http_server_requests_duration_ms_count {app = "$api_app"} [5m]) by (path) in Metrics to count the qps of API interface in the path dimension
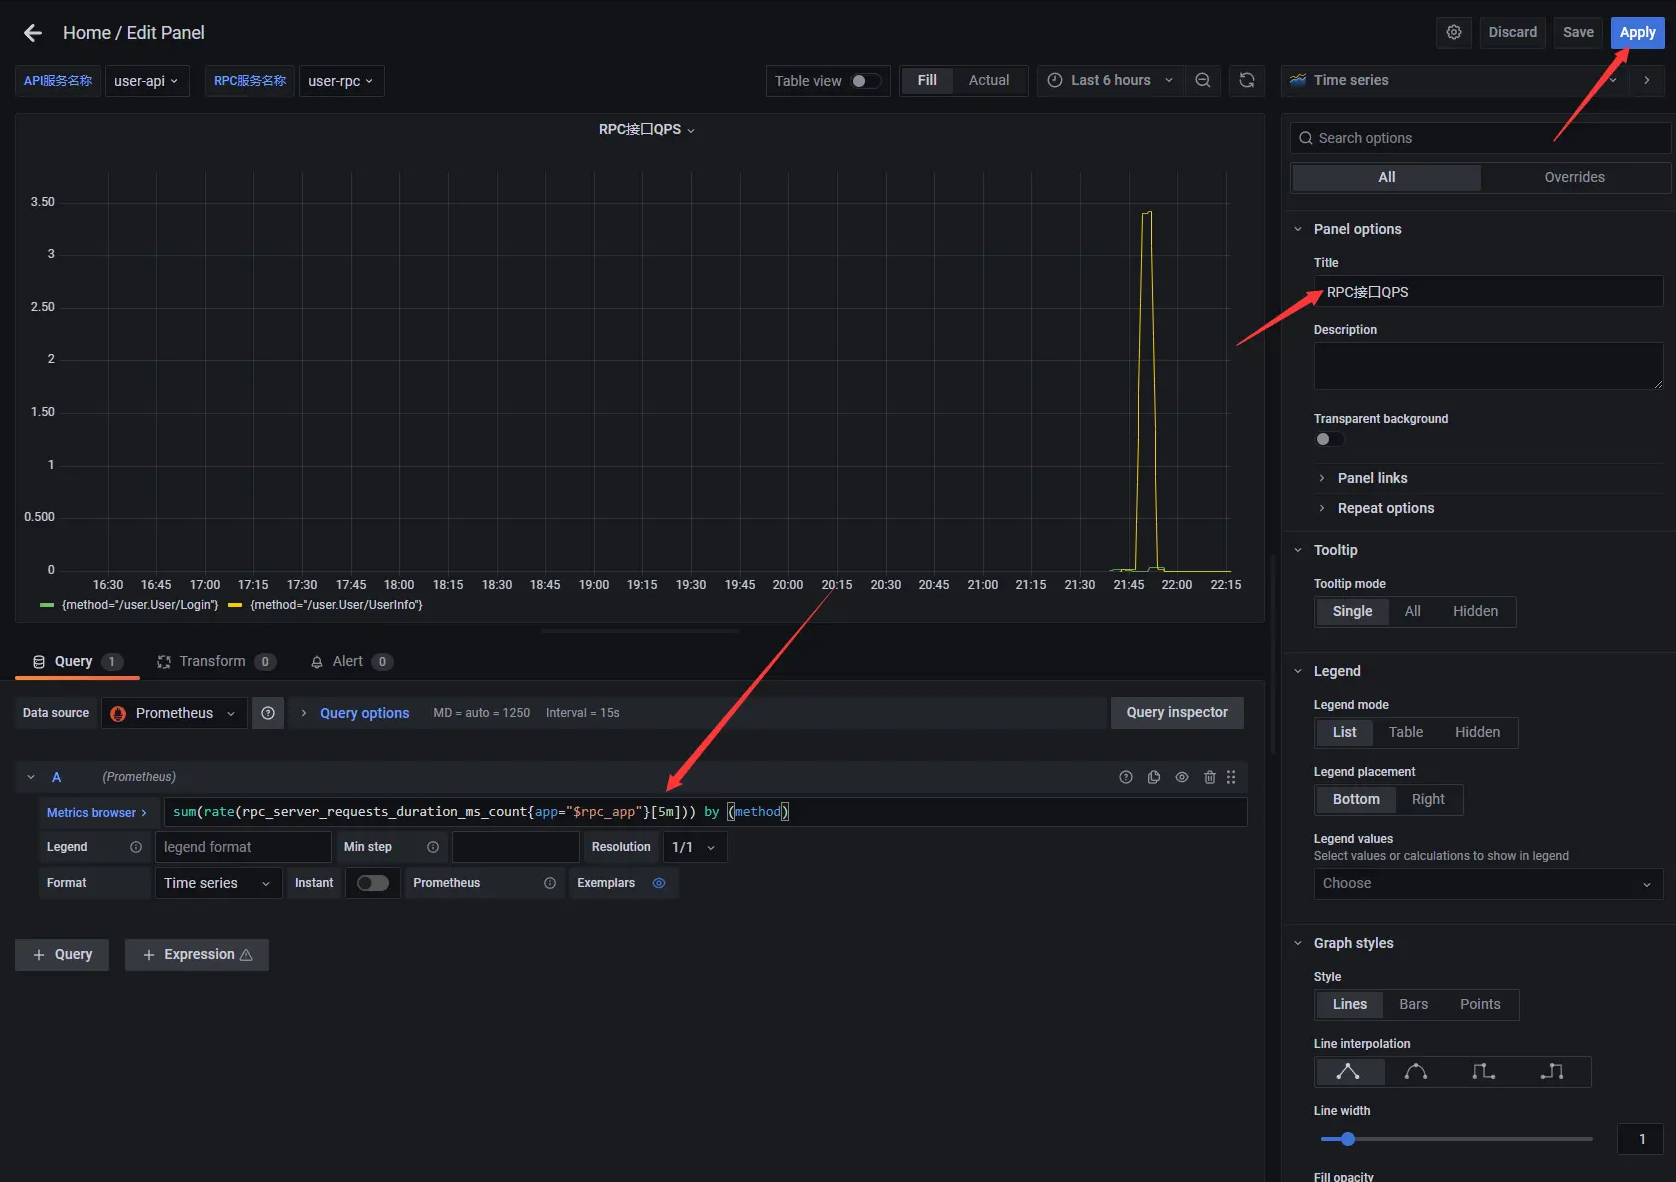
8.3.4 add rpc interface qps dashboard
- Create a new panel, modify the panel title to RPC interface qps, and enter sum (rate (rpc_server_requests_duration_ms_count {app = "$rpc_app"} [5m]) by (method) to count the qps of RPC interface in the method dimension
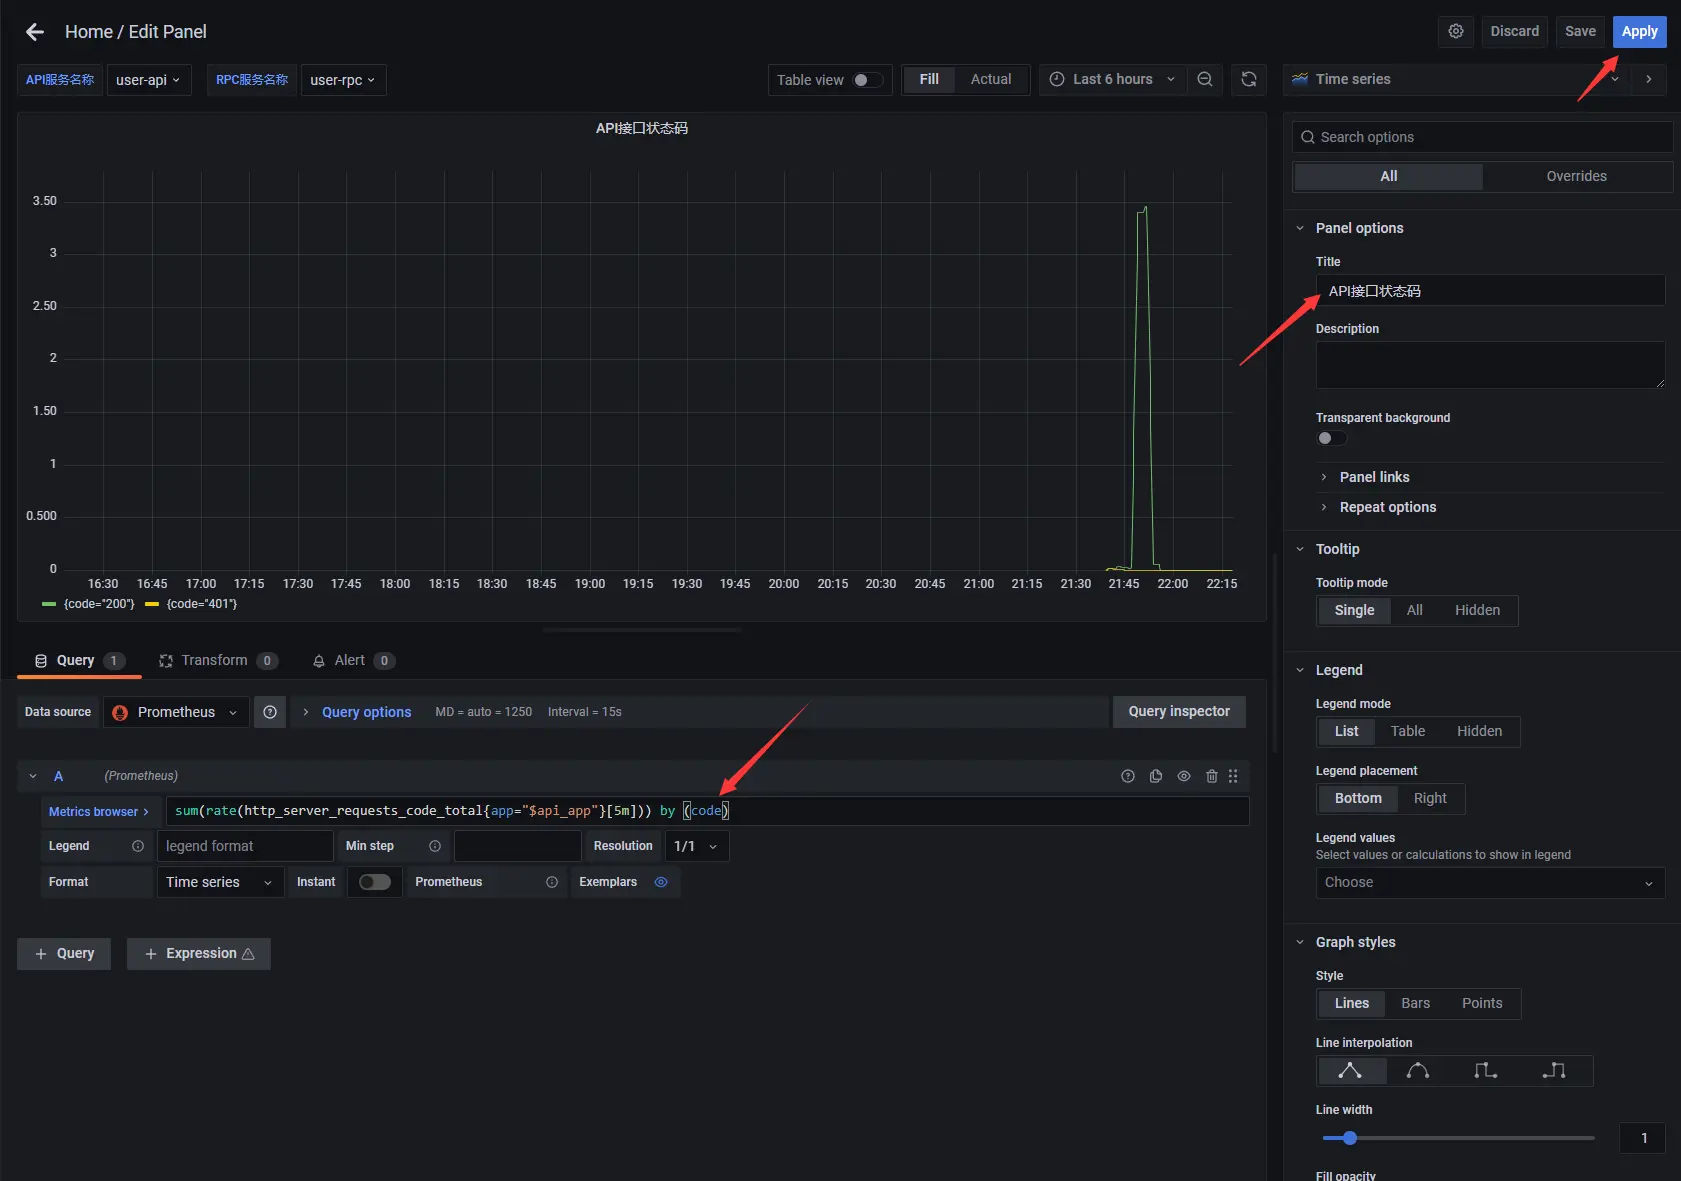
8.3.5 add api interface status code dashboard
- Create a new panel, modify the panel title to API interface status code, and enter sum (rate (http_server_requests_code_total {app = "$api_app"} [5m]) by (code) in Metrics to count the status code of API interface in code dimension
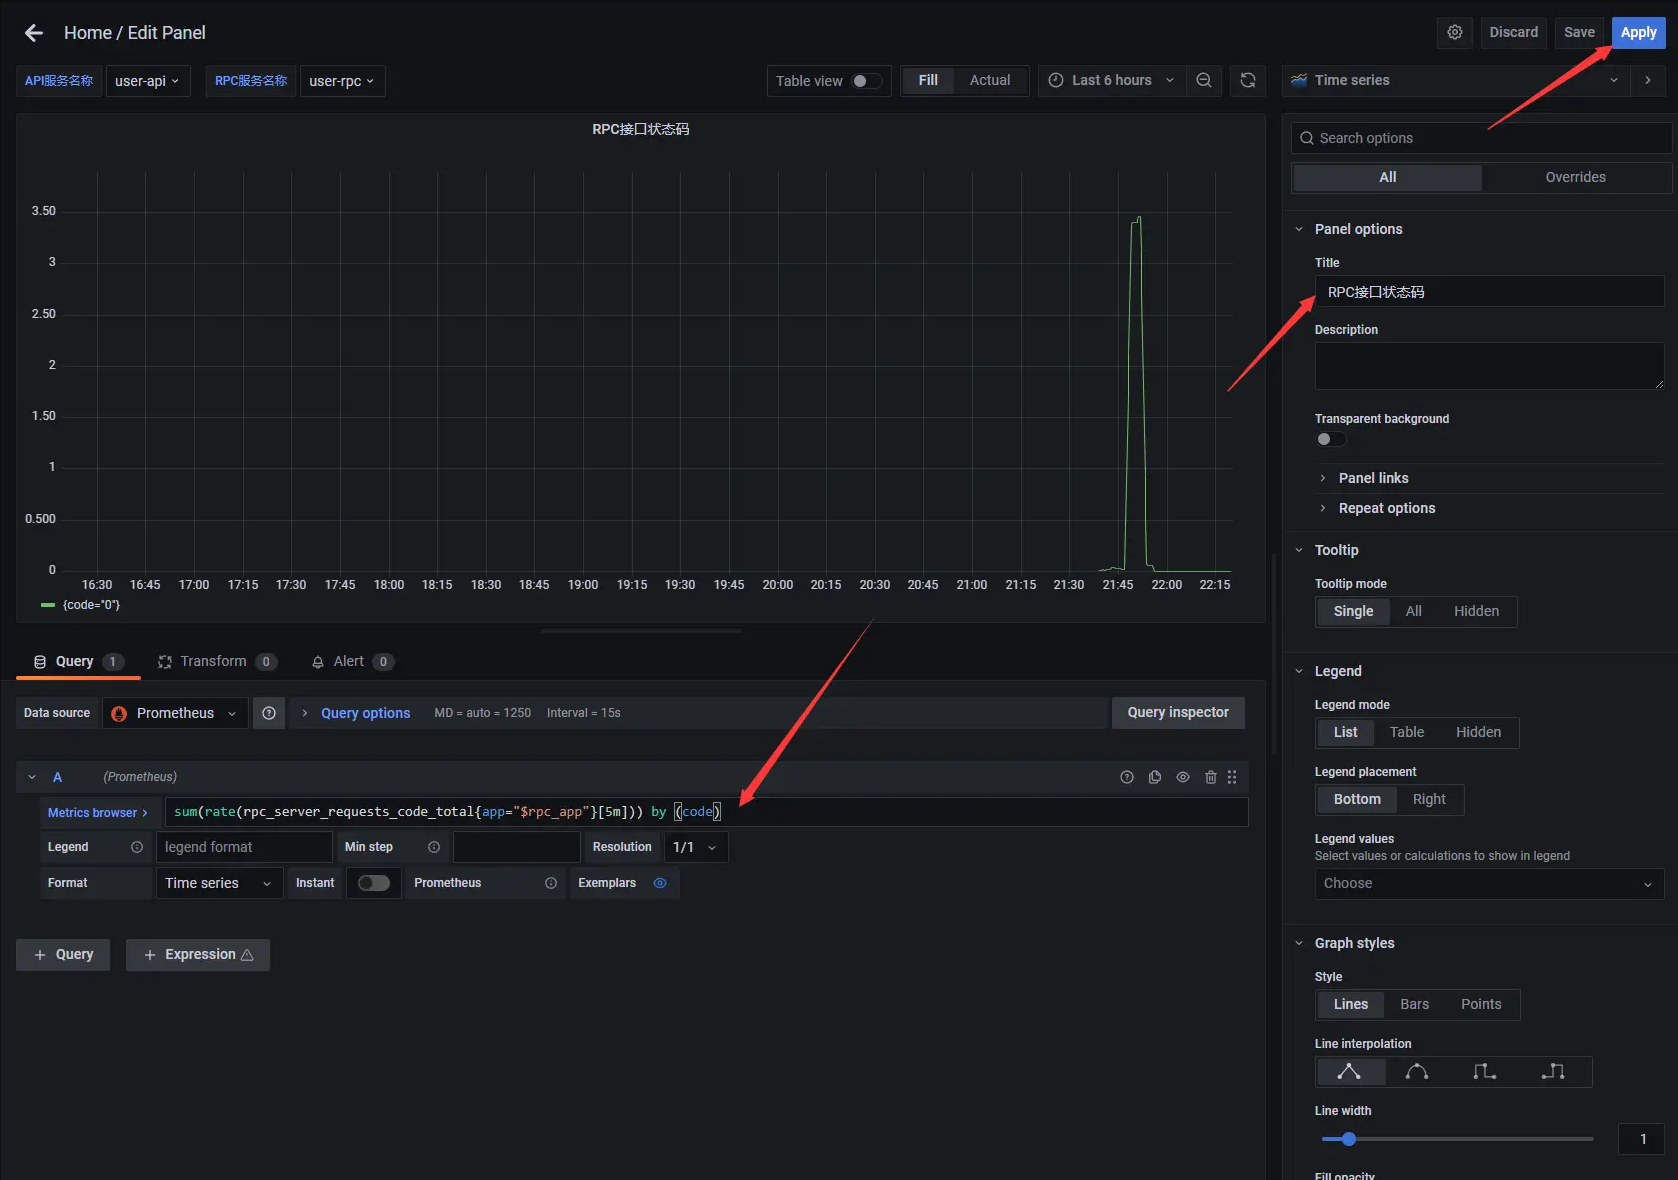
8.3.6 add rpc interface status code dashboard
- Create a new panel, modify the panel title to RPC interface status code, and enter sum (rate (rpc_server_requests_code_total {app = "$rpc_app"} [5m]) by (code) to count the status code of RPC interface in code dimension
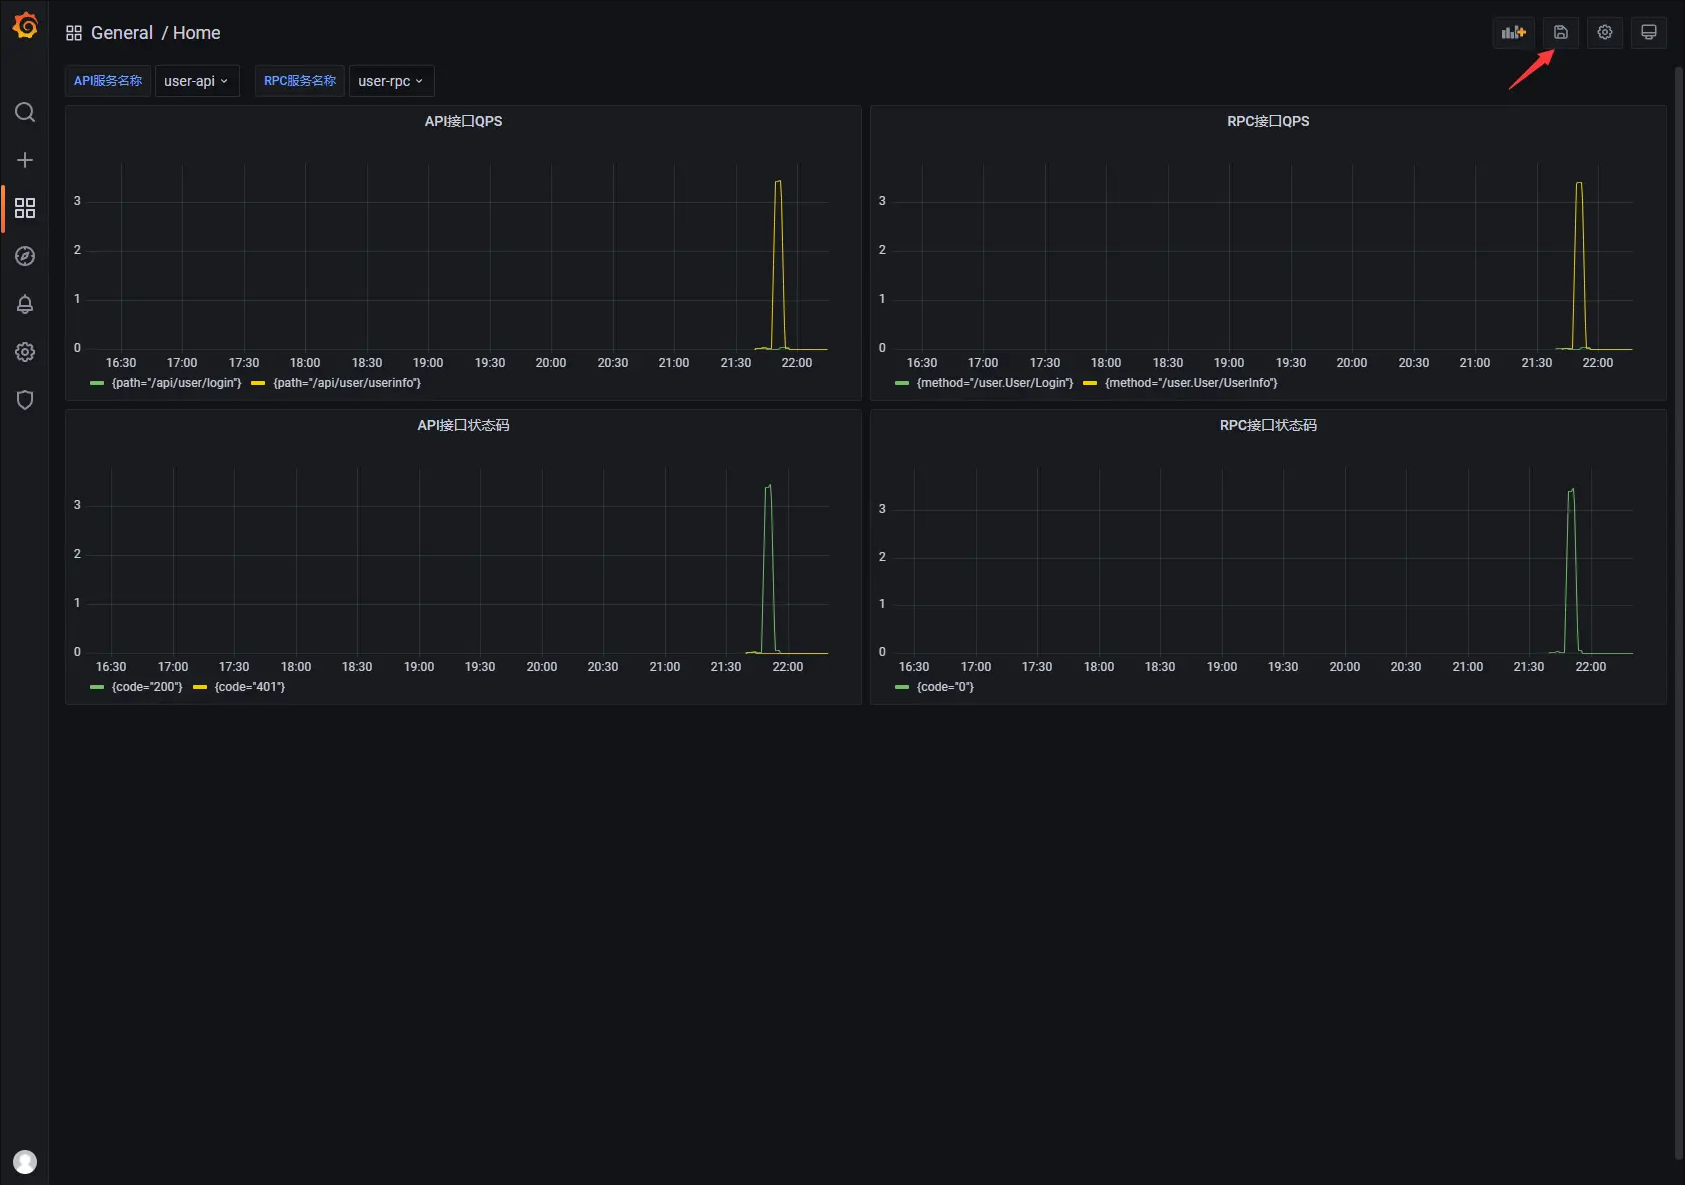
8.3.7 save dashboard
- Adjust the position of the lower panel and select the Save dashboard button in the upper right corner to save the dashboard.
Project address
https://github.com/zeromicro/go-zero
Welcome to go zero and star support us!
Wechat communication group
Focus on the "micro service practice" official account and click on the exchange group to get the community community's two-dimensional code.