Data function encapsulation of real-time stock acquisition
Module and method for realizing stock data acquisition
From the beginning of this lesson, we began to build the so-called quantitative trading system, the functional module of quantitative trading platform.
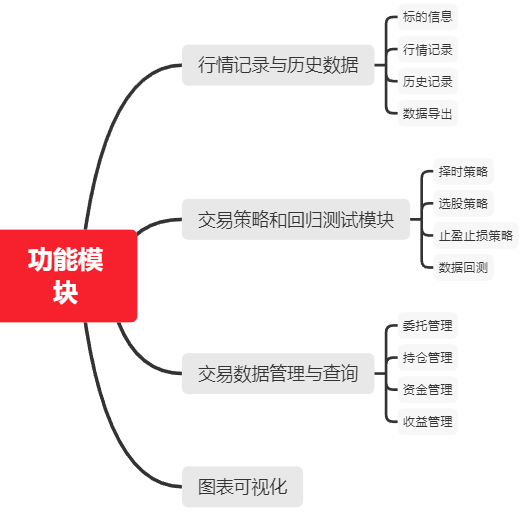
The above is the functional module diagram of the quantitative trading system, which is mainly divided into three parts. The first part is the market data,
-
Market records and historical data: mainly the subject information, financial data, valuation data and stored historical records of stocks. Export the data to csv for storage.
-
Trading strategy and regression test module: it mainly includes timing strategy and stock selection strategy. For these strategies, in order to ensure the effectiveness and accuracy of the data, it is also necessary to back test the data.
-
Transaction data management and query: mainly automatic transaction and data management and query, such as submission of entrustment, position information and income information.
Generally speaking, the function of the back end of the quantitative trading system is mainly, and the chart visualization part is relatively rough. We can use the visualization library such as matplotlib or echart to combine with the Python back-end code to realize the visualization of data, so as to facilitate everyone to understand what the trading logic looks like. If we add the function realization of the front end, It will involve a lot of functional modules. For example, I want to design the page framework, whether to choose flash or django. So we try to make the front end as simple as possible.
1, Code practice
This class mainly does two things.
First, we will create readme in the root directory of the project md.
If you are a programmer, you should be familiar with it. The purpose of this document is to tell the people who use our project what my source code is for, what modules there are, and what call relationships there are.
Second, we'll be in stock Py, which defines some common data acquisition methods.
def Get all A List of shares
def Get single stock market data
def Export stock market data
def Conversion stock market cycle
def Obtain financial indicators of individual stocks
def Obtain single stock valuation index
1.1 create readme md
In the root directory of the project, create a file called "readme MD "file:
# XuhssQuant

## functional module

### Market record (Data)

#### stock
- Get all A List of shares
- Get single stock market data
- Export stock related data
- Convert data into stock quotes for a specified period
- Obtain financial indicators of individual stocks
- Obtain single stock valuation index
1.2 define common data acquisition methods
Then in stock Create all functions in PY
# Get A list of all A shares
def get_stock_list():
    stock_list = list(get_all_securities(['stock']).index)
    return stock_list
# Get single stock market data
def get_single_price(stock_code, timefrequency, startdate, enddate):
    data = get_price(stock_code, start_date=startdate, end_date=enddate,count=5, frequency=timefrequency)
    return data
To export stock market data, you need to create a folder to store market data:
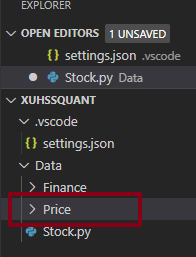
# Export stock related data (type: name of stored folder [Finace/Price])
def export_data(data, filename, type):
    fileroot = 'D:/software/00/01 extension/XuhssQuant/Data/' + type +'/' + filename + '.csv'
    data.to_csv(fileroot)
    print('Successfully stored, storage path is', fileroot)
# Convert data into stock quotes for a specified period
def transfer_price_freq(data, timefrequency):
    df_trans = pd.DataFrame()
    df_trans["open"] = data["open"].resample(timefrequency).first()
    df_trans['close'] = data['close'].resample(timefrequency).last()
    df_trans['high'] = data['high'].resample(timefrequency).max()
    df_trans['low'] = data['low'].resample(timefrequency).min()
    df_trans['volume(sum)'] = data['volume'].resample(timefrequency).sum()
    df_trans['money(sum)'] = data['money'].resample(timefrequency).sum()
    return df_trans
# Obtain financial indicators of individual stocks
def get_single_finance(code, date, statDate):
    data = get_fundamentals(query(indicator).filter(indicator.code == code), date = date, statDate=statDate)
    return data
# Obtain single stock valuation index
def get_single_valuation(code, date, statDate):
    data = get_fundamentals(query(valuation).filter(valuation.code == code), date = date, statDate=statDate)
    return data