Common tools
Common tools mainly include JDK's own tools and Arthas.
JDK's own tools
jps virtual machine process status tool
Example of tool commands for viewing virtual machine process status
$ jps

15236 Jps

14966 Example1
jstat virtual machine statistics monitoring tool
Used to view the heap memory, memory information, class loading and unloading information of the virtual machine
Display heap memory information
jstat -gc 14966

 S0C    S1C    S0U    S1U      EC       EU        OC         OU       MC     MU    CCSC   CCSU   YGC     YGCT    FGC    FGCT     GCT

2048.0 2048.0 0.0 0.0 12800.0 9345.8 34304.0 26638.8 5248.0 4971.3 640.0 554.9 2 0.032 2 0.049 0.082
Print the heap memory information every 1000 milliseconds for ten times

View loading and unloading information of classes
 $ jstat -class 14966

Loaded  Bytes  Unloaded  Bytes     Time

 829 1604.4 0 0.0 0.37
###Java configuration information tool
View the startup parameters of the JVM
$ jinfo -flags 26472

VM Flags:

-XX:CICompilerCount=3 -XX:InitialHeapSize=52428800 -XX:MaxHeapSize=52428800 -XX:MaxNewSize=17301504 -XX:MinHeapDeltaBytes=524288 -XX:New
jstack Java stack trace tool

That is, generate relevant snapshots for the current memory to save relevant snapshot information.
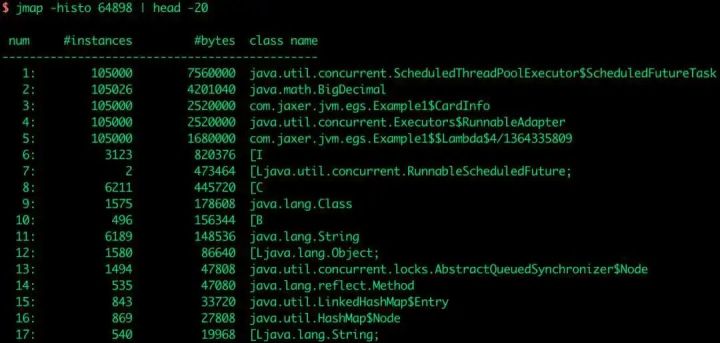
jmap Kava memory mapping tool
Used to view the number of memory objects and memory space occupied
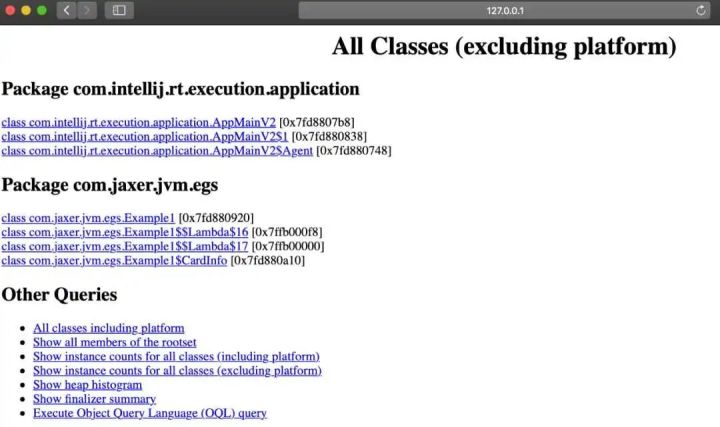
jhat generates snapshot files of html type
$ jhat dump.hprof

Reading from dump.hprof...

Dump file created Sun May 03 17:09:07 CST 2020

Snapshot read, resolving...

Resolving 42293 objects...

Chasing references, expect 8 dots........

Eliminating duplicate references........

Snapshot resolved.

Started HTTP server on port 7000

Server is ready
After startup, open in the browser, http://localhost:7000/
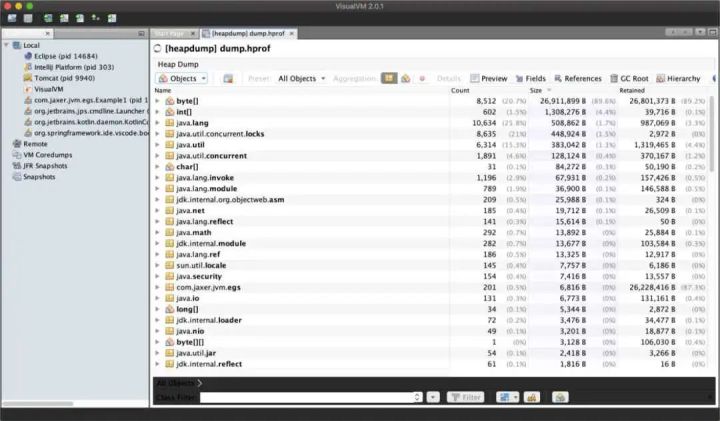
Jvisualvm & visualvm: heap dump snapshot analysis tool
Like the command above, export the file directly instead of the website
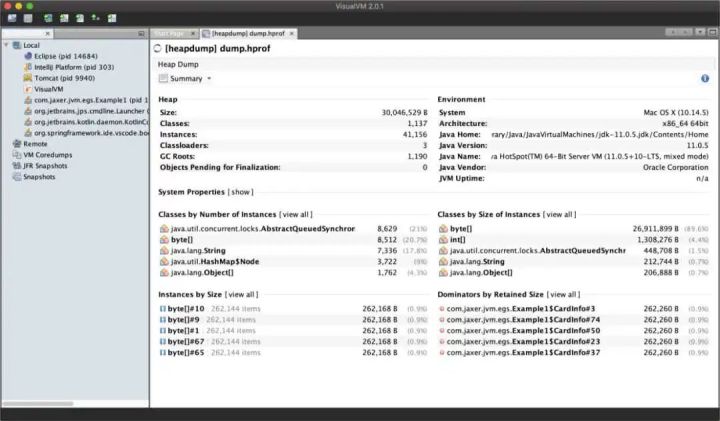
Object information
Thread information
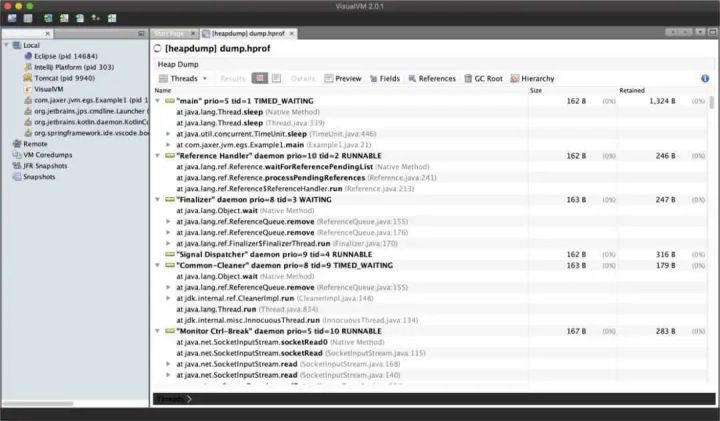
jconsole: JVM performance monitoring
Launch the user interface for performance monitoring

After successful startup

Arthas
Alibaba's open source Java diagnostic tool
install
download
wget https://alibaba.github.io/arthas/arthas-boot.jarjava -jar arthas-boot.jar
decompression
unzip arthas-packaging-bin.zip
install
sudo su adminrm -rf /home/admin/.arthas/lib/*cd arthas./install-local.sh
start-up
./as.sh
help

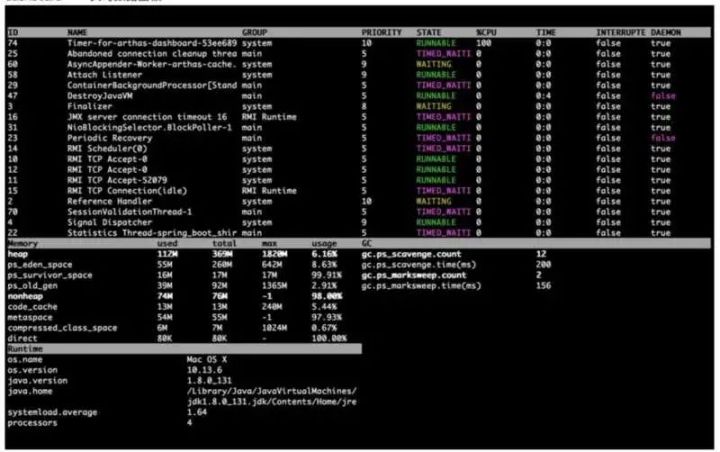
dashboard real time data panel
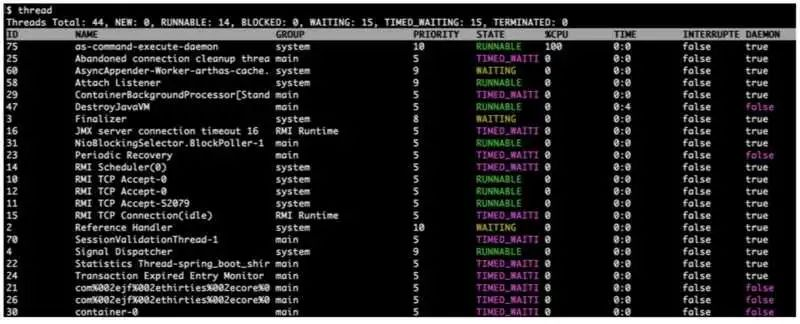
Thread thread information
jad decompile class

watch data observation

tuning
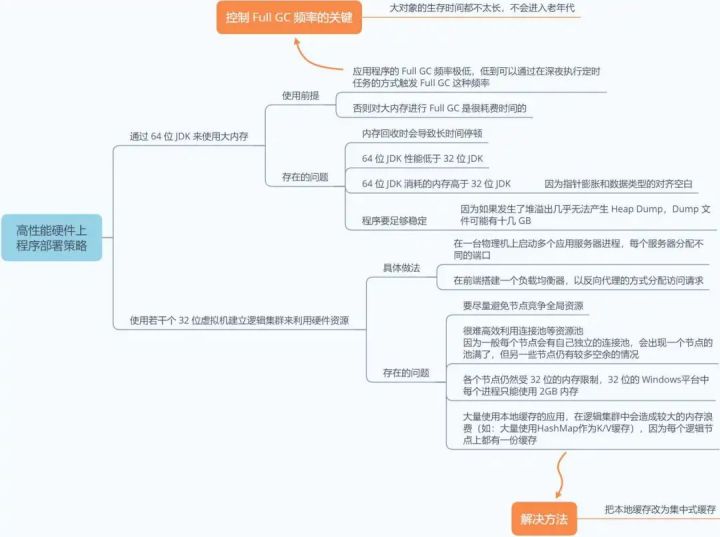
Deployment mode
The server often gets stuck
This is caused by the long time of Full GC. The general reason is
-
The new generation is too small, and the object enters the old generation in advance, triggering Full GC
-
The elderly generation is larger, and the time of one Full GC is longer
The solution is to reduce the value of the old generation of objects into the new ratio as small as possible
Adjust memory usage
Direct memory
Adjust XX:MaxDirectMemorySize to avoid OutOfMemoryError: Direct buffer memory
Thread Stack
Adjust - Xss to avoid StackOverflowError or OutOfMemoryError: unable to create new native thread
The survival of a large number of objects in the Cenozoic generation is solved from the perspective of GC, and Minor GC takes too long
Parameter adjustment
-XX:SurvivorRatio=65536

-XX:MaxTenuringThreshold=0

-XX:AlwaysTenure
Author:___ mySoul
last
If you need this redis video, interview questions and technical documents compiled by Tsinghua Daniel, which are necessary for entering the factory, You can get it for free by poking here!
I wish you all to enter the big factory as soon as possible and get a satisfactory salary and rank ~ ~ ~ come on!!
Thank you for your support!!
aysTenure
> Author:___mySoul

### last

**If you need this, it's necessary for you to enter the factory redis Video, interview questions and technical documents,[You can get it for free by poking here!](https://docs.qq.com/doc/DSmxTbFJ1cmN1R2dB)**

I wish you all to enter the big factory as soon as possible and get a satisfactory salary and rank~~~come on.

Thank you for your support!!

[External chain picture transfer...(img-JnDw7mNP-1623500367499)]