1, Introduction
Hello, I'm sailing. The content shared today is based on Python programming to realize the development of stock trading related functions. If readers do not know much about stock or financial derivative trading and are more interested, they can query relevant materials by themselves.
Next, the author will introduce several common trading strategies in stock trading and the process of compiling source code. If you have heard of the word excessive trading, you may have known the trading strategy, which roughly means to continuously buy and sell stocks, cryptocurrencies or financial derivatives according to their trading strategies in the process of price fluctuations, Continue to arbitrage and reduce the cost of positions to maximize returns.
There are many kinds of common trading strategies, such as trend type, grid type, scalp peeling, probability law, high-frequency trading, etc. today, we mainly introduce two low-frequency trading strategies, high throw low absorb grid Trading Strategy and day T strategy. Other trading strategies are more complex, and readers can understand them by themselves. The author recommends a quantitative trading website here for reference only. Mi basket quantification:
https://www.ricequant.com/doc/quant/
2, Demand analysis & implementation ideas
Stocks will rise or fall every trading day. In this process, the authors occasionally want to monitor the rise and fall of some stocks or trade automatically. On the premise of this demand, the existing securities companies and stock analysis software will have the function of robot automatic trading strategy, Most of them need to be charged or some strategies can not meet their own needs. The author provides two implementation ideas:
1. With the help of the existing quantitative platform, write the strategy and back test analysis, and then implement the strategy at the software level of securities companies.
2. Write their own function code to monitor the valuation, and deal with the fluctuation of stock price to meet special needs.
The first one has low implementation cost, but its function is limited by the platform; The second implementation cost is undoubtedly relatively high, but the logic can be controlled by itself.
3, Write strategy and back test analysis with the help of existing quantitative platform
In order to realize and analyze your own trading strategy quantitatively, you need to register an account first, and then enter the platform - the author's strategy for strategy writing. For the use of the functions of the platform, please refer to the platform documents.
Here I post two kinds of strategy codes written by myself. This platform only supports Python scripting.
1) Spread trading strategy
Platform screenshot:
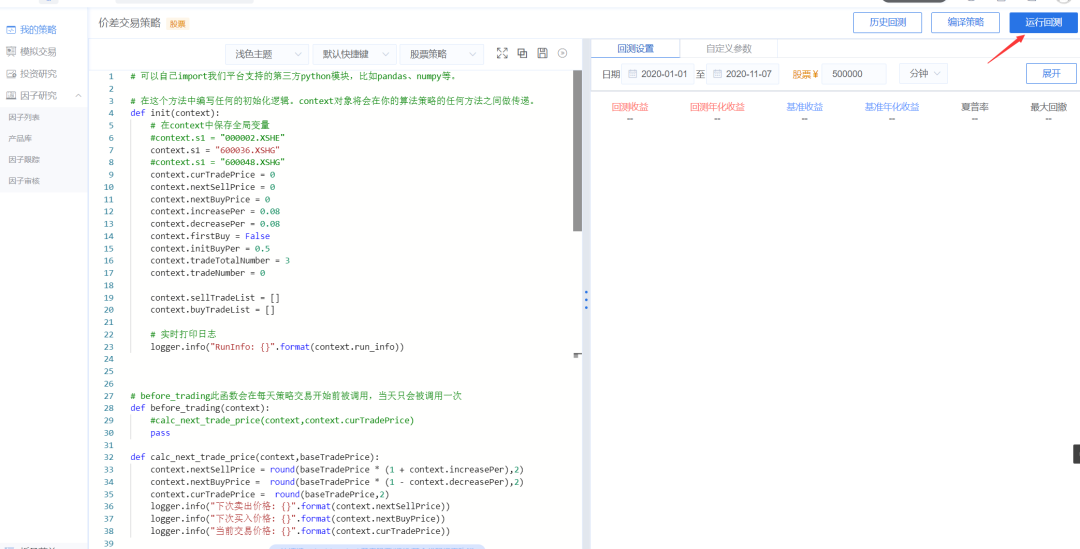
Part of the code is as follows. The detailed code can be implemented by yourself or obtained at the end of the text:
# The data update of the securities you select will trigger this logic, such as daily or minute historical data slice or real-time data slice update
def handle_bar(context, bar_dict):
...
    if newPrice >= context.nextSellPrice:
        logger.info("Execute high selling transaction,Corresponding price:{}".format(newPrice))
        amount = context.portfolio.positions[context.s1].quantity
        if amount >= context.tradeNumber:
            logger.info("Execute high selling transaction,Corresponding quantity:{}".format(context.tradeNumber))
            order_shares(context.s1, -context.tradeNumber)
            plot("S", newPrice)
        elif amount >= 100:
            logger.info("Execute high selling transaction,Corresponding quantity:{}".format(amount))
            order_shares(context.s1, -amount)
            plot("S", newPrice)

        calc_next_trade_price(context,newPrice)
        obj = {
            "nextSellPrice":context.nextSellPrice,
            "nextBuyPrice":context.nextBuyPrice,
            "curTradePrice":context.curTradePrice
        }
        context.buyTradeList.append(obj)

    if newPrice <= context.nextBuyPrice:
        logger.info("Execute bargain hunting,Corresponding price:{}".format(newPrice))
        amount = int(context.portfolio.cash / newPrice / 100.0)  * 100
        if amount >= context.tradeNumber:
            logger.info("Execute bargain hunting,Corresponding quantity:{}".format(context.tradeNumber))
            order_shares(context.s1, context.tradeNumber)
            plot("B", newPrice)

        calc_next_trade_price(context,newPrice)

        obj = {
            "nextSellPrice":context.nextSellPrice,
            "nextBuyPrice":context.nextBuyPrice,
            "curTradePrice":context.curTradePrice
        }
        context.sellTradeList.append(obj)
Select the back test time period, click the button on the right side of the right platform to run the back test, and the result page is as follows:
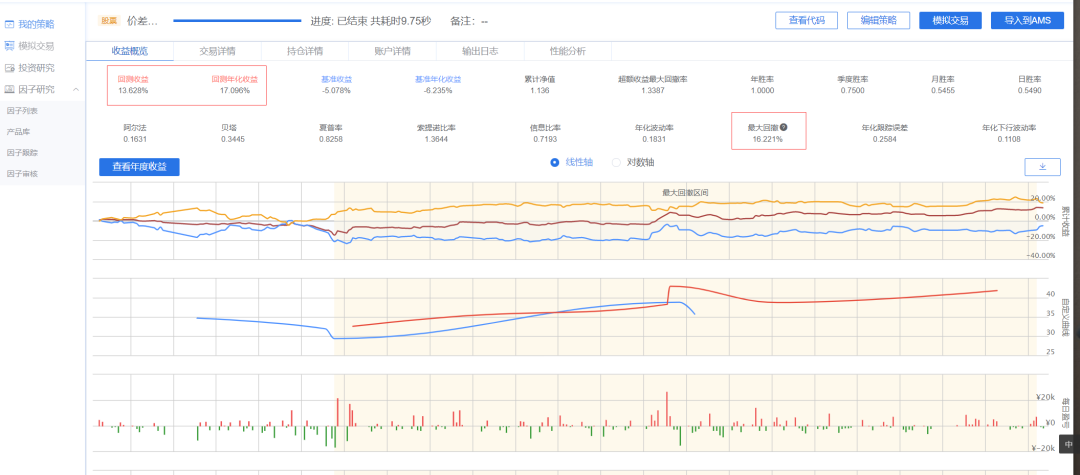
It can be seen from the results that the price difference grid trading is carried out for the stock of China Merchants Bank [600036], and its parameters are set to sell when it rises by 8% and buy when it falls by 8%. The maximum number of consecutive falling purchases is 3 times.
Back test income: 13.628%
Back test annualized income: 17.096%
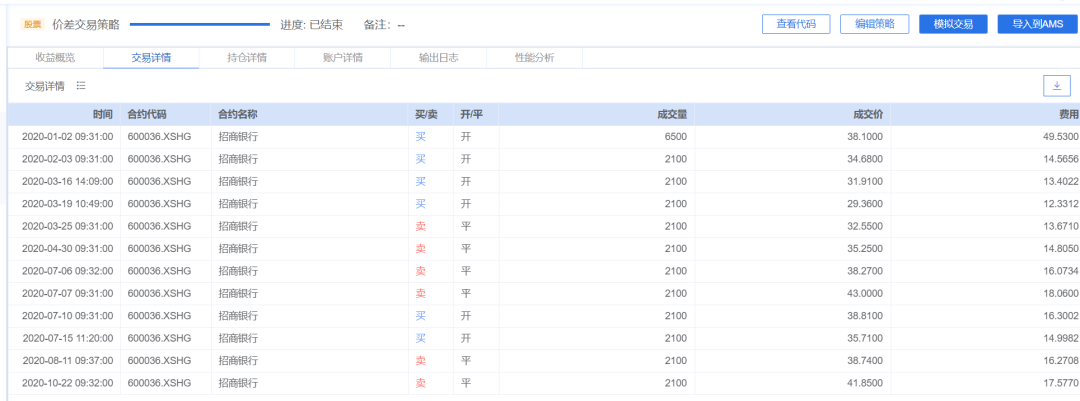
It is much higher than the benchmark annualized return of - 6%, which is that this strategy can be implemented in the process of stock price fluctuation to continuously reduce the position cost. From the transaction details panel, this strategy can adjust the transaction frequency through parameters. When the rise and fall ratio is large, the number of transactions can be controlled relatively less. The results are as follows:
2) Do T strategy within days
Similarly, only part of the code is posted
# The data update of the securities you select will trigger this logic, such as daily or minute historical data slice or real-time data slice update
def handle_bar(context, bar_dict):
...
    newPrice = bar_dict[context.s1].last
    if newPrice >= context.nextSellPrice:
        context.lastTradeType = 1
        logger.info("Execute high selling transaction,Corresponding price:{}".format(newPrice))
        amount = context.portfolio.positions[context.s1].quantity
        #if amount - context.tradeNumber >= context.lockStockNumber:
        if amount - context.tradeNumber >= 0:
            logger.info("Execute high selling transaction,Corresponding quantity:{}".format(context.tradeNumber))
            order_shares(context.s1, -context.tradeNumber)
            plot("S", newPrice)
        else:
            logger.info("The number of stocks is insufficient to execute high selling transactions,Corresponding quantity:{}".format(amount))
            return

        calc_next_trade_price(context,newPrice)

        obj = {
            "nextSellPrice":context.nextSellPrice,
            "nextBuyPrice":context.nextBuyPrice,
            "curTradePrice":context.curTradePrice
        }
        context.buyTradeList.append(obj)

    if newPrice <= context.nextBuyPrice:
        context.lastTradeType = 0
        logger.info("Execute bargain hunting,Corresponding price:{}".format(newPrice))
        amount = int(context.portfolio.cash / newPrice / 100.0)  * 100
        if amount >= context.tradeNumber:
            logger.info("Execute bargain hunting,Corresponding quantity:{}".format(context.tradeNumber))
            order_shares(context.s1, context.tradeNumber)
            plot("B", newPrice)
        else:
            logger.info("Insufficient cash to execute bargain hunting,Corresponding quantity:{}".format(amount))
            return

        calc_next_trade_price(context,newPrice)

        obj = {
            "nextSellPrice":context.nextSellPrice,
            "nextBuyPrice":context.nextBuyPrice,
            "curTradePrice":context.curTradePrice
        }
        context.sellTradeList.append(obj)
Generally speaking, the code logic is relatively simple, which is to deal with the rise and fall of prices. Its parameters are set to sell when the price rises by 2% and buy when the price falls by 2%. The proportion of initial purchase funds is 70% and the lowest position is 50%. Then run the back test, and the results are as follows
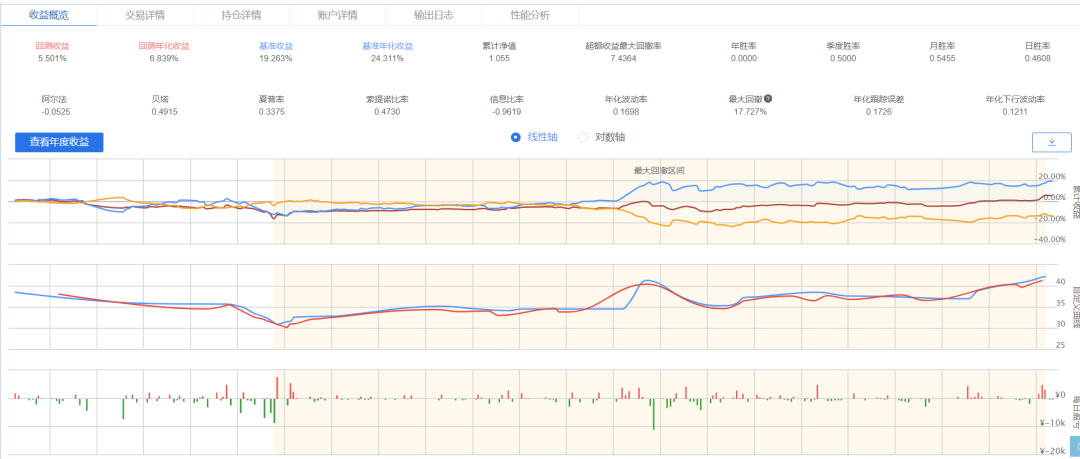
Back test income: 5.501%
Back test annualized income: 6.839%
Benchmark income: 19.26%
It can be seen that the high-frequency trading of T in the day may not be high in the long run, and it is suitable to operate in the short-term price.
4, Summary
I'm sailing. It is very convenient for the author to use the pricing strategy on the trading platform, but it is not very convenient for the author to use it on the trading platform, or it can only be used on the pricing logic. Based on Python and with the help of the existing quantitative platform, this paper writes strategies and back test analysis, hoping to be helpful to everyone's learning.
Finally, the small buddy who needs this code can reply to the "spread price" keyword in the background of the official account. It feels good.

This is the end of the article. Thank you for watching
To be honest, I feel very happy every time I see some readers' responses in the background. I want to contribute some of my collection of programming dry goods to you and give back to every reader. I hope I can help you.
Dry goods mainly include:
① More than 2000 Python e-books (both mainstream and classic books should be available)
② Python standard library materials (the most complete Chinese version)
③ Project source code (forty or fifty interesting and classic hand training projects and source code)
④ Videos on basic introduction to Python, crawler, web development and big data analysis (suitable for Xiaobai)
⑤ Summary of all Python knowledge points (you can find out all directions and technologies of Python)
*If you can use it, you can take it directly. In my QQ technology exchange group, you can take it by yourself. The group number is 857113825*