prometheus is used to collect data, Grafana is used as a mapping display, and Alertmanager outputs alarms
The monitoring alarm platform runs using docker compose
Refer to other documents to complete the installation of docker and docker compose
Basic environment
- Docker, docker compose installation completed
- centos7.9
- IP: 192.168.3.10
- The firewall and SELinux have been turned off (/ etc/selinux/config modify SELinux value to disable)
- Data disk space: estimated according to the storage time and the number of monitoring points (mainly prometheus data)
- Create monitoring folder
# Main monitoring folder
mkdir monitor
# Create various application folders of the monitoring platform. The following are in the main monitoring folder monitor

# Create prometheus folder
mkdir -p prometheus/data
chmod 777 data

# Create Grafana folder
mkdir -p grafana/grafana-storage
chmod 777 grafana-storage

# Create Alertmanager folder, rule folder and collected device information folder
mkdir alert rules targets
Write docker compose file
Write docker compose file and run the monitoring alarm platform; Under the monitor folder, create a new monitor docker compose YML configuration file, refer to the following for details (the port in the configuration file is the default and can be modified and tested according to requirements):
version: '3.2'
services:
  prometheus:
    image: prom/prometheus
    restart: "always"
    ports:
      - 9090:9090
    container_name: "prometheus"
    volumes:
      - "./prometheus/prometheus.yml:/etc/prometheus/prometheus.yml"
      - "./rules:/etc/prometheus/rules"
      - "./prometheus/data:/prometheus"
      - "./targets:/etc/prometheus/targets"
    command:
      - '--config.file=/etc/prometheus/prometheus.yml'
      - '--storage.tsdb.path=/prometheus'

  alertmanager:
    image: prom/alertmanager:latest
    restart: "always"
    ports:
      - 9093:9093
    container_name: "alertmanager"
    volumes:
      - "./alert/alertmanager.yml:/etc/alertmanager/alertmanager.yml"
      - "./alert/template/:/etc/alertmanager/template/"

  grafana:
    image: grafana/grafana
    restart: "always"
    ports:
      - 3000:3000
    container_name: "grafana"
    volumes:
      - "./grafana/grafana-storage:/var/lib/grafana"
Build prometheus configuration file
Create a new profile prometheus. In the prometheus folder YML, the specific configuration is as follows:
global:
  scrape_interval:     15s    # How often are data collected
  evaluation_interval: 15s    # How often are the rules evaluated
  scrape_timeout:      10s    # Timeout for each data collection

scrape_configs:
  - job_name: prometheus
    static_configs:
      - targets: ['192.168.3.10:9090']
        labels:
          instance: prometheus

# Here is the monitored node information. This file will be mentioned below
  - job_name: node
    file_sd_configs:
      - files:
          - ./targets/*.yml
        refresh_interval: 10s

alerting:
  alertmanagers:
  - static_configs:
    - targets:
      - 192.168.3.10:9093
# The following is the alarm rule file
rule_files:
  - "/etc/prometheus/rules/*.yml"
Build Altermanager configuration file
The test alarm here is sent to the enterprise wechat. Altermanager also supports sending nails, emails, etc. For details, please refer to Official website link
global:
  resolve_timeout: 1m
  wechat_api_url: 'https://qyapi.weixin.qq.com/cgi-bin/'
  wechat_api_corp_id: 'Enterprise wechat secret key'
  wechat_api_secret: 'Application key'
route:
  receiver: 'monitor_node'
  group_wait: 30s
  group_interval: 5m
  repeat_interval: 5m
  group_by: [alertname]
  routes:
  - receiver: 'monitor_node'
    group_wait: 10s
templates:
  - "template/*.tmpl"

receivers:
- name: 'monitor_node'
  wechat_configs:
  - send_resolved: true
    message: '{{ template "wechat.default.message" . }}'
    to_party: 'id_num' # Department ID of robot
    agent_id: 'application ID'     # ID of the application created in enterprise wechat
    api_secret: 'Application key'      # In enterprise wechat, the Secret of application
Install node exporter on the monitored node
The following compressed packages can also be installed by docker and docker compose:
# Compressed package installation
wget https://github.com/prometheus/node_exporter/releases/download/v1.2.2/node_exporter-1.2.2.linux-amd64.tar.gz

# Write service
[Unit]
Description=node_exporter
After=network.target
[Service]
Type=simple
ExecStart=  /xxx/node_exporter  # Node exporter directory
PrivateTmp=true
RestartSec=5
StartLimitInterval=0
Restart=always
[Install]
WantedBy=multi-user.target

# Overload configuration
systemctl daemon-reload
Monitored node targets configuration
File is used here_ sd_ Collect the monitored node exporter in configs mode. Refer to other methods Official documents ; There are many ways to follow the specific business environment for reference;
Create a new node in the targets folder YML, the reference configuration is as follows:
- targets: ['192.168.3.11:9100']
  labels:
    instance: vm01
 - targets: ['192.168.3.12:9100']
  labels:
    instance: vm02
 - targets: ['192.168.3.13:9100']
  labels:
    instance: vm03
Alarm rule configuration
This article mainly provides the implementation test of monitoring mapping alarm, non production environment; Specific alarm rules can be configured in combination with the actual environment;
Put the rule configuration file in the rules folder and name it * yml corresponds to the configuration item in prometheus.
For details, please refer to Official configuration
Here is a part of my test rules configuration reference:
groups:
  - name: node-alert
    rules:
    - alert: node-down
      expr: prometheus:up == 0
      for: 1m
      labels:
        severity: 'critical'
      annotations:
        summary: "instance: {{ $labels.instance }} Downtime "
        description: "instance: {{ $labels.instance }} \n- job: {{ $labels.job }} Downtime "
        value: "{{ $value }}"
        instance: "{{ $labels.instance }}"


    - alert: node-cpu-high
      expr:  prometheus:cpu:total:percent > 80
      for: 3m
      labels:
        severity: info
      annotations:
        summary: "instance: {{ $labels.instance }} cpu Utilization rate higher than {{ $value }}"
        description: "instance: {{ $labels.instance }} \n- job: {{ $labels.job }} CPU The utilization rate continues to be higher than 80%% . "
        value: "{{ $value }}"
        instance: "{{ $labels.instance }}"

    - alert: node-cpu-iowait-high
      expr:  prometheus:cpu:iowait:percent >= 12
      for: 3m
      labels:
        severity: info
      annotations:
        summary: "instance: {{ $labels.instance }} cpu iowait higher than {{ $value }}"
        description: "instance: {{ $labels.instance }} \n- job: {{ $labels.job }} cpu iowait Continuously higher than 12%"
        value: "{{ $value }}"
        instance: "{{ $labels.instance }}"
Run test environment
# Run under the monitor folder
docker-compose -f monitor-docker-compose.yml up -d
# docker ps check the status of three containers: prometheus, Altermanager and Grafana
# Log in to the Grafana management page on the web and configure the dashboard
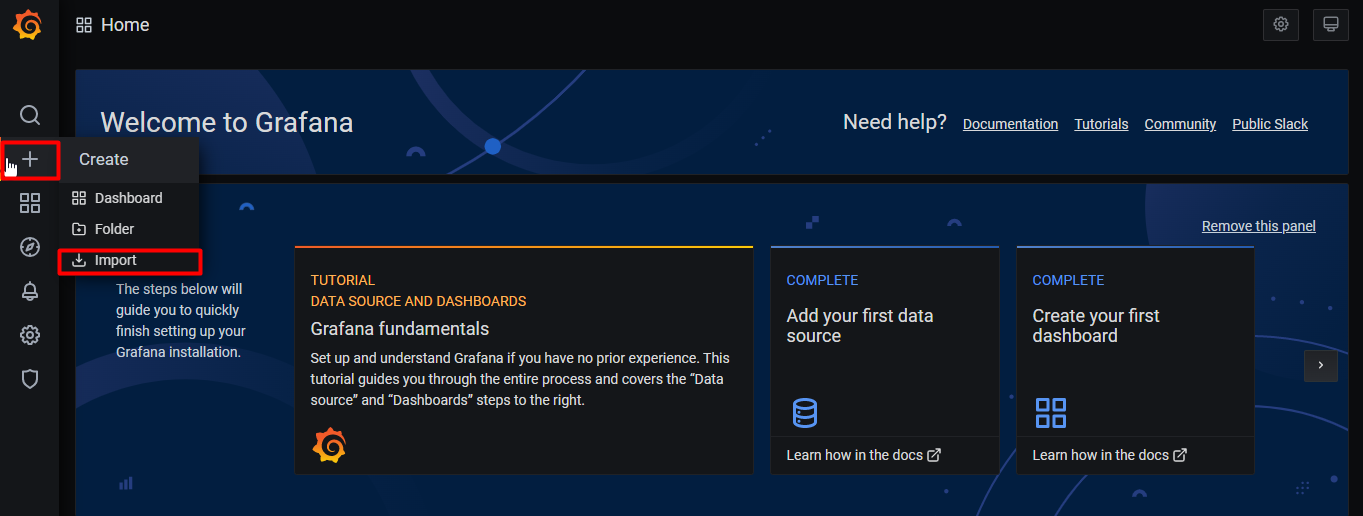
After the running environment test is normal, you can continue to test the alarm silence and other functions on the Altermanager management page. Refer to the following figure for the import location of Grafana instrument panel:
The Grafana instrument cluster is available in Official documents find
Hover over + the upper edge and select Import
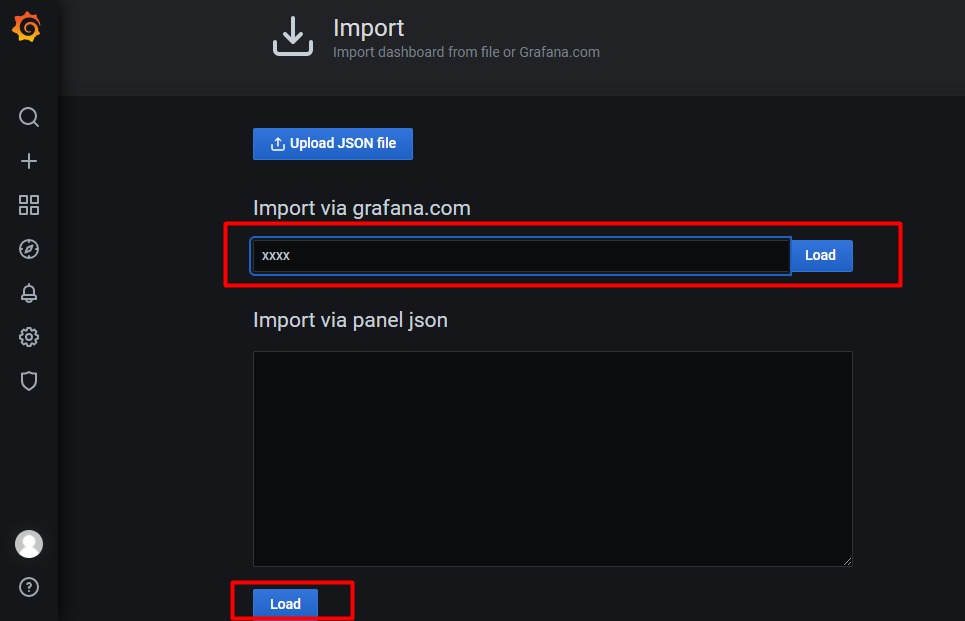
Fill in the dashboard id found on the official website and Load it.
END
- You can check the official documents before troubleshooting, and the learning content is rich
- Test each step and narrow the scope of troubleshooting
- Welcome to exchange and correct~~