1: Background
1. Tell a story
A few days ago, a friend jia wx said that his program encountered a surge in memory. How to analyze it for help?

After chatting with this friend, this dump is also taken from an HIS system. As my friend said, I'm really tied up with the hospital 🤣🤣🤣, It's good to save some resources for yourself 😁😁😁, All right, stop talking and talk to windbg.
2: windbg analysis
1. Managed or unmanaged?
Since the memory is skyrocketing, let's see how big the commit memory of the current process is?
0:000> !address -summary

--- State Summary ---------------- RgnCount ----------- Total Size -------- %ofBusy %ofTotal
MEM_FREE                                174     7ffe`baac0000 ( 127.995 TB)          100.00%
MEM_COMMIT                             1153        1`33bd3000 (   4.808 GB)  94.59%    0.00%
MEM_RESERVE                             221        0`1195d000 ( 281.363 MB)   5.41%    0.00%
You can see that it accounts for about 4.8G. Next, let's look at the managed heap memory.
0:000> !eeheap -gc
Number of GC Heaps: 1
generation 0 starts at 0x00000207a4fc48c8
generation 1 starts at 0x00000207a3dc3138
generation 2 starts at 0x0000020697fc1000
ephemeral segment allocation context: none
------------------------------
GC Heap Size:            Size: 0x1241b3858 (4900730968) bytes.
It can be seen from the last line that the managed heap occupies 4900730968/1024/1024/1024=4.5G. When the two indicators are compared, it turns out that there is a problem with the managed memory. It's easy to do now...
2. View managed heap
Since the memory is eaten by the managed heap, let's see what's on the managed heap???
0:000> !dumpheap -stat
Statistics:
              MT    Count    TotalSize Class Name
...
00007ffd00397b98  1065873    102323808 System.Data.DataRow
00000206978b8250  1507805    223310768      Free
00007ffd20d216b8  4668930    364025578 System.String
00007ffd20d22aa8      797    403971664 System.String[]
00007ffd20d193d0   406282   3399800382 System.Byte[]
Total 9442152 objects
I don't know if I don't see it. I'm surprised at it Byte [] takes up almost 3.3 G of memory, which means that it almost eats up the gc heap. According to experience, there must be a big object. How to analyze it next? In addition to the violence grouping statistics of byte [] with script, is there any other skill of pure human flesh? Of course, you can use it! heapstat observes the generation information of these objects on the managed heap.
0:000> !heapstat
Heap             Gen0         Gen1         Gen2          LOH
Heap0         2252000     18880400   3968704192    910894376

Free space:                                                 Percentage
Heap0           43128       770160    185203264     39849984SOH:  4% LOH:  4%
As can be seen from the figure, the current header is on Gen2. Next, you can use eeheap -gc to find the segment address range of Gen2, so as to minimize the content on the heap.
0:000> !eeheap -gc
Number of GC Heaps: 1
generation 0 starts at 0x00000207a4fc48c8
generation 1 starts at 0x00000207a3dc3138
generation 2 starts at 0x0000020697fc1000
ephemeral segment allocation context: none
         segment             begin         allocated              size
0000020697fc0000  0000020697fc1000  00000206a7fbec48  0xfffdc48(268426312)
00000206bbeb0000  00000206bbeb1000  00000206cbeaef50  0xfffdf50(268427088)
00000206ccc40000  00000206ccc41000  00000206dcc3f668  0xfffe668(268428904)
00000206dcc40000  00000206dcc41000  00000206ecc3f098  0xfffe098(268427416)
0000020680000000  0000020680001000  000002068ffff8c0  0xfffe8c0(268429504)
00000206ff4d0000  00000206ff4d1000  000002070f4cf588  0xfffe588(268428680)
000002070f4d0000  000002070f4d1000  000002071f4cf9f0  0xfffe9f0(268429808)
000002071f4d0000  000002071f4d1000  000002072f4cfef0  0xfffeef0(268431088)
000002072f4d0000  000002072f4d1000  000002073f4cf748  0xfffe748(268429128)
000002073f4d0000  000002073f4d1000  000002074f4ce900  0xfffd900(268425472)
00000207574d0000  00000207574d1000  00000207674cfe70  0xfffee70(268430960)
00000207674d0000  00000207674d1000  00000207774ceaf8  0xfffdaf8(268425976)
00000207774d0000  00000207774d1000  00000207874cf270  0xfffe270(268427888)
00000207874d0000  00000207874d1000  00000207974cf7a8  0xfffe7a8(268429224)
00000207974d0000  00000207974d1000  00000207a51ea5a8  0xdd195a8(231839144)
Generally speaking, the first segment is for gen0 + gen1, and the subsequent segment is gen2. Next, I choose segment: 0000026dcc41000 - 0000026ecc3f098, and then use it! dumpheap exports all objects in the interval.
0:000> !dumpheap -stat 00000206dcc41000 00000206ecc3f098
Statistics:
              MT    Count    TotalSize Class Name
00007ffd00397b98   191803     18413088 System.Data.DataRow
00007ffd20d216b8   662179     37834152 System.String
00007ffd20d193d0    23115    187896401 System.Byte[]
From this memory segment, there are 2.3w bytes [], not too many. dump them all to see what features they have.
0:000> !dumpheap -mt 00007ffd20d193d0 00000206dcc41000 00000206ecc3f098
         Address               MT     Size
00000206dcc410e8 00007ffd20d193d0     8232
00000206dcc43588 00007ffd20d193d0     8232
00000206dcc45a48 00007ffd20d193d0     8232
00000206dcc47d78 00007ffd20d193d0     8232
00000206dcc4a028 00007ffd20d193d0     8232
00000206dcc4c4b0 00007ffd20d193d0     8232
00000206dcc4eb08 00007ffd20d193d0     8232
00000206dcc50e88 00007ffd20d193d0     8232
00000206dcc535b0 00007ffd20d193d0     8232
00000206dcc575d8 00007ffd20d193d0     8232
00000206dcc5a5a8 00007ffd20d193d0     8232
00000206dcc5cbf8 00007ffd20d193d0     8232
00000206dcc5eef8 00007ffd20d193d0     8232
00000206dcc611f8 00007ffd20d193d0     8232
00000206dcc634e8 00007ffd20d193d0     8232
00000206dcc657f0 00007ffd20d193d0     8232
00000206dcc67af8 00007ffd20d193d0     8232
00000206dcc69e00 00007ffd20d193d0     8232
...
I'll go. 99% of them are 8232byte s. Originally, they are 8k byte arrays. Who is using it? Use it! gcroot check the reference root.
0:000> !gcroot 00000206dcc410e8
Thread 8c1c:
        rsi:
            ->  00000206983d5730 System.ServiceProcess.ServiceBase[]
                ...
            ->  000002069dcb6d38 OracleInternal.ConnectionPool.OraclePool
                ...
            ->  000002069dc949c0 OracleInternal.TTC.OraBufReader
            ->  000002069dc94a70 System.Collections.Generic.List`1[[OracleInternal.Network.OraBuf, Oracle.ManagedDataAccess]]
            ->  00000206ab8c2200 OracleInternal.Network.OraBuf[]
            ->  00000206dcc41018 OracleInternal.Network.OraBuf
            ->  00000206dcc410e8 System.Byte[]
Judging from the reference chain, it seems to be used by oracleinternal Network. Orabuf [] holds it. I wonder if a bug in Oracle Sdk broke the memory? Here comes curiosity. What are the number and size of elements?
0:000> !do 00000206ab8c2200
Name:        OracleInternal.Network.OraBuf[]
MethodTable: 00007ffcc7833c68
EEClass:     00007ffd20757728
Size:        4194328(0x400018) bytes
Array:       Rank 1, Number of elements 524288, Type CLASS (Print Array)
Fields:
None

0:000> !objsize 00000206ab8c2200
sizeof(00000206ab8c2200) = -1086824024 (0xbf3861a8) bytes (OracleInternal.Network.OraBuf[])
The current array has 52w, and the totalsize is directly negative 😓.
3. Find the problem code
After knowing the phenomenon, use ILSpy to decompile the Oracle SDK, and finally compare it, as shown in the figure below:
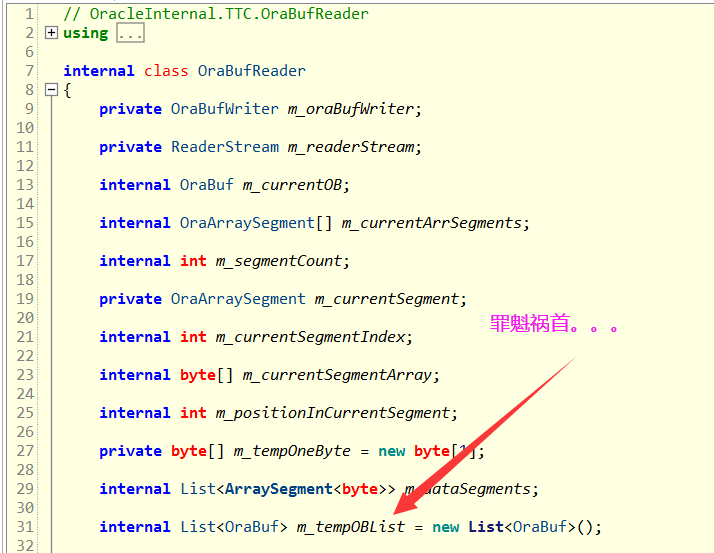
Original m_tempOBList is the culprit of the memory explosion, which is very embarrassing. Why did it soar? Why not release? Because I'm not familiar with Oracle, I can only turn to the magical StackOverflow. When I go, there are really people in the end of the world, Huge managed memory allocation when reading (iterating) data with DbDataReader
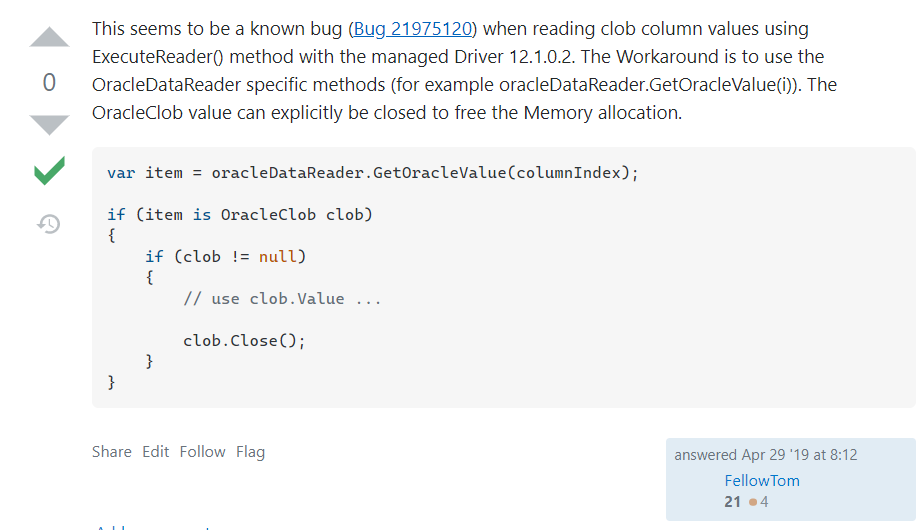
This phenomenon is probably caused by a bug in the Oracle SDK when reading Clob type fields. The solution is also very simple. Release it after use. See the following figure for details:
4. Find the truth
Since the post says that there is a problem in reading Clob type, call out all thread stacks to see if there is Clob in the thread stack at this time?
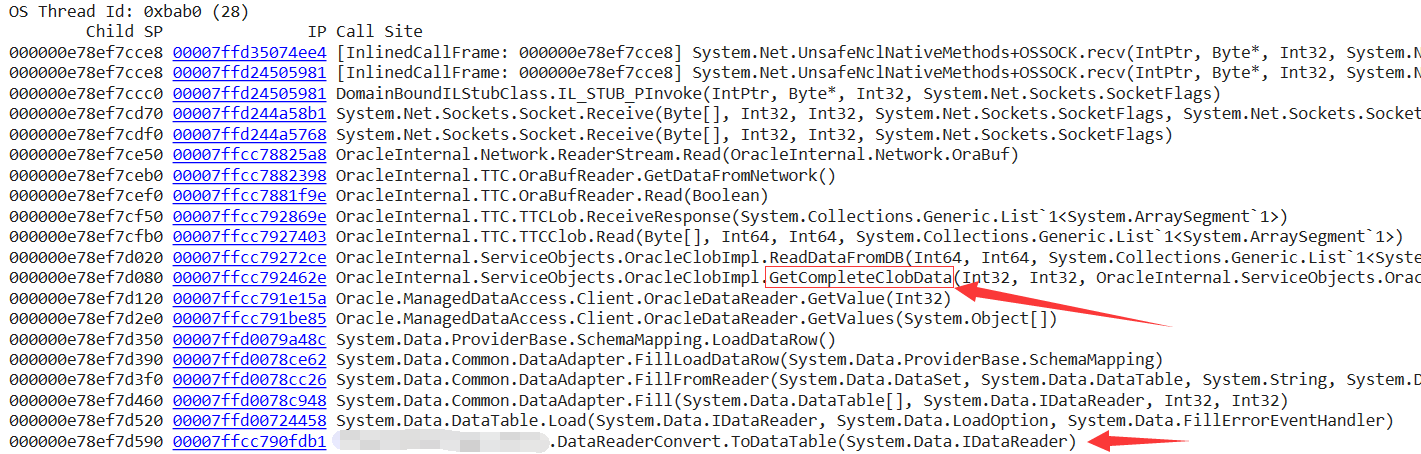
From the thread stack, the code converts IDataReader into DataTable through ToDataTable method. When large fields are read in the conversion process, GetCompleteClobData will naturally exist, that is to say, in order to make the conclusion more accurate, I will dig out how many lines the current DataReader has read?
0:028> !clrstack -a
OS Thread Id: 0xbab0 (28)
000000e78ef7d520 00007ffd00724458 System.Data.DataTable.Load(System.Data.IDataReader, System.Data.LoadOption, System.Data.FillErrorEventHandler)
    PARAMETERS:
        this = <no data>
        reader (<CLR reg>) = 0x00000206a530ac20
        loadOption = <no data>
        errorHandler = <no data>
0:028> !do 0x00000206a530ac20
Name:        Oracle.ManagedDataAccess.Client.OracleDataReader
MethodTable: 00007ffcc7933b10
EEClass:     00007ffcc78efd30
Size:        256(0x100) bytes
File:        D:\xxx.dll
Fields:
00007ffd20d23e98  4000337       d0         System.Int32  1 instance          1061652 m_RowNumber
From M_ According to rownumber, 106w rows have been read. It is not common to read 100w + records at one time. If there are large fields, it is the same 🐂👃 Yes.
3: Summary
To sum up, the accident was caused by reading the million level data containing large fields to DataTable at one time. The solution is very simple. Read the DataReader through for and release it immediately after processing the OracleClob type. Refer to the post code:
var item = oracleDataReader.GetOracleValue(columnIndex);

if (item is OracleClob clob)
{
    if (clob != null)
    {
        // use clob.Value ...

        clob.Close();
    }
}
More high quality dry goods: see my GitHub: dotnetfly