1, Preface overview and basic theory
1.1 ELK system introduction
- ELK log analysis system is composed of Elasticsearch, Logstash and Kibana
- Elasticsearch: open source distributed search engine. Features: distributed, zero configuration, automatic discovery, automatic index fragmentation, index copy mechanism, restful style interface, multiple data sources, automatic search load, etc
- Logstash: it is a completely open source tool that can collect and filter our logs. And store it for later use
- Kibana: it's also an open source and free tool. Kibana can provide a friendly log analysis Web interface for Logstash and Elasticsearch, which can help us summarize, analyze and search important data logs
1.2 working principle of elk log
- Log stash collects the logs generated by the AppServer and stores them in the Elastic Search cluster, while Kibana queries the data from the ES cluster, generates charts, and then returns them to the Browser.
- To put it simply, you need to go through the following steps
- 1. Centralized log management (beats)
- beats includes the following four tools
- ①. Packetbeat (collect network traffic data)
- ②. Topbeat (collects data on CPU and memory usage at the system, process, and file system levels)
- ③. Filebeat (collect file data)
- ④. Winlogbeat (collect Windows event log data)
- 2. Format the log (logstash)
- 3. Index and store the formatted data (elastic search)
- 4. Display of front-end data (Kibana)
1.3 detailed introduction of elasticsearch, Logstash and Kibana
1.3.1 Elasticsearch
- Elasticsearch is a lucene based search server. It provides a distributed multi-user full-text search index based on RESTFUL Web interface
- Elasticsearch is developed in Java and released as an open source under the Apache license terms. It is the second most popular enterprise search engine. Designed for cloud computing, it can achieve real-time search, stable, reliable, fast, easy to install and use
- At present, GITHUB and Baidu search engines have been introduced as ES search engines
- Basic and core concepts of Elasticsearch
- 1. Near real time (NRT)
- Elasticsearch is a near real-time search platform. This means that there is a slight delay (usually 1 second) from indexing a document until the document can be searched
- 2. Cluster
- A cluster is organized by one or more nodes. They jointly hold the data of the whole cluster and provide indexing and search functions together. One of the nodes is the main node, which can be elected, and provides the function of cross node joint index and search. The cluster has a unique name. The default is (elastic search)
- The cluster name is very important. Each node is added to its cluster based on the cluster name. Therefore, you need to ensure that different cluster names are used in different environments
- A cluster can have only one node. It is recommended to configure Elasticsearch in cluster mode
- es has a cluster mechanism. Nodes join the cluster through the cluster name. At the same time, nodes in the cluster will have their own unique identity (their own name)
- 3. node
- A node is a single server, which is a part of the cluster. It stores data and participates in the index and search functions of the cluster.
- Like clusters, nodes are identified by name. The default is the character name randomly assigned when the node starts. You can also define it yourself. This name is very important and is used to identify the node corresponding to the server in the cluster
- Nodes can join the cluster by specifying the cluster name. By default, each node is set to join the Elasticsearch cluster. If multiple nodes are started and can automatically discover each other, they will automatically form a cluster called Elasticsearch
- 4. index
- An index is a collection of documents with somewhat similar characteristics. For example, you can have an index of customer data, another index of product catalog, and an index of order data. An index is identified by a name (which must be all lowercase letters), and we should use this name when we want to index, search, update and delete the corresponding documents in this index
- Any number of indexes can be defined in a cluster
- The index is equivalent to the database of relational database
- 5. type
- One or more types can be defined in an index
- Type is actually a logical classification or partition of your index. Its semantics is entirely up to you. Typically, a type is defined for a document that has a common set of fields. For example, suppose you run a forum and store all your data in an index. In this index, you can define one type for user data, another type for forum data, or another type for comment data
- The type is equivalent to the table of relational database
- 6. document
- A document is a basic information unit that can be indexed. For example, you can have a user's document, a product's document, or an order's document,
- Documents are represented by JSON (Javascript Object Notation), which is a ubiquitous format for Internet data interaction
- A document must be indexed within an index or assigned a type
- A document is equivalent to a column in a relational database
- 7. Shards & replicas
- In practice, the data stored in the index may exceed the hardware limit of a single node. For example, a 1 billion document needs 1TB of space, which may not be suitable for storage on the disk of a single node, or the search request from a single node is too slow. Therefore, in order to solve this problem, elastic search provides the function of dividing the index into multiple slices. When creating an index, you can define the number of slices you want to slice.
- Each partition is a fully functional independent index, which can be located on any node in the cluster
- There are two main reasons for the existence of fragmentation: ① Horizontally split and expand to increase the storage capacity. ②. Distributed parallel cross slice operation to improve performance and throughput.
- The mechanism of distributed fragmentation and how to summarize the documents of search requests are completely controlled by elastic search, and these controls are transparent to users
- Because of the existence of network problems and other problems. Therefore, in order to improve robustness, it is recommended to have a failover mechanism. In this way, fragmentation or node unavailability can be prevented in case of failure. To this end, Elasticsearch lets us slice the index into one or more copies, which are called multi flat copies or copies
- There are two main reasons for the existence of copies: ① High availability to deal with fragmentation or node failure. Therefore, the fragmented copy should be on different nodes. ②. High performance, increased throughput, search can be performed on all replicas in parallel
- In short, each index can be partitioned into multiple partitions. An index can also be copied 0 times and many times. Once replicated, each index is distinguished from the primary shard (the original shard as the replication source) and the replication shard (the copy of the primary shard). The number of slices and copies can be specified when the index is created. After the index is created, the number of copies can be changed dynamically at any time, but the number of fragments cannot be changed
- By default, each index in Elasticsearch is partitioned into five primary partitions and one copy. This also means that the cluster China must have at least two nodes, and the index will have five primary partitions and five replica partitions (one full copy). In this way, each index will have a total of 10 partitions
1.3.2 Logstash
- Logstash is a simple message based architecture written in JRuby language and runs on the Java virtual machine (JVM)
- Different from the separate agent or Server, Logstash can configure a single agent to combine with its open source software to realize different functions
- Because Logstash only does three things, its concept is very simple
- 1.Collect: data input (Collection)
- 2.Enrich: data processing (such as filtering, rewriting, etc.)
- 3.Transport: data output (called by other modules)
- Main components of Logstash
- 1.Shipper: log collector. Be responsible for monitoring the changes of local log files and collecting the latest contents of log files in time. Usually, the remote agent only needs to run this component
- 2.Indexer: log storer. Responsible for receiving logs and writing them to local files
- 3.Broker: log Hub. Responsible for connecting multiple shippers and indexers
- 4.Search and Storage: allows searching and storage of events
- 5.Web Interface: Web-based display interface
- Because the above components can be deployed independently in logstash, logstash provides better cluster scalability
- Logstash host classification
- 1. agent host: as the shipper of events, it sends various log data to the central host. Just run the Logstash agent.
- 2. central host: it can run various components including Broker, Indexer, Search and Storage and Web Interface. So as to realize the receiving, processing and storage of log data
1.3.3 Kibana
- Kibana is an open source analysis and visualization platform for Elasticsearch. It is used to search and view data stored in Elasticsearch index interactively
- Kibana can be used for advanced data analysis and display through various charts. Kibana makes massive data easier to understand
- Kibana is easy to operate. The browser based user interface can quickly create a dashboard to display Elasticsearch query dynamics in real time
- Setting up kibana is also very simple. No need to write code. Kibana installation can be completed in a few minutes and Elasticsearch index detection can be started
- Main functions of Kibana
- 1.Kibana architecture is customized for Elasticsearch, and any structured and unstructured data can be added to Elasticsearch index. Kibana also makes full use of Elasticsearch's powerful search and analysis capabilities
- 2. Integrate data. Kibana can better handle massive data and create column charts, line charts, scatter charts, histograms, pie charts and maps
- 3. Complex data analysis. Kibana improves Elasticsearch's analysis capabilities, enabling it to analyze data more intelligently, perform mathematical transformations, and cut and block data according to requirements
- 4. Benefit more team members. The powerful database visualization interface enables all business posts to benefit from the data set
- 5. Flexible interface and easier sharing. Kibana makes it easier to create, save, share data, and quickly communicate visual data
- 6. Simple configuration. Kibana is very simple to configure and enable, and the user experience is very friendly. Kibana comes with its own Web server, which can start and run quickly
- 7. Visualize multiple data sources. Kibana can easily integrate data from Logstash, ES Hadoop, Beats or third-party technologies into Elasticsearch. Supported third-party technologies include Apache Flume, fluent, etc
- 8. Data export is simple. Kibana can easily export the data of interest, quickly model and analyze after fusion with its data set, and find new results
2, Construction of ELK log analysis system
- Configure and install ELK log analysis system, install cluster mode, two Elasticsearch nodes, and monitor apache server logs
2.1 experimental environment
| host | operating system | host name | IP address | Main software |
|---|
| The server | CentOS7.4 | Node1 | 192.168.131.10 | Elasticsearch and Kibana |
| The server | CentOS7.4 | Node2 | 192.168.131.11 | Elasticsearch |
| The server | CentOS7.4 | Apache | 192.168.131.12 | Logstash Apache |
| test machine | Native (Win10) | take-easy | 192.168.1.50 | Google browser |
2.2 deploy Elasticsearch software (both node1 and node2 need to be deployed)
- Configure domain name resolution and modify java version
[Two sets node All nodes write hosts Documents. node1 and node2 of IP And corresponding host name]
[root@node1 /]# vim /etc/hosts

127.0.0.1   localhost localhost.localdomain localhost4 localhost4.localdomain4
127.0.0.1   localhost localhost.localdomain localhost4 localhost4.localdomain4
::1         localhost localhost.localdomain localhost6 localhost6.localdomain6
192.168.131.10 node1
192.168.131.10 node2

[root@node1 /]# java -version
openjdk version "1.8.0_131"
OpenJDK Runtime Environment (build 1.8.0_131-b12)
OpenJDK 64-Bit Server VM (build 25.131-b12, mixed mode)
[root@node1 local]# rz -E
rz waiting to receive.
[root@node1 local]# tar zxvf jdk-8u91-linux-x64.tar.gz
[root@node1 local]# ls
bin  etc  games  include  jdk1.8.0_91  jdk-8u91-linux-x64.tar.gz  lib  lib64  libexec  sbin  share  src


[root@node1 local]# vim /etc/profile
export JAVA_HOME=/usr/local/jdk1.8.0_91
export JRE_HOME=${JAVA_HOME}/jre
export CLASSPATH=.:${JAVA_HOME}/lib:${JRE_HOME}/lib

[Redefine the environment variables, $PATH Be sure to put it in $JAVA_HOME Later, let the system read the version information in the working directory first]
export PATH=${JAVA_HOME}/bin:$PATH


[root@node1 local]# source /etc/profile
[root@node1 local]# java -version
java version "1.8.0_91"
Java(TM) SE Runtime Environment (build 1.8.0_91-b14)
Java HotSpot(TM) 64-Bit Server VM (build 25.91-b14, mixed mode)
- Install elasticsearch RPM package
[root@localhost opt]# hostnamectl set-hostname node1
[root@localhost opt]# su
[root@node1 opt]# systemctl stop firewalld.service
[root@node1 opt]# setenforce 0
[root@node1 opt]# systemctl disable firewalld.service
[root@node1 opt]# rz -E
rz waiting to receive.
[root@node1t opt]# ls
elasticsearch-5.5.0.rpm  rh
[root@node1 opt]# rpm -ivh elasticsearch-5.5.0.rpm
[root@node1 opt]# systemctl daemon-reload
[root@node1 opt]# systemctl enable elasticsearch.service
Created symlink from /etc/systemd/system/multi-user.target.wants/elasticsearch.service to /usr/lib/systemd/system/elasticsearch.service.
- Change elasticsearch master profile
[Uncomment the following configuration files and modify them accordingly]
[root@node1 opt]# vim /etc/elasticsearch/elasticsearch.yml
 17 cluster.name: my-elk-cluster                         [Modify the cluster name to my-elk-cluster]
 23 node.name: node1                                     [Modify the node name as node1. node2 The host is modified to node2]
 33 path.data: /data/elk_data                            [[modify data storage path]
 37 path.logs: /var/log/elasticsearch/                   [Modify log storage path]
 43 bootstrap.memory_lock: false
 [Lock the physical memory address to prevent es Memory is swapped out, which is to avoid es use swap Swap partitions. Because frequent exchanges can lead to IOPS Higher (performance test: reads and writes per second)]
 55 network.host: 0.0.0.0                                [Providing service binding IP Address, 0.0.0.0 For all addresses]
 59 http.port: 9200                                      [Listening port is 9200]
 68 discovery.zen.ping.unicast.hosts: ["node1", "node2"] [Discover clusters by unicast]
 [root@node1 opt]# grep -v "^#"/ etc/elasticsearch/elasticsearch.yml [filter and view information]
cluster.name: my-elk-cluster
node.name: node1
path.data: /data/elk_data
path.logs: /var/log/elasticsearch/
bootstrap.memory_lock: false
network.host: 0.0.0.0
http.port: 9200
discovery.zen.ping.unicast.hosts: ["node1", "node2"]
- Create data storage path and authorize
[root@node1 opt]# mkdir -p /data/elk_data
[root@node1 opt]# chown elasticsearch:elasticsearch /data/elk_data/
- Start elasticsearch successfully
[root@node1 opt]# systemctl start elasticsearch.service
[root@node1 opt]# netstat -natp | grep 9200
tcp6       0      0 :::9200                 :::*                    LISTEN      5512/java
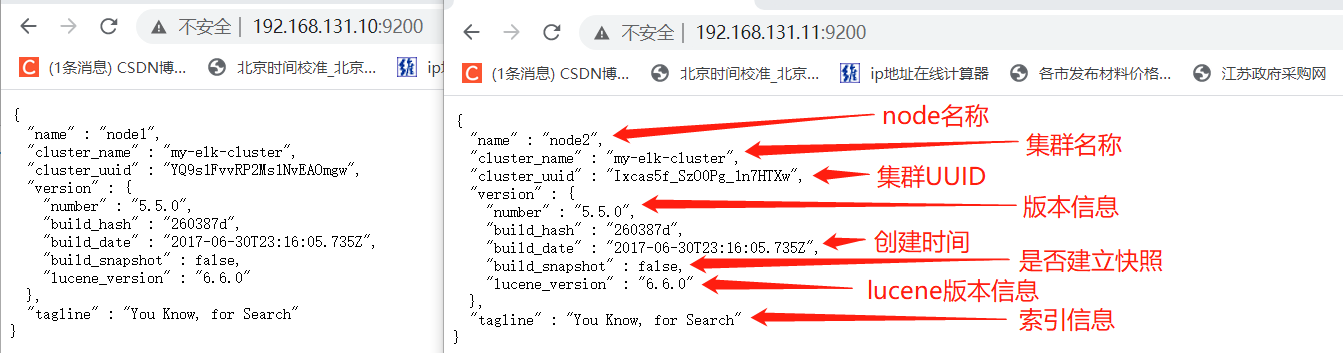
- Open with native browser http://192.168.131.10:9200/ and http://192.168.131.11:9200/ View node information
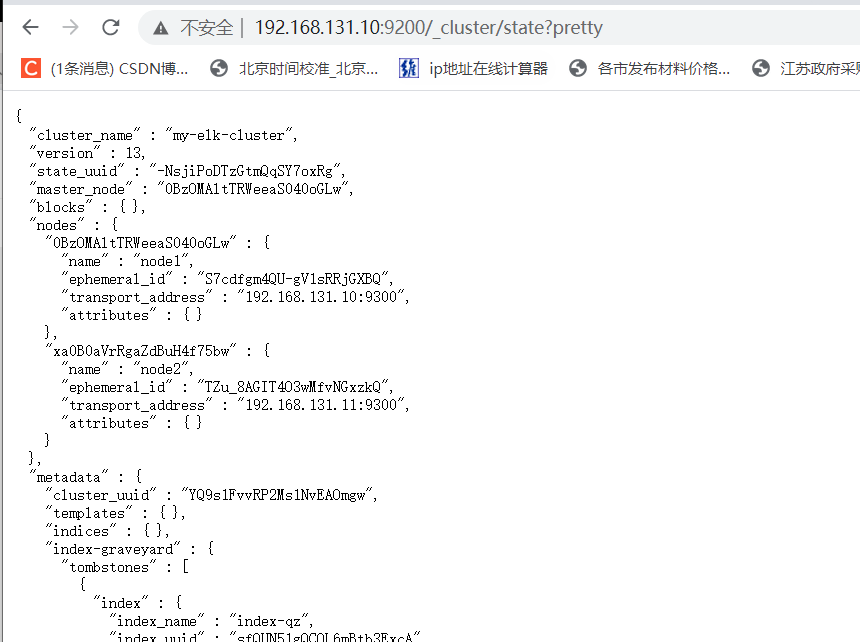
- Open with native browser http://192.168.131.10:9200/_cluster/state?pretty View cluster status information
2.3 install elasticsearch head plug-in (data visualization tool)
- Because the above way of viewing clusters is inconvenient, we can manage clusters by installing the elastic search head plug-in
- Both node1 and node2 need to be installed, and the steps continue. Only node1 operation configuration is listed here
- First compile and install the node component dependency package (which takes a long time)
[root@node1 opt]# yum install -y gcc gcc-c++ make
[root@node1 opt]# rz -E
rz waiting to receive.
[root@node1 opt]# ls
elasticsearch-5.5.0.rpm  node-v8.2.1.tar.gz  rh
[root@node1 opt]# tar zxvf node-v8.2.1.tar.gz
[root@node1 opt]# cd node-v8.2.1/
[root@node1 node-v8.2.1]# ./configure
[root@node1 node-v8.2.1]# make & make install
- Install phantomjs (front-end Architecture)
[root@node1 /]# cd /usr/local/src/
[root@node1 src]# ls
phantomjs-2.1.1-linux-x86_64.tar.bz2
[root@node1 src]# tar jxvf phantomjs-2.1.1-linux-x86_64.tar.bz2
[root@node1 src]# cd phantomjs-2.1.1-linux-x86_64/bin/
[root@node1 bin]# cp phantomjs /usr/local/bin / [copy the phantomjs executable command to the path environment variable for system identification]
[root@node1 bin]# ls /usr/local/bin/
node  npm  npx  phantomjs
- Install elasticsearch head (data visualization tool)
[root@node1 bin]# cd /usr/local/src/
[root@node1 src]# rz -E
rz waiting to receive.
[root@node1 src]# ls
elasticsearch-head.tar.gz     phantomjs-2.1.1-linux-x86_64.tar.bz2
phantomjs-2.1.1-linux-x86_64
[root@node1 src]# tar zxvf elasticsearch-head.tar.gz
[root@node1 src]# cd elasticsearch-head/
[root@node1 elasticsearch-head]# npm install [this plug-in is developed based on the front end and can be installed directly using npm install]
[Insert directly at the end of the configuration file]
[root@node1 elasticsearch-head]# vim /etc/elasticsearch/elasticsearch.yml
 89 http.cors.enabled: true           [Enable cross domain access support. The default is false]
 90 http.cors.allow-origin: "*"       [[allowed domain names and addresses for cross domain access]
[root@node1 elasticsearch-head]# systemctl restart elasticsearch.service [restart the service after modifying the main configuration file]
- Start elasticsearch head and start the server
[root@node1 elasticsearch-head]# cd /usr/local/src/elasticsearch-head/
[root@node1 elasticsearch-head]# NPM run start & [start the service and work in the background]
[1] 44192
[root@node1 elasticsearch-head]#
> elasticsearch-head@0.0.0 start /usr/local/src/elasticsearch-head
> grunt server

Running "connect:server" (connect) task
Waiting forever...
Started connect web server on http://localhost:9100 [default port 9100]
[Press enter
[root@node1 elasticsearch-head]# netstat -lnupt | grep 9100
tcp        0      0 0.0.0.0:9100            0.0.0.0:*               LISTEN      44202/grunt
[root@node1 elasticsearch-head]# netstat -lnupt | grep 9200
tcp6       0      0 :::9200                 :::*                    LISTEN      44114/java
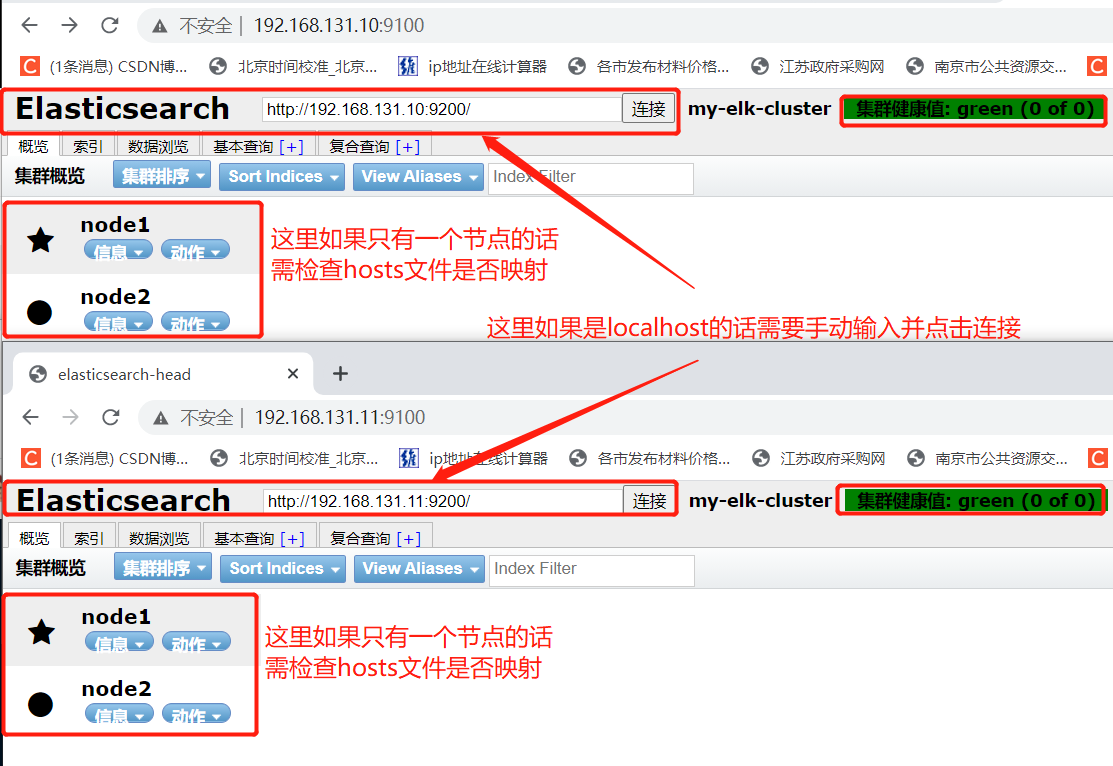
- Open with native browser http://192.168.131.10:9100/ and http://192.168.131.11:9100/ By viewing the node information, you can see that the cluster is healthy and green
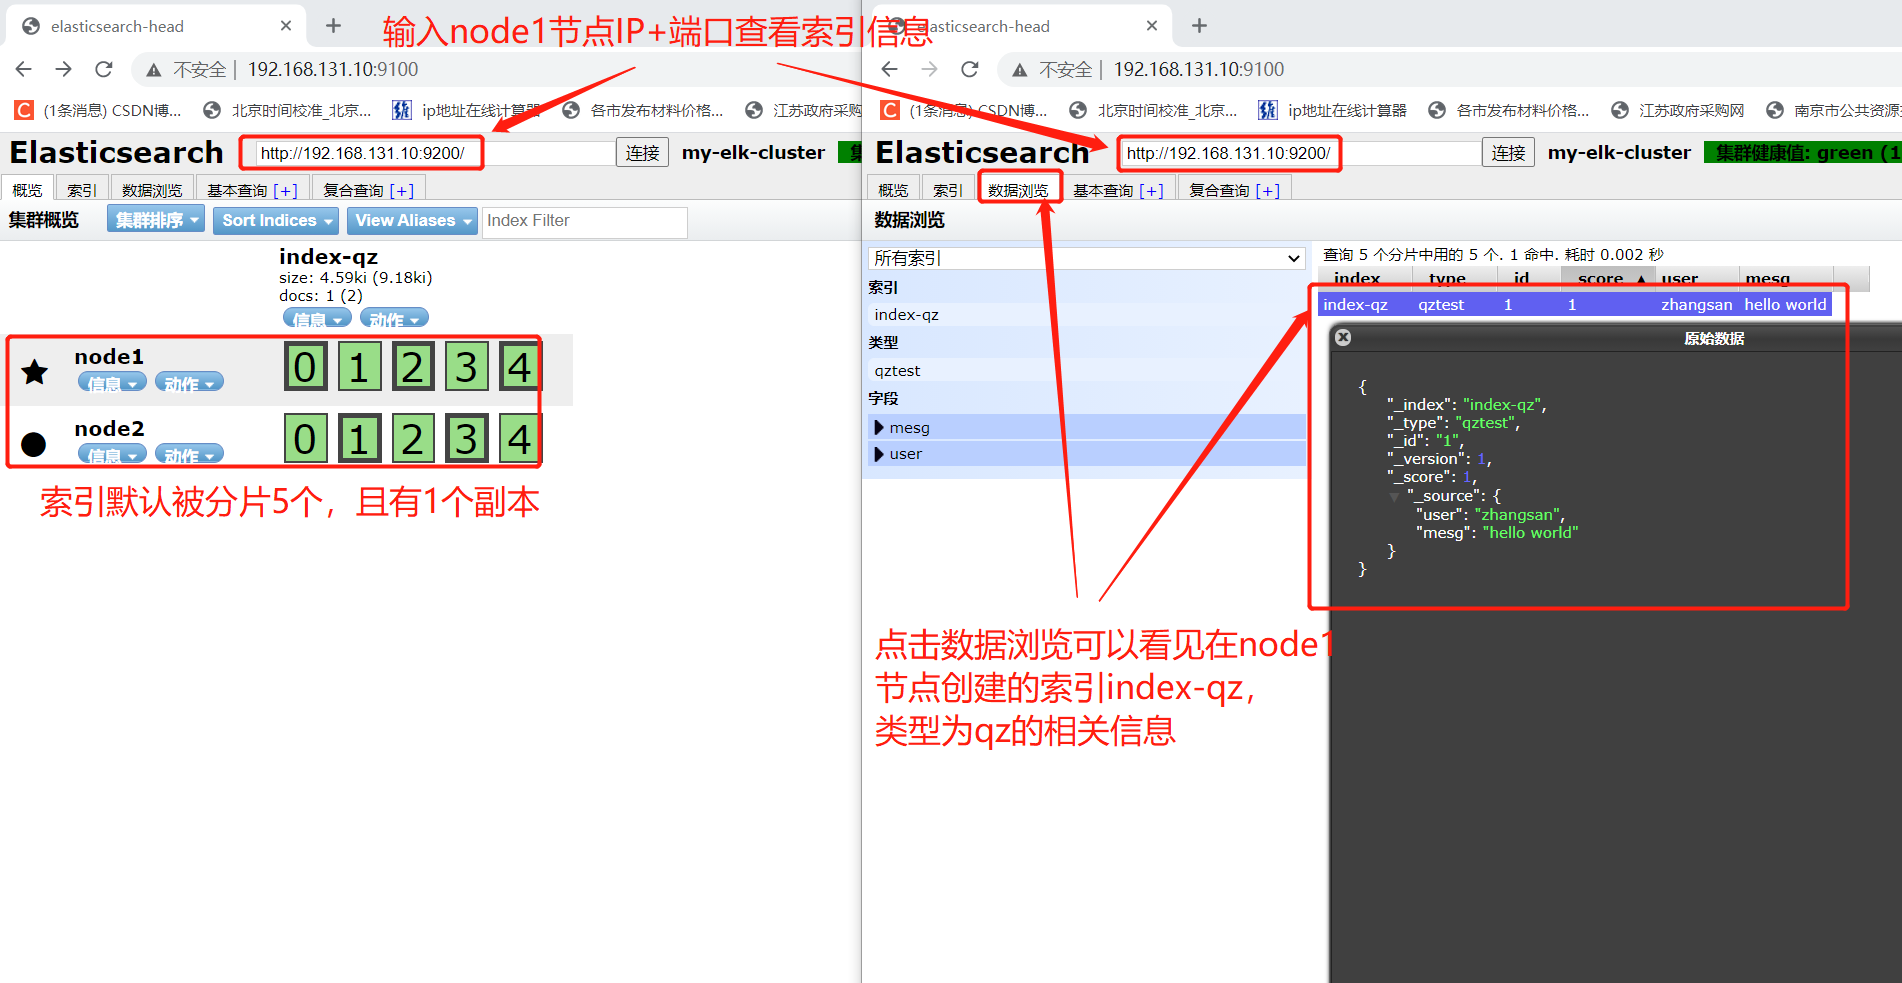
- Create an index named index qz of type qz
[Create a file named index-qz,Type is qz [index of]
[root@node1 local]# curl -XPUT 'localhost:9200/index-qz/qztest/1?pretty&pretty' -H 'content-Type: application/json' -d '{"user":"zhangsan","mesg":"hello world"}'
{
  "_index" : "index-qz",
  "_type" : "qztest",
  "_id" : "1",
  "_version" : 1,
  "result" : "created",
  "_shards" : {
    "total" : 2,
    "successful" : 2,
    "failed" : 0
  },
  "created" : true
}


[The following is additional supplementary knowledge without operation]
[root@node1 local]# curl '192.168.131.10:9200/_cat/indices?v '[view index]
health status index    uuid                   pri rep docs.count docs.deleted store.size pri.store.size
green  open   index-qz sfQUN51gQCOL6mBtb3ExcA   5   1          1            0     16.5kb          8.2kb
[root@node1 local]# Curl - xdelete 192.168.131.10:9200 / index QZ [delete specified index]
[root@node1 local]# Curl - xdelete 192.168.131.10:9200 / index QZ, index QZ1 [delete multiple specified indexes, separated by ","]
[root@node1 local]# curl -XDELETE 192.168.1.4:9200/_all [delete all indexes]
[root@node1 local]# curl -XDELETE 192.168.1.4:9200 / * [delete all indexes]
- Log in to the node1 host at 192.168.131.10, and you can see that the index named index qz and type qz are successfully created
2.4 installation and use of logstash
- Modify the host name and turn off firewall and core protection
[root@localhost ~]# hostnamectl set-hostname apache
[root@localhost ~]# su
[root@apache ~]# systemctl stop firewalld.service
[root@apache ~]# setenforce 0
[root@apache ~]# systemctl disable firewalld.service
- Install and open the Apache service and modify the JAVA version (if there is no JAVA, install using yum)
[root@apache ~]# yum -y install httpd
[root@apache ~]# systemctl start httpd.service


[root@apache /]# java -version
openjdk version "1.8.0_131"
OpenJDK Runtime Environment (build 1.8.0_131-b12)
OpenJDK 64-Bit Server VM (build 25.131-b12, mixed mode)
[root@apache local]# rz -E
rz waiting to receive.
[root@apache local]# tar zxvf jdk-8u91-linux-x64.tar.gz
[root@apache local]# ls
bin  etc  games  include  jdk1.8.0_91  jdk-8u91-linux-x64.tar.gz  lib  lib64  libexec  sbin  share  src


[root@apache local]# vim /etc/profile
export JAVA_HOME=/usr/local/jdk1.8.0_91
export JRE_HOME=${JAVA_HOME}/jre
export CLASSPATH=.:${JAVA_HOME}/lib:${JRE_HOME}/lib

[Redefine the environment variables, $PATH Be sure to put it in $JAVA_HOME Later, let the system read the version information in the working directory first]
export PATH=${JAVA_HOME}/bin:$PATH


[root@apache local]# source /etc/profile
[root@apache local]# java -version
java version "1.8.0_91"
Java(TM) SE Runtime Environment (build 1.8.0_91-b14)
Java HotSpot(TM) 64-Bit Server VM (build 25.91-b14, mixed mode)
[root@apache local]# cd /opt/
[root@apache opt]# rz -E
rz waiting to receive.
[root@apache opt]# ls
logstash-5.5.1.rpm  rh
[root@apache opt]# rpm -ivh logstash-5.5.1.rpm [install logstash]
[root@apache opt]# systemctl start logstash.service [start logstash]
[root@apache opt]# systemctl enable logstash.service [ start logstash ]
[root@apache opt]# ln -s /usr/share/logstash/bin/logstash /usr/local/bin / [create soft link for system identification]
- Butt test whether the functions of logstash (apache) and elastic search (node) are normal, and simply test the standard input and output
| option | explain |
|---|
| -f | You can specify the configuration file of logstash and configure logstash according to the configuration file |
| -e | Followed by a string, which can be used as the configuration of logstash
If yes, stdin is used as input and stdout as output by default |
| -t | Test that the configuration file is correct and exit |
[root@apache opt]# logstash -e 'input { stdin{} } output { stdout{} }'
ERROR StatusLogger No log4j2 configuration file found. Using default configuration: logging only errors to the console.
WARNING: Could not find logstash.yml which is typically located in $LS_HOME/config or /etc/logstash. You can specify the path using --path.settings. Continuing using the defaults
Could not find log4j2 configuration at path //usr/share/logstash/config/log4j2.properties. Using default config which logs to console
14:59:07.056 [main] INFO  logstash.setting.writabledirectory - Creating directory {:setting=>"path.queue", :path=>"/usr/share/logstash/data/queue"}
14:59:07.088 [main] INFO  logstash.setting.writabledirectory - Creating directory {:setting=>"path.dead_letter_queue", :path=>"/usr/share/logstash/data/dead_letter_queue"}
14:59:07.128 [LogStash::Runner] INFO  logstash.agent - No persistent UUID file found. Generating new UUID {:uuid=>"aee76441-5007-44e7-966e-cd58b0529657", :path=>"/usr/share/logstash/data/uuid"}
14:59:07.341 [[main]-pipeline-manager] INFO  logstash.pipeline - Starting pipeline {"id"=>"main", "pipeline.workers"=>2, "pipeline.batch.size"=>125, "pipeline.batch.delay"=>5, "pipeline.max_inflight"=>250}
14:59:07.361 [[main]-pipeline-manager] INFO  logstash.pipeline - Pipeline main started
The stdin plugin is now waiting for input:
14:59:07.467 [Api Webserver] INFO  logstash.agent - Successfully started Logstash API endpoint {:port=>9600}
www.baidu.com                                          [[enter Baidu to test]
2021-05-22T06:59:31.515Z apache www.baidu.com
www.qq.com                                             [input qq Test]
2021-05-22T06:59:59.439Z apache www.qq.com
- Use rubydebug to convert the format and display the detailed output. codec is a decoder
[root@apache opt]# logstash -e 'input { stdin{} } output { stdout{ codec=>rubydebug } }'
ERROR StatusLogger No log4j2 configuration file found. Using default configuration: logging only errors to the console.
WARNING: Could not find logstash.yml which is typically located in $LS_HOME/config or /etc/logstash. You can specify the path using --path.settings. Continuing using the defaults
Could not find log4j2 configuration at path //usr/share/logstash/config/log4j2.properties. Using default config which logs to console
15:07:02.189 [[main]-pipeline-manager] INFO  logstash.pipeline - Starting pipeline {"id"=>"main", "pipeline.workers"=>2, "pipeline.batch.size"=>125, "pipeline.batch.delay"=>5, "pipeline.max_inflight"=>250}
15:07:02.308 [[main]-pipeline-manager] INFO  logstash.pipeline - Pipeline main started
The stdin plugin is now waiting for input:
15:07:02.467 [Api Webserver] INFO  logstash.agent - Successfully started Logstash API endpoint {:port=>9600}
www.qq.com                             [input qq Test]
{
    "@timestamp" => 2021-05-22T07:07:19.823Z,
      "@version" => "1",
          "host" => "apache",
       "message" => "www.qq.com"
}
www.baidu.com                         [[enter Baidu to test]
{
    "@timestamp" => 2021-05-22T07:07:29.605Z,
      "@version" => "1",
          "host" => "apache",
       "message" => "www.baidu.com"
}
- Use logstash to write information into elastic search
[Standard input information and output to 192.168.131.10:9200 Mainframe es [Chinese]
[root@apache opt]# logstash -e 'input { stdin{} } output { elasticsearch { hosts=>["192.168.131.10:9200"] } }'
ERROR StatusLogger No log4j2 configuration file found. Using default configuration: logging only errors to the console.
WARNING: Could not find logstash.yml which is typically located in $LS_HOME/config or /etc/logstash. You can specify the path using --path.settings. Continuing using the defaults
Could not find log4j2 configuration at path //usr/share/logstash/config/log4j2.properties. Using default config which logs to console
15:10:32.492 [[main]-pipeline-manager] INFO  logstash.outputs.elasticsearch - Elasticsearch pool URLs updated {:changes=>{:removed=>[], :added=>[http://192.168.131.10:9200/]}}
15:10:32.522 [[main]-pipeline-manager] INFO  logstash.outputs.elasticsearch - Running health check to see if an Elasticsearch connection is working {:healthcheck_url=>http://192.168.131.10:9200/, :path=>"/"}
15:10:32.697 [[main]-pipeline-manager] WARN  logstash.outputs.elasticsearch - Restored connection to ES instance {:url=>#<Java::JavaNet::URI:0x4dc8cd21>}
15:10:32.728 [[main]-pipeline-manager] INFO  logstash.outputs.elasticsearch - Using mapping template from {:path=>nil}
15:10:32.923 [[main]-pipeline-manager] INFO  logstash.outputs.elasticsearch - Attempting to install template {:manage_template=>{"template"=>"logstash-*", "version"=>50001, "settings"=>{"index.refresh_interval"=>"5s"}, "mappings"=>{"_default_"=>{"_all"=>{"enabled"=>true, "norms"=>false}, "dynamic_templates"=>[{"message_field"=>{"path_match"=>"message", "match_mapping_type"=>"string", "mapping"=>{"type"=>"text", "norms"=>false}}}, {"string_fields"=>{"match"=>"*", "match_mapping_type"=>"string", "mapping"=>{"type"=>"text", "norms"=>false, "fields"=>{"keyword"=>{"type"=>"keyword", "ignore_above"=>256}}}}}], "properties"=>{"@timestamp"=>{"type"=>"date", "include_in_all"=>false}, "@version"=>{"type"=>"keyword", "include_in_all"=>false}, "geoip"=>{"dynamic"=>true, "properties"=>{"ip"=>{"type"=>"ip"}, "location"=>{"type"=>"geo_point"}, "latitude"=>{"type"=>"half_float"}, "longitude"=>{"type"=>"half_float"}}}}}}}}
15:10:32.935 [[main]-pipeline-manager] INFO  logstash.outputs.elasticsearch - Installing elasticsearch template to _template/logstash
15:10:33.020 [[main]-pipeline-manager] INFO  logstash.outputs.elasticsearch - New Elasticsearch output {:class=>"LogStash::Outputs::ElasticSearch", :hosts=>[#<Java::JavaNet::URI:0x1edf0339>]}
15:10:33.023 [[main]-pipeline-manager] INFO  logstash.pipeline - Starting pipeline {"id"=>"main", "pipeline.workers"=>2, "pipeline.batch.size"=>125, "pipeline.batch.delay"=>5, "pipeline.max_inflight"=>250}
15:10:33.227 [[main]-pipeline-manager] INFO  logstash.pipeline - Pipeline main started
The stdin plugin is now waiting for input:
15:10:33.399 [Api Webserver] INFO  logstash.agent - Successfully started Logstash API endpoint {:port=>9600}
www.qq.com      [Input content for test]
www.baidu.com
www.qz.com
- Native browser input http://192.168.131.10:9100/ View index information
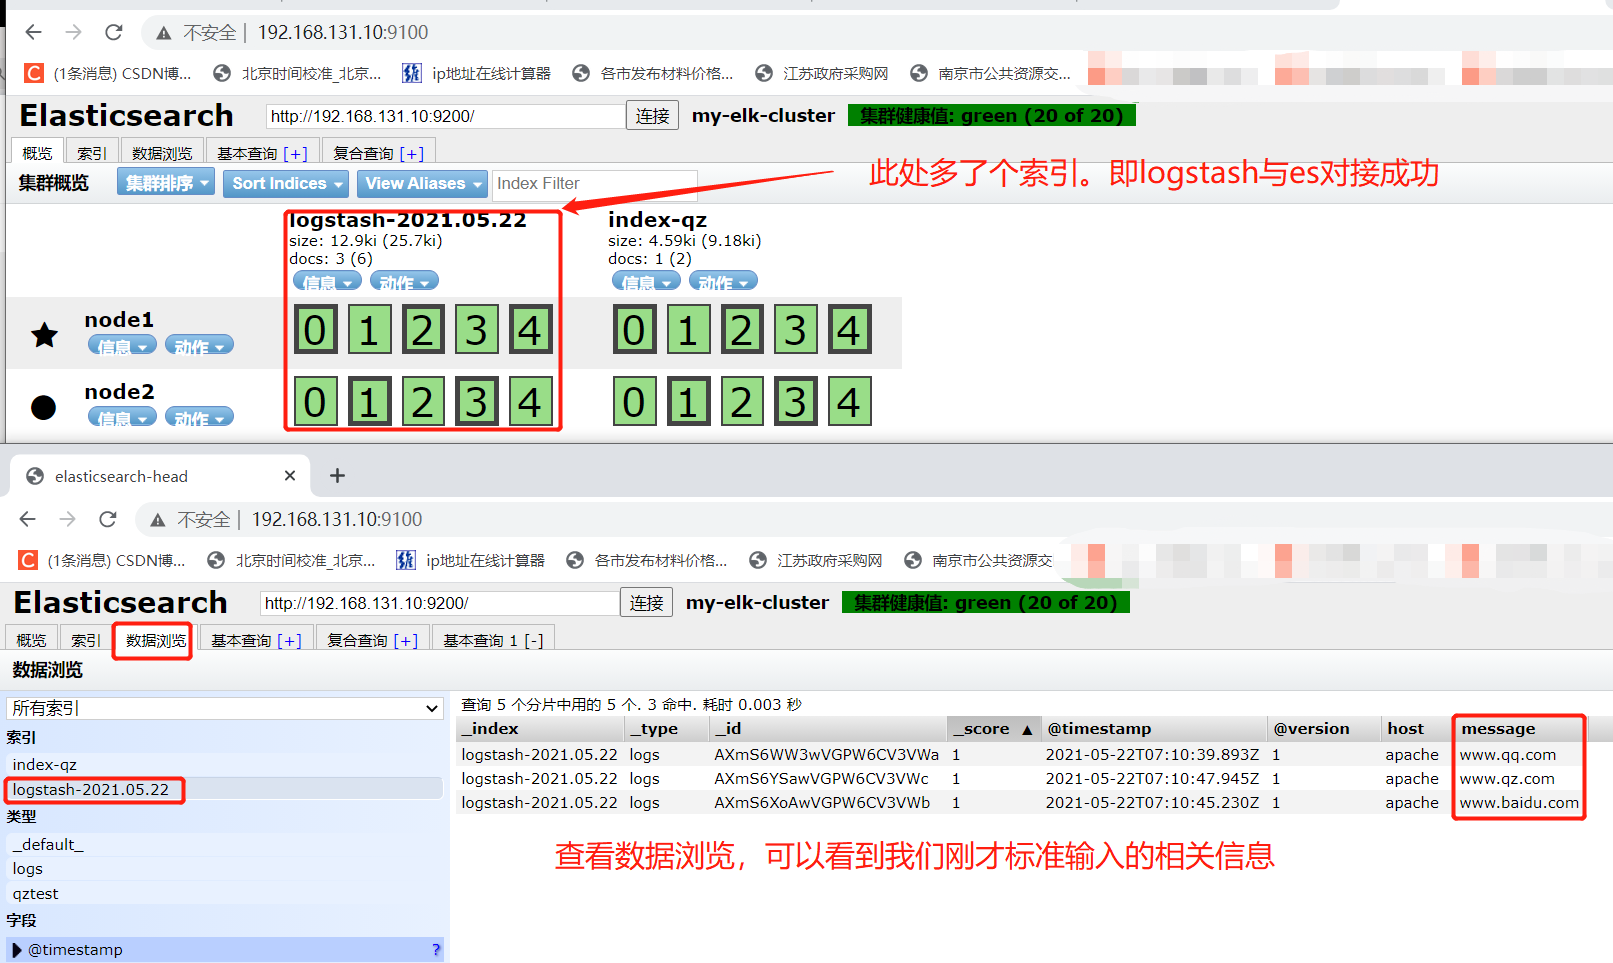
2.5 log in to the Apache host (192.168.131.12) for docking configuration
- The logstash configuration file is mainly organized in three parts: input, output and filter (as needed)
[root@apache opt]# chmod o+r /var/log/messages
[root@apache opt]# ll /var/log/messages
-rw----r--. 1 root root 573414 5 June 22-15:21 /var/log/messages

[What is defined in the configuration file is to collect system logs( system)]
[root@apache opt]# vim /etc/logstash/conf.d/system.conf [edit Logstash configuration file]

input {                                                  [[input file]
       file{
        path => "/var/log/messages"                      [route:/var/log/messages]
        type => "system"                                 [Type: system]
        start_position => "beginning"                    [Starting point: beginning]
        }
      }
output {                                                 [Output to]
        elasticsearch {
          hosts => ["192.168.131.10:9200"]               [IP:Port 192.168.131.10:9200 [host]
          index => "system-%{+YYYY.MM.dd}"               [Indexes: system-...]
          }
[root@apache opt]# systemctl restart logstash.service [restart the service after modifying the configuration file]
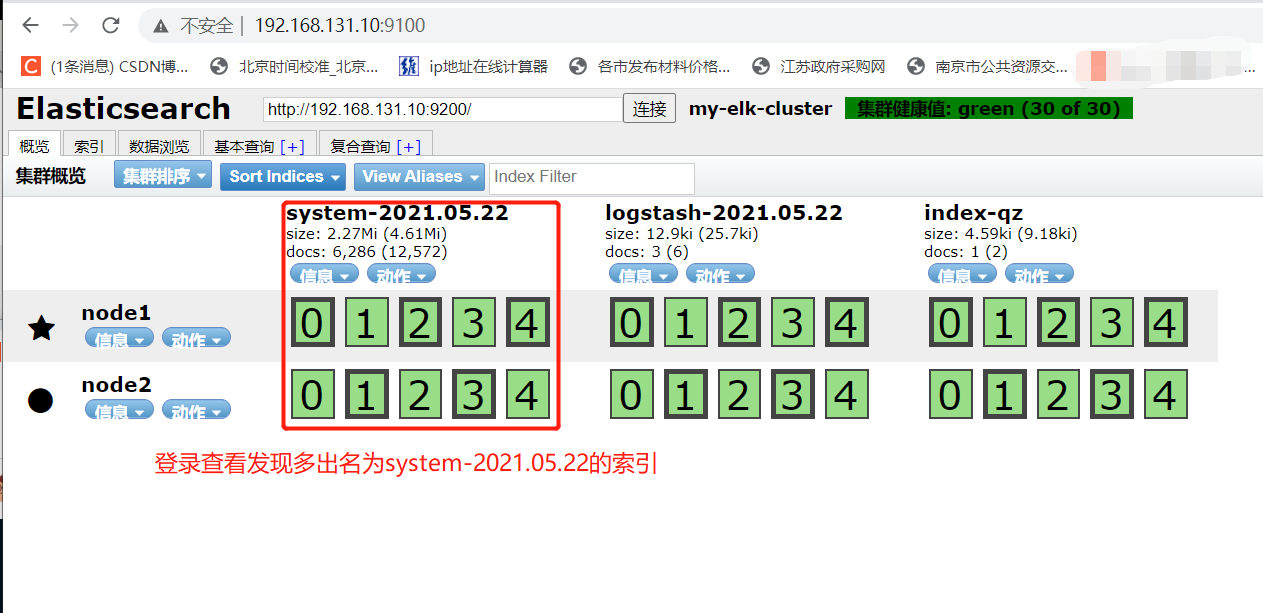
- Native browser input http://192.168.131.10:9100/ View index information
2.6 installing kibana on node1 host
[root@node1 opt]# cd /usr/local/src/
[root@node1 src]# rz -E
rz waiting to receive.
[root@node1 src]# ls
elasticsearch-head  elasticsearch-head.tar.gz  kibana-5.5.1-x86_64.rpm  phantomjs-2.1.1-linux-x86_64  phantomjs-2.1.1-linux-x86_64.tar.bz2
[root@node1 src]# rpm -ivh kibana-5.5.1-x86_64.rpm


[root@node1 src]# vim /etc/kibana/kibana.yml [edit kibana profile]

  2 server.port: 5601                                 [kibana [open port]
  7 server.host: "0.0.0.0"                            [kibana Listening address]
 21 elasticsearch.url: "http://192.168.131.10:9200 "[contact elasticsearch]
 30 kibana.index: ".kibana"                           [stay elasticsearch Add in.kibana [index]
[root@node1 src]# systemctl start kibana.service
[root@node1 src]# systemctl enable kibana.service
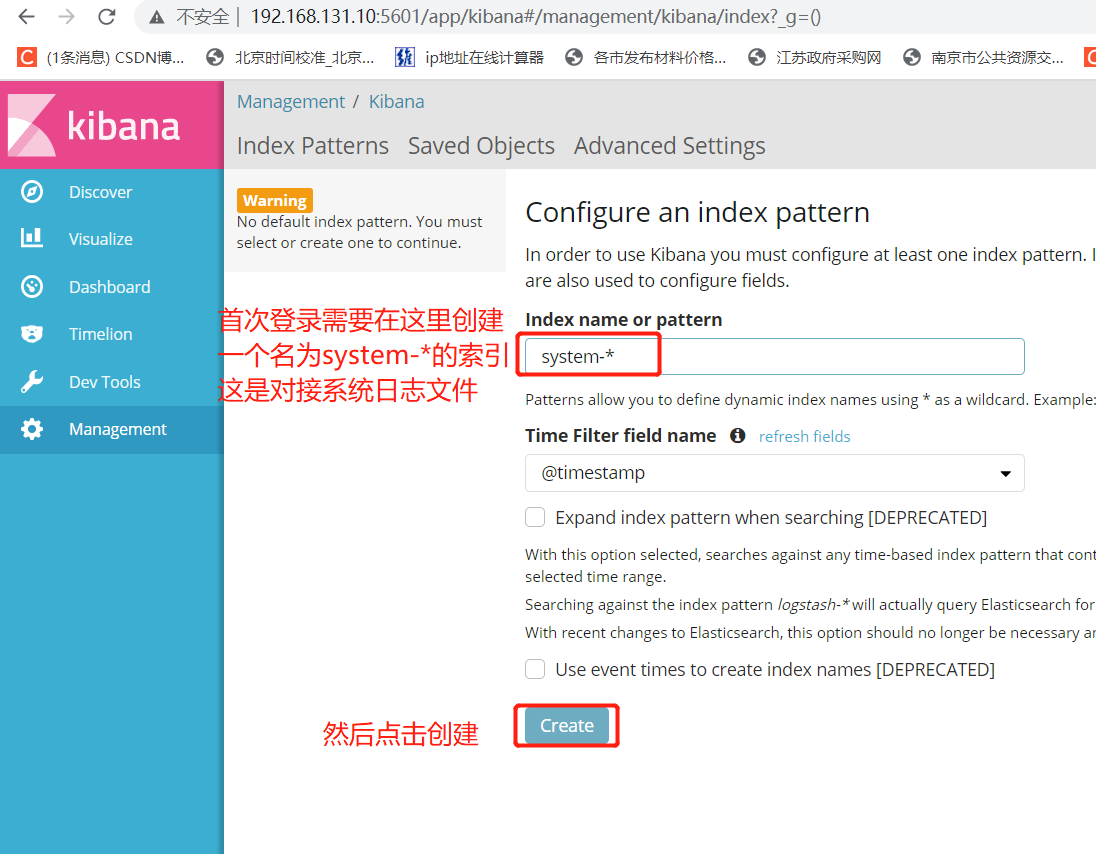
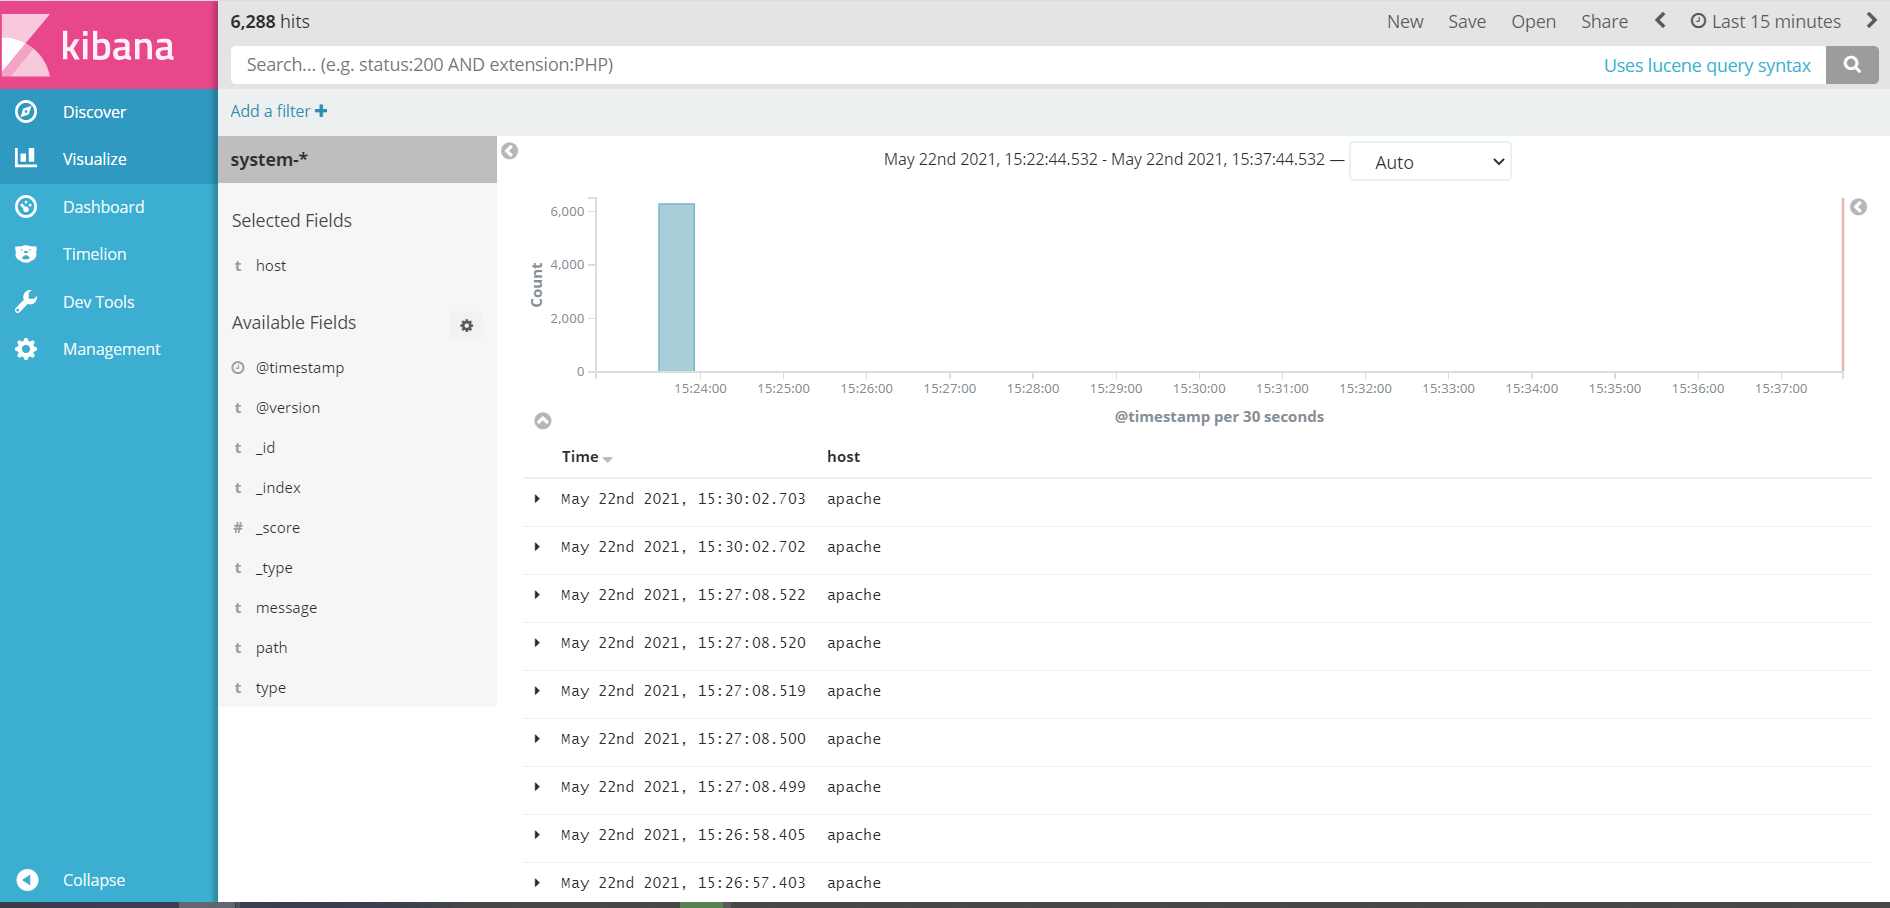
- Native browser input http://192.168.131.10:5601/ see
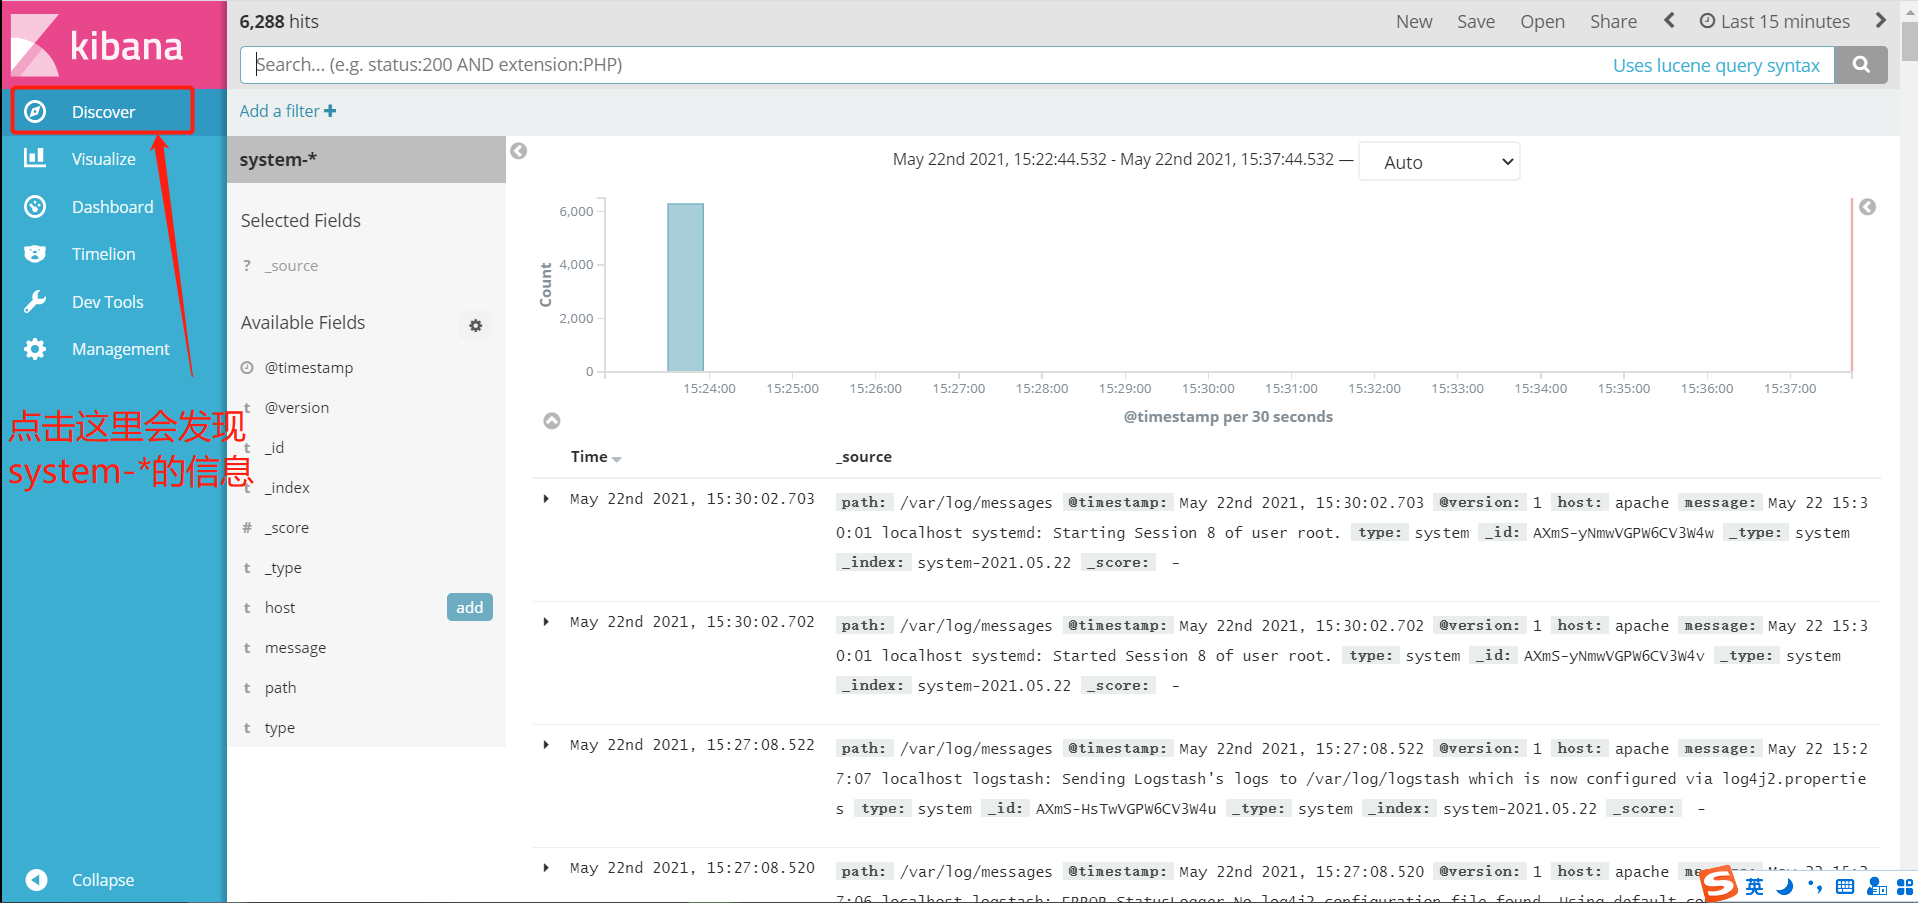
- After clicking add next to hsot, only the Time and Host options will be displayed in a friendly way
2.7 docking apache log files (access, error)
[root@apache opt]# cd /etc/logstash/conf.d/
[root@apache conf.d]# vim apache_log.conf

input {
       file{
        path => "/etc/httpd/logs/access_log"
        type => "access"
        start_position => "beginning"
        }
       file{
        path => "/etc/httpd/logs/error_log"
        type => "error"
        start_position => "beginning"
        }

      }
output {
        if [type] == "access" {
        elasticsearch {
          hosts => ["192.168.131.10:9200"]
          index => "apache_access-%{+YYYY.MM.dd}"
          }
        }
        if [type] == "error" {
        elasticsearch {
          hosts => ["192.168.131.10:9200"]
          index => "apache_error-%{+YYYY.MM.dd}"
          }
        }
        }