1, Overview
This post mainly introduces how to use Cartopy to draw maps and draw some desired information in pyqt5 (this article draws the European numerical forecast of micaps). Briefly introduce the knowledge points involved in this article for your reference:
- The combination of pyqt5 and matplotlib.
- The combination of matplotlib and Cartopy.
- Reading of European numerical forecast by micaps.
- Data rendering and smoothing (interpolation)
- Solution of over dense wind rod
- Interface matplotlib image interaction, as well as the refresh of data image and map in the interaction process
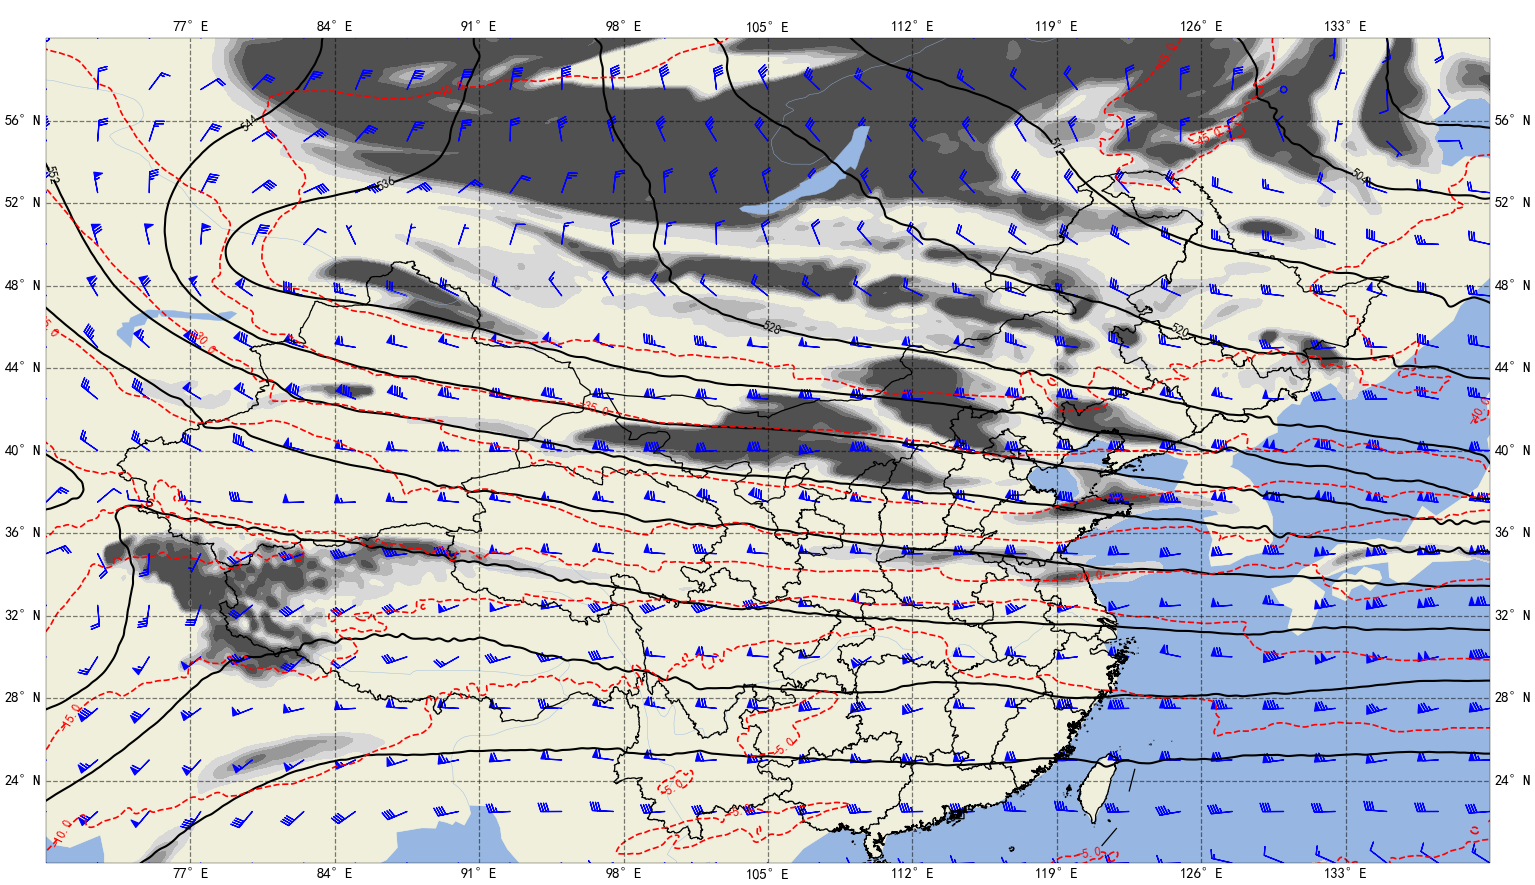
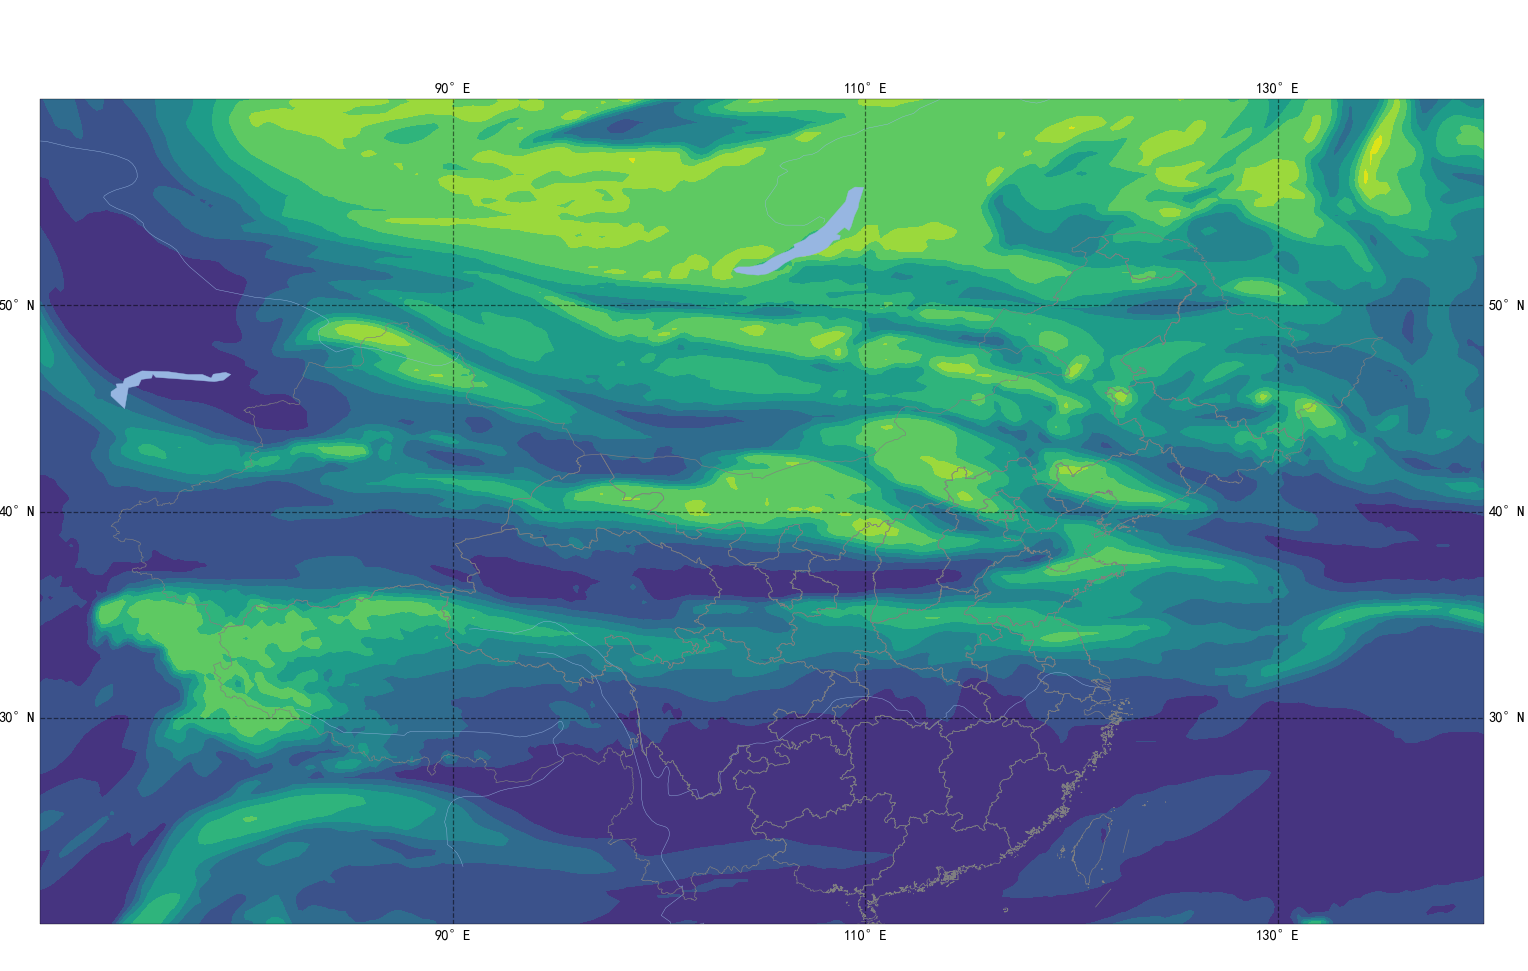
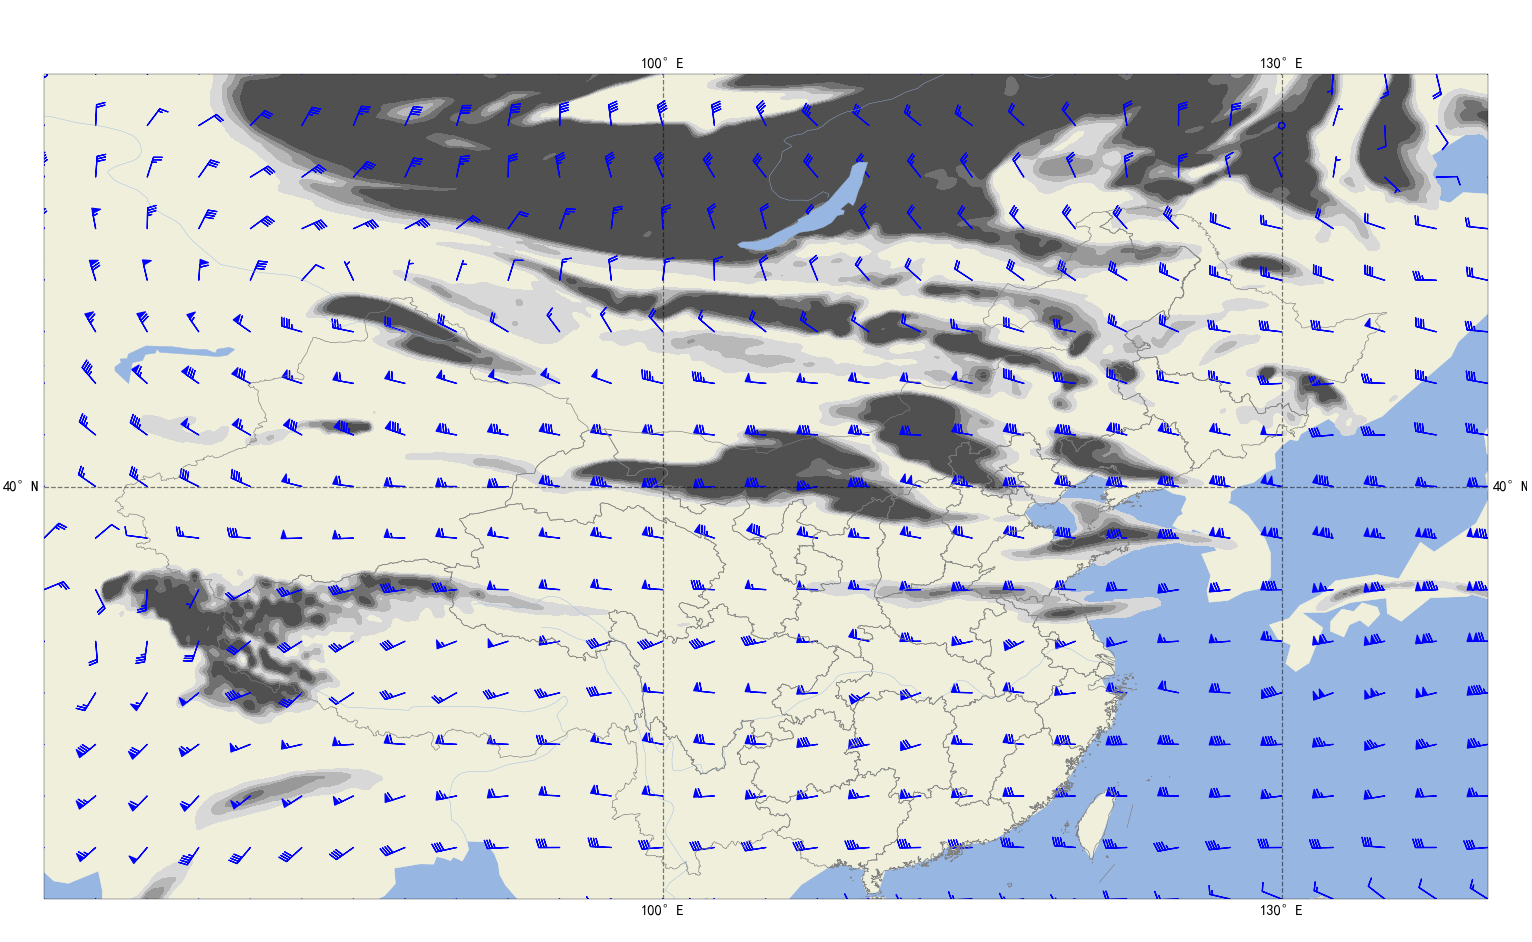
First, the last final effect drawing will attract you:
2, Interface drawing
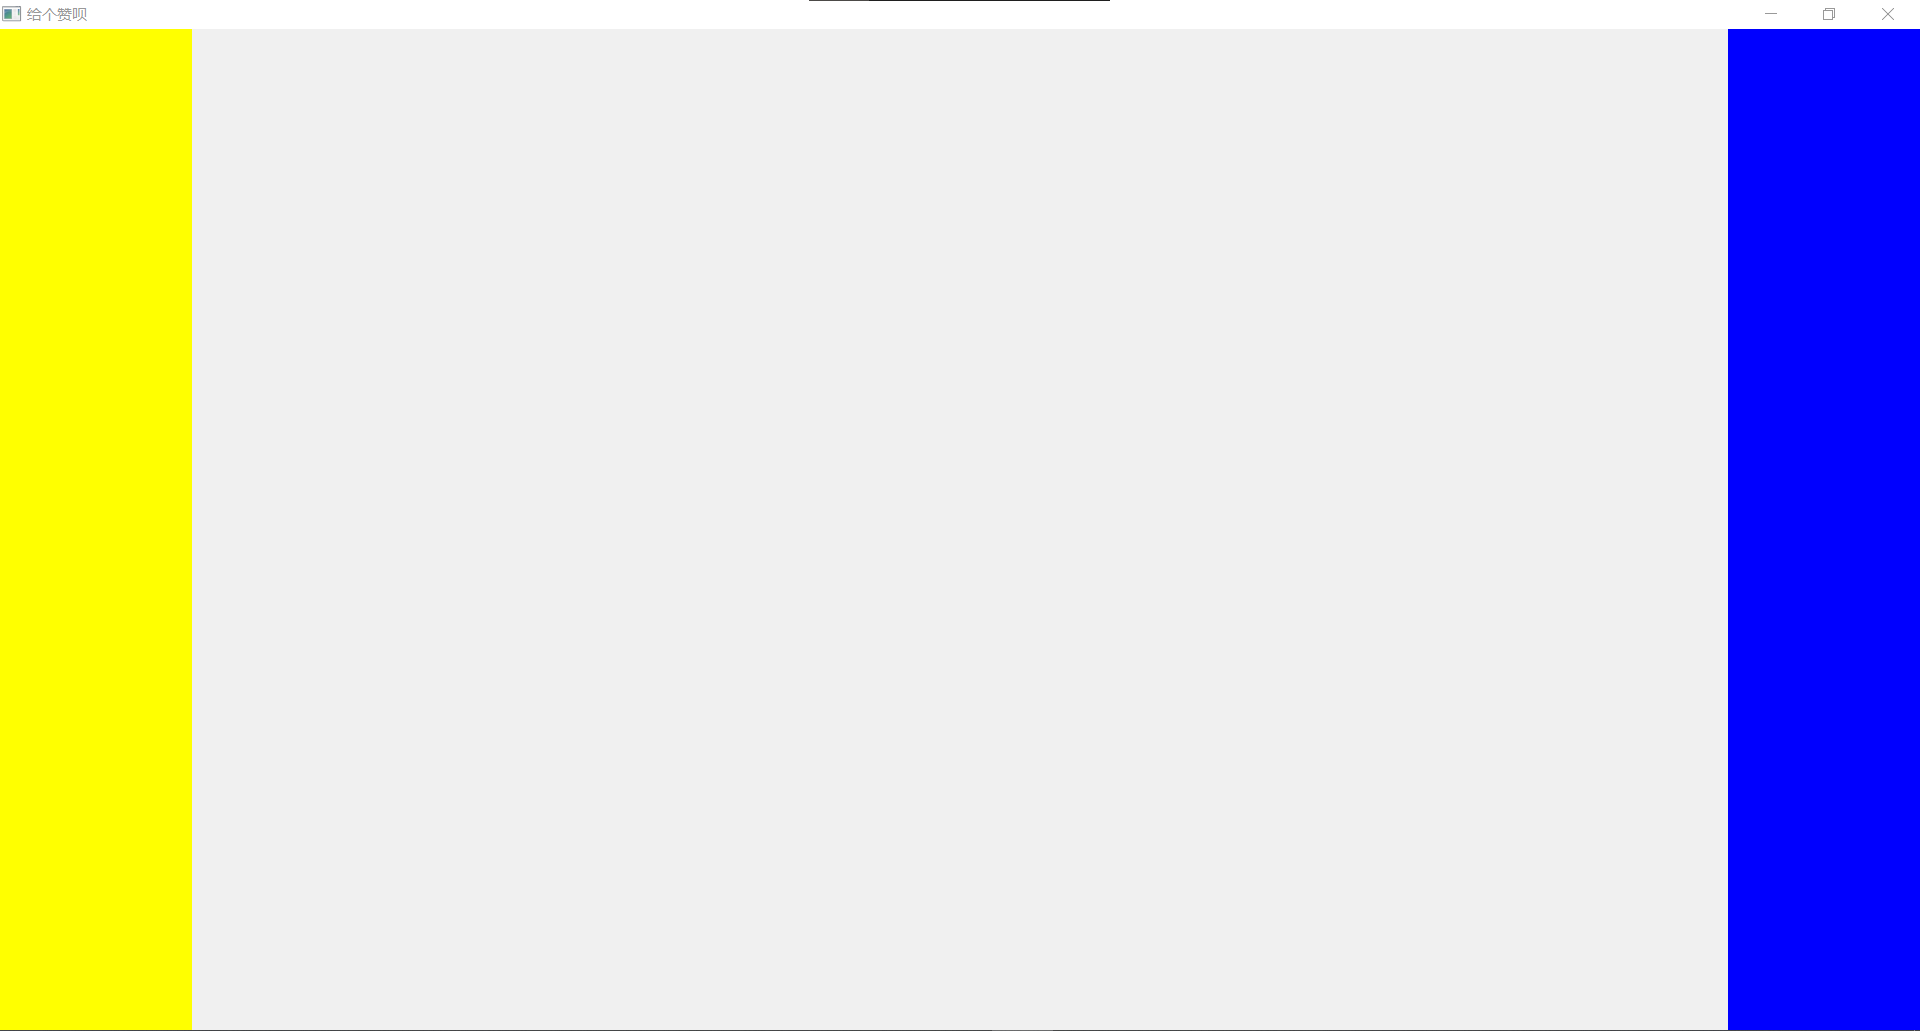
Here we use pyqt5 to make a simple interface. Because it is not the focus of this time, the interface is not even a semi-finished product, but you can improve it. It mainly introduces the combination of pyqt5 and matplotlib. The following is the main function main py
from PyQt5.Qt import *
#A custom class used to combine pyqt5 and matplotlib
# from My_Class import MyDataFigure
class Window(QWidget):
    def __init__(self):
        super().__init__()
        self.setWindowTitle("Give me a compliment")
        self.showMaximized()#Maximize main window
        self.setup_ui()
    def setup_ui(self):
        #Three controls are added, namely the left, middle and right middle controls, which will be used to draw pictures at that time, and various buttons are placed on the left and right sides
        self.left_ql = QLabel(self)
        self.mid_ql = QLabel(self)#Used to draw pictures
        self.right_wt = QWidget(self)
        #In order to make it easy to distinguish, make the left yellow and the right blue
        self.left_ql.setStyleSheet("background-color:yellow")
        self.right_wt.setStyleSheet("background-color:blue")
        #A horizontal dynamic layout is made, which divides the window into ten parts in total, with eight in the middle
        main_layout = QHBoxLayout()
        main_layout.addWidget(self.left_ql,1)
        main_layout.addWidget(self.mid_ql,8)
        main_layout.addWidget(self.right_wt,1)
        main_layout.setContentsMargins(0,0,0,0)#Border is 0
        main_layout.setSpacing(0)#Control interval is 0
        self.setLayout(main_layout)
if __name__ == "__main__":
    import sys
    app = QApplication(sys.argv)
    window = Window()
    window.show()
    sys.exit(app.exec_())
The above code will run out of such a window
The interface is simply made like this. The key point is not to introduce how to make the interface. You can add controls on the left and right sides.
2, Combination of pyqt5 and matplotlib
The combination of pyqt5 and matplotlib essentially makes use of a class in matplotlib, FigureCanvasQTAgg, which can be embedded in the QLabel control of pyqt5 and displayed. It can also draw like the canvas of matplotlib. My is provided below_ Class. Py Code:
#None of the packages introduced below can be less
import matplotlib
matplotlib.use("Qt5Agg")
from matplotlib.backends.backend_qt5agg import FigureCanvasQTAgg
import matplotlib.pyplot as plt
from matplotlib.figure import Figure

#The class needed to embed the interface is inherited from figurecanvasqtag
class MyDataFigure(FigureCanvasQTAgg):
    #Constructor
    #The first two parameters QL, mid_ QL is two QLabel controls. It is not necessary. It is added by the author. One is used to display the longitude and latitude of the mouse, and the other is used to make the mouse press to change the shape. Similarly, you can write any parameters you need to pass in__ init__ () medium
    def __init__(self, ql ,mid_ql,width=100, height=100, dpi=30):
        self.figs = Figure(figsize=(width, height), dpi=dpi)
        super(MyDataFigure, self).__init__(self.figs)#None of the preceding codes should be missing, and the class name should be consistent
        plt.rcParams['font.sans-serif'] = ['SimHei']#Solve Chinese character garbled code
        plt.rcParams['axes.unicode_minus'] = False#The negative sign is not displayed
        print('Created successfully')#Now you can start drawing
After designing the drawing class, you need to instantiate it in the main interface
First, introduce the class
from My_Class import MyDataFigure
Instantiate then
#Instantiate the custom class MyDataFigure and pass in two control parameters, which can be modified by yourself
        self.canvas_data = MyDataFigure(self.left_ql,self.mid_ql)
        #Embed class into QLabel control
        self.hboxlayout = QHBoxLayout(self.mid_ql)
        self.hboxlayout.addWidget(self.canvas_data)
        #Set border to 0
        self.hboxlayout.setContentsMargins(0,0,0,0)
        #Adjust the area boundary of the drawing
        self.canvas_data.figs.subplots_adjust(left=0.05, right=1.3, top=0.9, bottom=0.5)
At this point, the main window main The code quantity of Py has been completed and will be given at the end of the article.
3, Combination of matplotlib and Cartopy
This part is relatively simple. Our main purpose is to use Cartopy to draw a map on matplotlib, and then all the code parts are in my_ Complete above.
Note: the run is still main py
1. Introduce the required package
Related package functions have been commented
#Package required for drawing
import matplotlib.colors as colors#colour
import cartopy.feature as cfeature#Map loading
import cartopy.crs as ccrs#Projection mode
from cartopy.mpl.gridliner import LATITUDE_FORMATTER, LONGITUDE_FORMATTER#Longitude latitude conversion
import matplotlib.ticker as mticker#x. Y-axis scale display
2. Draw a map
The basic settings are divided into 1 Set the display map range; 2. Create subgraph; 3. Load the area into the subgraph.
self.extent = [70,140,20,60]#It shows the area of 70-140 east longitude and 20-60 north latitude
self.axes_map = self.figs.add_axes([0.03, 0, 0.94, 0.95], projection=ccrs.PlateCarree())#Create subgraph, normal projection
self.axes_map.set_extent(self.extent,crs=ccrs.PlateCarree())#Set range, normal projection
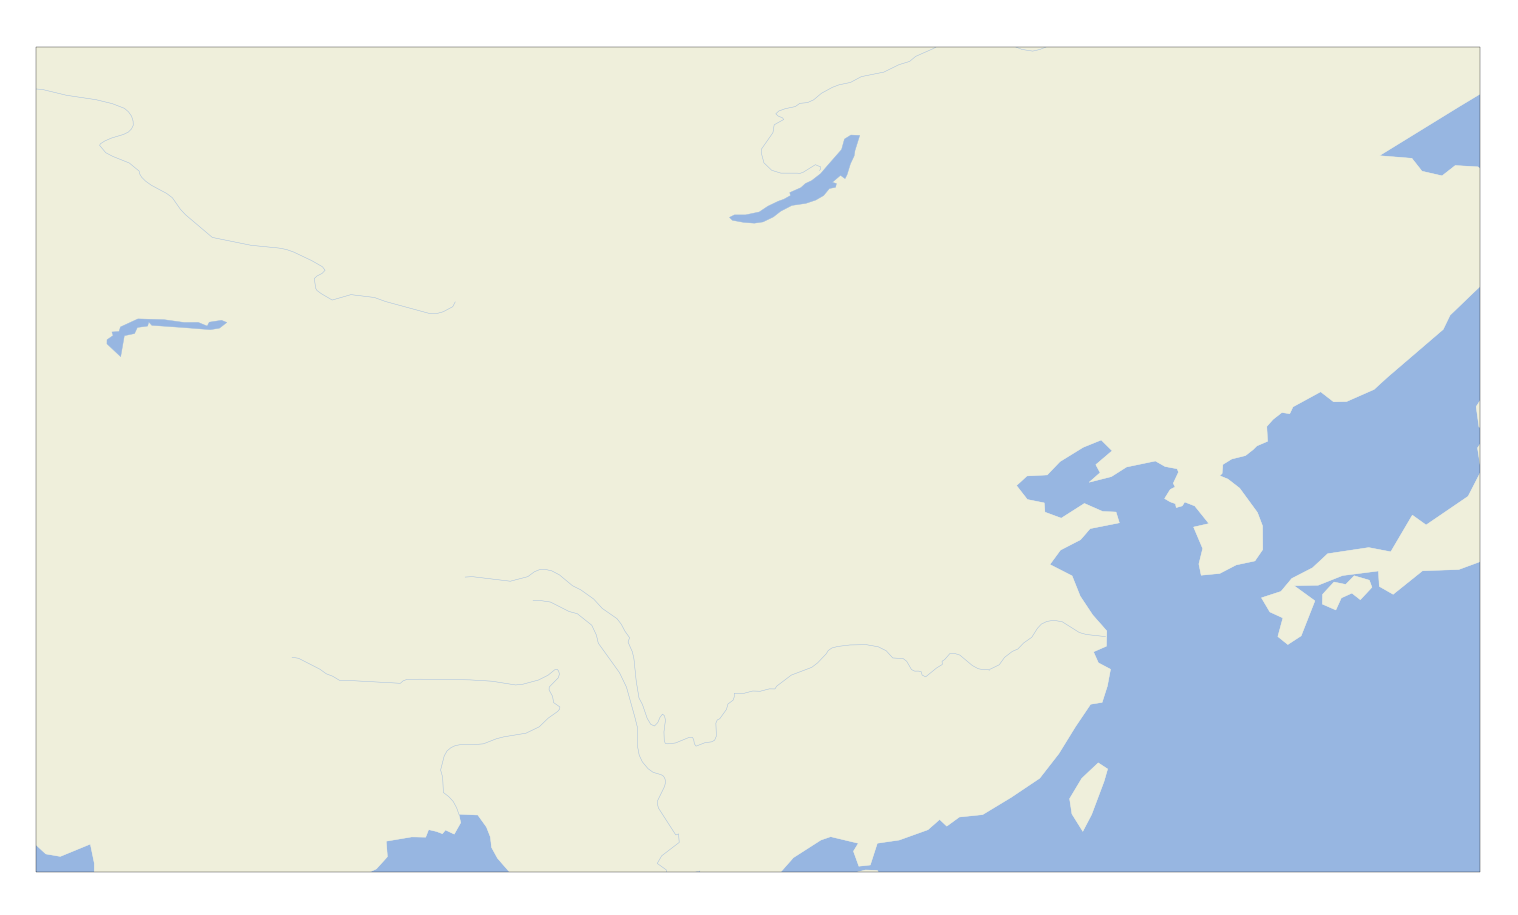
#Draw the sea with cartopy's own map
self.axes_map.add_feature(cfeature.OCEAN.with_scale('110m'))
#Using cartopy's own land map
self.axes_map.add_feature(cfeature.LAND.with_scale('110m'))
# #Using cartopy's own map of rivers
self.axes_map.add_feature(cfeature.RIVERS.with_scale('110m'))
#Using cartopy's own map of lakes
self.axes_map.add_feature(cfeature.LAKES.with_scale('110m'))
This part of the code will be modified later. In order to refresh the map, it will be put into a method. It will be introduced below for your understanding.
The resolution of the loaded map is 110m, which is to reduce the requirement of computer speed
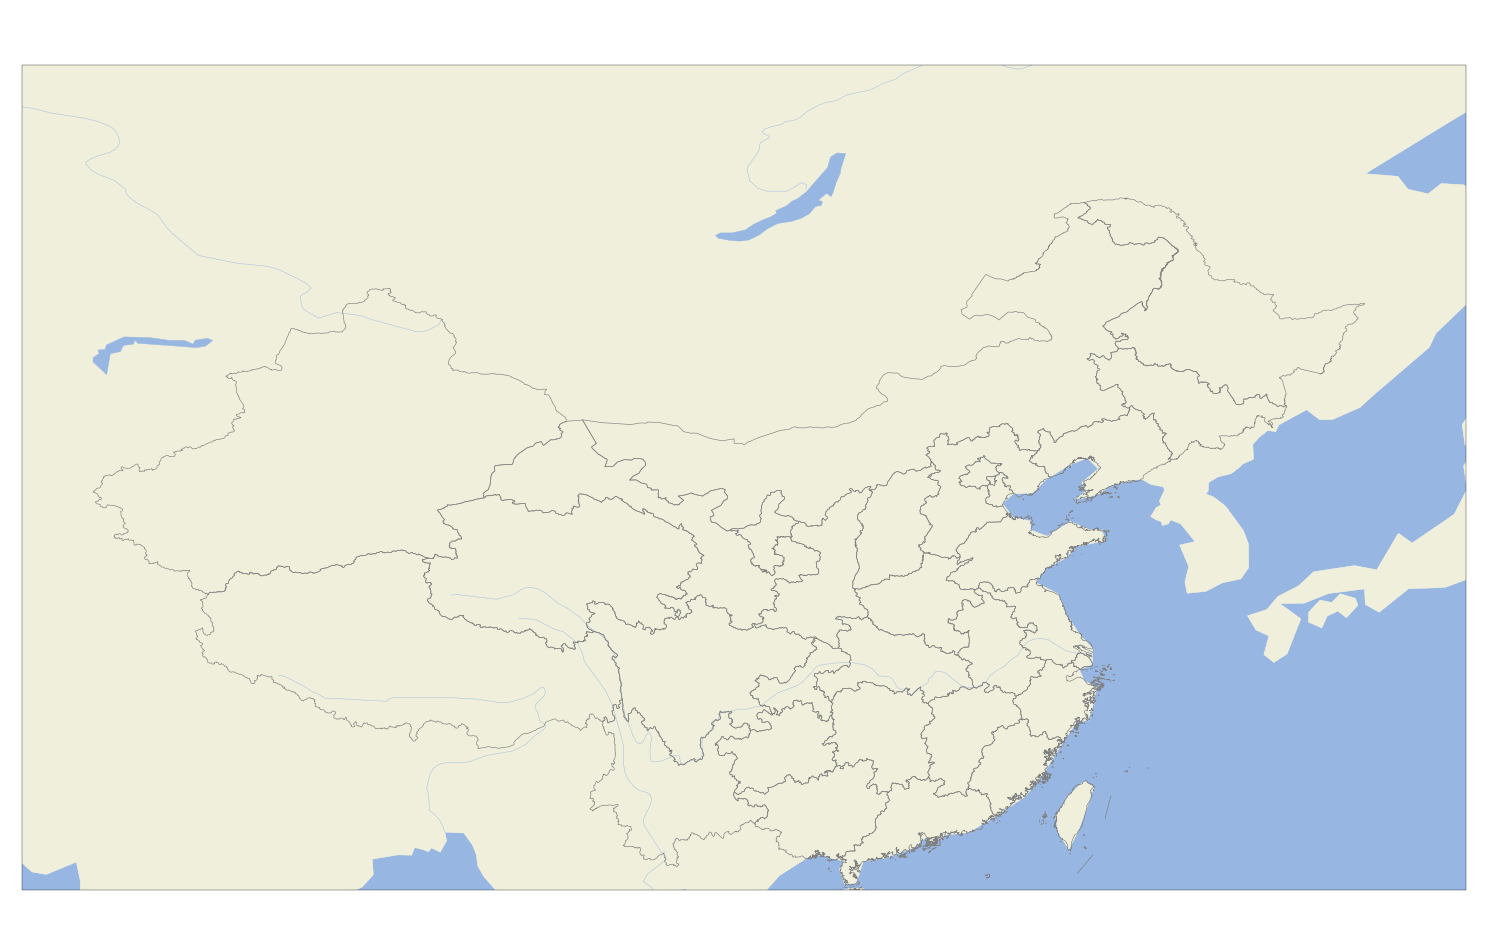
3. Draw national boundaries
I don't need to introduce this. It was introduced in previous articles, and the code can be used directly
#Read CN border la Dat file
        with open('CN-border-La.dat') as src:
            context = src.read()
            blocks = [cnt for cnt in context.split('>') if len(cnt) > 0]
            self.borders = [np.fromstring(block, dtype=float, sep=' ') for block in blocks]
        # Draw borders
        for line in self.borders:
            self.axes_map.plot(line[0::2], line[1::2], '-', color='gray',transform=ccrs.PlateCarree())
When refreshing the map, you only need to draw the border, and you don't need to read cn-border-la repeatedly dat.
Note: in fact, the author uses the shp file to draw the national boundaries. In order to interact, it's faster, but after all, it's published. Try not to make mistakes, and use the more formal national boundaries. In this case, once it's wrong, it's too sensitive
4, Reading of European numerical forecast by micaps
1.read_mdfs.py
micaps European numerical forecast is grid point data. Only one is introduced here. The data reading part is copied by others in the meteorological home, which is published here for you to read_mdfs.py
import struct
import datetime
import numpy as np

class MDFS_Grid:
    def __init__(self, filepath):
        f = open(filepath, 'rb')
        if f.read(4).decode() != 'mdfs':
            raise ValueError('Not valid mdfs data')
        self.datatype = struct.unpack('h', f.read(2))[0]
        self.model_name = f.read(20).decode('gbk').replace('\x00', '')
        self.element = f.read(50).decode('gbk').replace('\x00', '')
        self.data_dsc = f.read(30).decode('gbk').replace('\x00', '')
        self.level = struct.unpack('f', f.read(4))
        year, month, day, hour, tz = struct.unpack('5i', f.read(20))
        self.utc_time = datetime.datetime(year, month, day, hour) - datetime.timedelta(hours=tz)
        self.period = struct.unpack('i', f.read(4))
        start_lon, end_lon, lon_spacing, lon_number = struct.unpack('3fi', f.read(16))
        start_lat, end_lat, lat_spacing, lat_number = struct.unpack('3fi', f.read(16))
        lon_array = np.arange(start_lon, end_lon + lon_spacing, lon_spacing)
        lat_array = np.arange(start_lat, end_lat + lat_spacing, lat_spacing)
        isoline_start_value, isoline_end_value, isoline_space = struct.unpack('3f', f.read(12))
        f.seek(100, 1)
        block_num = lat_number * lon_number
        data = {}
        data['Lon'] = lon_array
        data['Lat'] = lat_array
        if self.datatype == 4:
            # Grid form
            grid = struct.unpack('{}f'.format(block_num), f.read(block_num * 4))
            grid_array = np.array(grid).reshape(lat_number, lon_number)
            data['Grid'] = grid_array
        elif self.datatype == 11:
            # Vector form
            norm = struct.unpack('{}f'.format(block_num), f.read(block_num * 4))
            angle = struct.unpack('{}f'.format(block_num), f.read(block_num * 4))
            norm_array = np.array(norm).reshape(lat_number, lon_number)
            angle_array = np.array(angle).reshape(lat_number, lon_number)
            # Convert stupid self-defined angle into correct direction angle
            corr_angle_array = 270 - angle_array
            corr_angle_array[corr_angle_array < 0] += 360
            data['Norm'] = norm_array
            data['Direction'] = corr_angle_array
        self.data = data
2. Read
It doesn't matter if you don't understand it. Just use it directly. Next, in My_Class.py
from read_mdfs import MDFS_Grid#Reading grid data using
Simple application
a = MDFS_Grid('ECMWF_HR_HGT_500_21010308.003')
self.lon = a.data['Lon']#longitude
self.lat = a.data['Lat']#latitude
self.var = a.data['Grid']#data
The above code is to introduce the principle of use: and create an MDFS_Grid class, the input parameter is the file path (here is the European numerical forecast reported from 08:00 on January 3, 21, the 3rd hour forecast, and the altitude field of 500hpa)
Practical implementation
The first step, in My_Class.py creates an identifier to judge whether the required data is successfully read in
self.flg = {
            'HGT':False,
            'RH':False,
            'TMP':False,
            'UGRD':False,
            'VGRD':False
        }
When the data is successfully read in, the corresponding part is changed to Ture.
In the second part, the file to be read is not a file, so create a read method
The longitude and latitude are not read here, because the longitude and latitude are the same. We can produce one by ourselves. Reduce program redundancy
#Data reading method, the first parameter is the path, and the second is the data type
    def read_data(self,filepath,data_type):
        if data_type == 'HGT':#height
            a = MDFS_Grid(filepath)
            self.data_hgt = a.data['Grid']
            self.flg['HGT'] = True#Read successful
        if data_type == 'RH':#humidity
            a = MDFS_Grid(filepath)
            self.data_rh = a.data['Grid']
            self.flg['RH'] = True#Read successful
        if data_type == 'TMP':#temperature
            a = MDFS_Grid(filepath)
            self.data_tmp = a.data['Grid']
            self.flg['TMP'] = True#Read successful
        if data_type == 'UGRD':#wind
            a = MDFS_Grid(filepath)
            self.data_u = a.data['Grid']
            self.flg['UGRD'] = True#Read successful
        if data_type == 'VGRD':#wind
            a = MDFS_Grid(filepath)
            self.data_v = a.data['Grid']
            self.flg['VGRD'] = True#Read successful
This is not the full version, because there is no data filtering and smoothing. The modification will be introduced again later.
The third part, in__ init__ () calling this method
self.read_data('ECMWF_HR_HGT_500_21010308.003','HGT')
self.read_data('ECMWF_HR_TMP_500_21010308.003','TMP')
self.read_data('ECMWF_HR_RH_500_21010308.003','RH')
self.read_data('ECMWF_HR_UGRD_500_21010308.003','UGRD')
self.read_data('ECMWF_HR_VGRD_500_21010308.003','VGRD')
In this way, all the required height, temperature, humidity and wind are read.
5, Drawing of data
Here we introduce the drawing of humidity. The height and temperature are relatively simple. Let's see for ourselves in the final code
1. Create latitude and longitude grid
self.lon = np.arange(60.0,150.01,0.25)#longitude
self.lat = np.arange(60.1,0,-0.25)#latitude
self.olon , self.olat= np.meshgrid(self.lon,self.lat)
Note here that the latitude is arranged from large to small, so it is a negative arrangement, but it will affect the later interpolation. The solution will be introduced later
2. Preparation before drawing data
In order to make the later interaction faster, we need to separate the map layer from the data layer, so as to ensure that the map will not be refreshed repeatedly. The solution is to create another sub map and overlay it above the map layer:
self.axes_data = self.figs.add_axes([0.03, 0, 0.94, 0.95],projection=ccrs.PlateCarree())
In order to refresh data in real time, create a method of drawing data def drop (self):
    def drow(self):
        #Layer Settings
        self.axes_data.set_extent(self.extent,crs=ccrs.PlateCarree())
        #grid
        gl = self.axes_data.gridlines(crs=ccrs.PlateCarree(), draw_labels=True, linewidth=3, color='k', alpha=0.5,linestyle='--')
        #Coordinate axis setting
        gl.xformatter = LONGITUDE_FORMATTER ##Convert coordinate scale to latitude and longitude style
        gl.yformatter = LATITUDE_FORMATTER
        gl.xlocator = mticker.FixedLocator(np.arange(self.extent[0], self.extent[1], 20))
        gl.ylocator = mticker.FixedLocator(np.arange(self.extent[2], self.extent[3], 10))
        gl.xlabel_style={'size':35}
        gl.ylabel_style={'size':35}
        #Simplified print data
        if self.flg['RH']:
            cf_rh = self.axes_data.contourf(self.olon , self.olat,self.data_rh,10,transform=ccrs.PlateCarree())
3. Draw data
In__ init__ Add self. In () Drop () can be used to plot
3. Data filtering and smoothing
In order to make the humidity more like a cloud, we first eliminate the part with humidity less than 70 and turn the part with humidity greater than 100 into 100.
Operation in data reading phase
		if data_type == 'RH':#humidity
            a = MDFS_Grid(filepath)
            self.data_rh = a.data['Grid']

            #Filter the data, reject the part less than 70, and normalize the part greater than 100 to 100
            e = (self.data_rh <= 100)
            data_rh  = np.where(e,self.data_rh,100.0)
            e = (data_rh >= 70)
            self.data_rh  = np.where(e,self.data_rh,np.nan)

            self.flg['RH'] = True
It can be found that the image is ugly, so interpolation and smoothing are needed there
Step 1 import and stock in
from scipy.interpolate import interpolate#interpolation
The second step is to interpolate the latitude and longitude from 0.25 to 0.05. You can modify it according to your needs and computer ability
		self.lon_scipy = np.arange(60.0,150.01,0.05)
        self.lat_scipy = np.arange(0,60.1,0.05)
        self.olon , self.olat= np.meshgrid(self.lon_scipy,self.lat_scipy)
Here, the latitude is generated with positive value and increasing item by item. The purpose is to interpolate the following data. It is not allowed to use decreasing sequence item by item
Step 3 data interpolation
		if data_type == 'RH':#humidity
            a = MDFS_Grid(filepath)
            data_rh = a.data['Grid']
            #Data interpolation
            spline_rh = interpolate.RectBivariateSpline(self.lat, self.lon,data_rh,)
            data_rh = spline_rh(self.lat_scipy,self.lon_scipy)
            #Data filtering
            e = (data_rh <= 100)
            data_rh  = np.where(e,data_rh,100.0)
            e = (data_rh >= 70)
            self.data_rh  = np.where(e,data_rh,np.nan)
            #Invert the Y axis of the data because the latitude has been set from small to large
            self.data_rh = self.data_rh[::-1,:]
            self.flg['RH'] = True
Color changes have also been added when drawing, which was introduced in previous posts.
		if self.flg['RH']:
            clevs = [70.,80.,85.,90.,95.,100.]#Custom color list
            cdict = ['#d8d8d8','#b8b8b8','#989898','#707070','#505050']#Custom color list
            my_cmap = colors.ListedColormap(cdict)#Custom palette
            norm = colors.BoundaryNorm(clevs,my_cmap.N)#normalization
            cf_rh = self.axes_data.contourf(self.lon_scipy,self.lat_scipy,self.data_rh,clevs,transform=ccrs.PlateCarree(),cmap=my_cmap,norm =norm)
The height method is the same as the temperature method. The final code will give that the wind is not smooth because the wind itself is very dense.
6, Solution of over dense wind rod
Draw wind
			if self.flg['UGRD'] and self.flg['VGRD']:
                self.axes_data.barbs(self.lon,self.lat, self.data_u,self.data_v,barbcolor=['b'],linewidth=3, length=10, barb_increments=dict(half=2, full=4, flag=20))
resolvent
		if self.flg['UGRD'] and self.flg['VGRD']:
                self.axes_data.barbs(self.lon[::10],self.lat[::10], self.data_u[::10,::10],self.data_v[::10,::10],barbcolor=['b'],linewidth=3, length=10, barb_increments=dict(half=2, full=4, flag=20))
In fact, it is to take a value of data interval 10 and draw it again. The wind data is a two-dimensional array, and two should be written.
7, Map data interaction
1. The data is refreshed and the map remains unchanged
This scenario is suitable for refreshing data one by one, and the map size remains unchanged. You only need to add the following codes at the appropriate positions:
self.axes_data.cla()  # Clear drawing area
self.drow()
self.figs.canvas.draw()  # Notice here that the canvas is redrawn, self figs. canvas
self.figs.canvas.flush_events()  # Canvas refresh self figs. canvas
2. Hold down the mouse and drag the map
Here are two questions: 1 Mouse response event of Matplotlib. 2. Dynamic refresh of maps and data
Question 1: mouse response event of matplotlib
In__ init__ Add mouse response event in ():
#Mouse movement
self.figs.canvas.mpl_connect('motion_notify_event',self.fun_motion_event)
 #Mouse down
 self.figs.canvas.mpl_connect('button_press_event',self.fun_button_press)
 #Mouse release
 self.figs.canvas.mpl_connect('button_release_event',self.fun_button_release)
Here are three corresponding functions:
    def fun_motion_event(self,event):
        if event.button == 1:#1 means the left key is pressed all the time
            str111 = 'X=' + str(event.xdata) + '\n' +  'Y=' + str(event.ydata)
            self.ql.setText(str111)#The QLabel control passed in at the beginning of the constructor displays the latitude and longitude of the mouse
            move_lon = int(event.xdata) - self.mouse_press_lon#Calculate longitude movement
            move_lat = int(event.ydata) - self.mouse_press_lat#Calculate latitude movement
            self.lon_mid = self.lon_mid - move_lon#Modify display area center
            self.lat_mid = self.lat_mid - move_lat#Modify display area center
            self.extent = [self.lon_mid - self.lon_span, self.lon_mid + self.lon_span, self.lat_mid - self.lat_span, self.lat_mid+self.lat_span]#Modify display area
            self.extent = self.check_extent(self.extent)#set up
            self.axes_map.cla()  # Clear drawing area
            self.axes_data.cla()  # Clear drawing area
            self.refresh_map()#Refresh map
            self.drow()#refresh data
            self.figs.canvas.draw()  # Notice here that the canvas is redrawn, self figs. canvas
            self.figs.canvas.flush_events()  # Canvas refresh self figs. canvas
    def fun_button_press(self,event):
        if event.button == 1:
            str111 = 'X=' + str(event.xdata) + '\n' +  'Y=' + str(event.ydata)
            self.ql.setText(str111)#Display latitude and longitude
            self.mid_ql.setCursor(Qt.SizeAllCursor)#The mouse changes shape when pressed
            self.mouse_press_lon = int(event.xdata)#Record the longitude when the mouse is pressed
            self.mouse_press_lat = int(event.ydata)#Record the latitude when the mouse is pressed
    def fun_button_release(self,event):
        self.mid_ql.unsetCursor()#Release the mouse to reset the shape
The principle is to record the longitude and latitude when the left mouse button is pressed, record the difference of movement in real time during the movement, feed back to the drawing range, and redraw the map and data according to the new drawing range.
To better redefine the drawing range:
# self.extent = [70,140,20,60]#It shows the area of 70-140 east longitude and 20-60 north latitude
        #Central longitude 70:40 7:4 [70140,20,60]
        self.lon_mid = 105
        #Longitude span
        self.lon_span = 35
        #Central latitude
        self.lat_mid = 40
        #Latitude span
        self.lat_span = 20
        self.extent = [self.lon_mid - self.lon_span, self.lon_mid + self.lon_span, self.lat_mid - self.lat_span, self.lat_mid+self.lat_span]
The principle is to set a center point (105, 40), and then set the upper, lower, left and right spacing. The translation does not change the spacing, but only the center point; Scaling does not change the center point, but changes the spacing.
To implement the refresh map, create the map refresh method self refresh_ map()
		def refresh_map(self):
            self.axes_map.set_extent(self.extent,crs=ccrs.PlateCarree())
            # Draw borders
            for line in self.borders:
                self.axes_map.plot(line[0::2], line[1::2], '-', color='gray',transform=ccrs.PlateCarree())
            #Draw the sea with cartopy's own map
            self.axes_map.add_feature(cfeature.OCEAN.with_scale('110m'))
            #Using cartopy's own land map
            self.axes_map.add_feature(cfeature.LAND.with_scale('110m'))
            # #Using cartopy's own map of rivers
            self.axes_map.add_feature(cfeature.RIVERS.with_scale('110m'))
            #Using cartopy's own map of lakes
            self.axes_map.add_feature(cfeature.LAKES.with_scale('110m'))
In order to prevent errors from being reported when the drawing range exceeds the allowable range in the process of moving, the drawing range detection function def check is created_ extent(self,extent):
def check_extent(self,extent):
        if extent[3] >= 90:
            extent[3] = 90
            extent[2] = 90 - 2*self.lat_span
        if extent[2] <= -90:
            extent[2] = -90
            extent[3] = -90 + 2*self.lat_span
        if extent[0] <= -180:
            extent[0] = -180
            extent[1] = -180 +2*self.lon_span
        if extent[1] >= 180:
            extent[1] = 180
            extent[0] = 180-2*self.lon_span
        return extent
3. Zoom the map and data with the mouse wheel
The principle is to change the range of the drawing area through the roller, scale it in equal proportion, and the center point is the longitude and latitude of the mouse
#Mouse wheel
        self.figs.canvas.mpl_connect('scroll_event',self.fun_scroll_event)
    def fun_scroll_event(self,event):
            if event.button == 'up':#[70,140,20,60]
                if  self.lon_span >=14 and self.lat_span >=8:
                    self.lon_span -=7
                    self.lat_span -= 4
                    self.lon_mid = int(event.xdata)
                    self.lat_mid = int(event.ydata)
                    self.extent = [self.lon_mid - self.lon_span, self.lon_mid + self.lon_span, self.lat_mid - self.lat_span, self.lat_mid+self.lat_span]
                    self.extent = self.check_extent(self.extent)
                    self.axes_map.cla()  # Clear drawing area
                    self.axes_data.cla()  # Clear drawing area
                    self.refresh_map()
                    self.drow()
                    self.figs.canvas.draw()  # Re draw the canvas here figs. canvas
                    self.figs.canvas.flush_events()  # Canvas refresh self figs. canvas
            if event.button == 'down':  #35  20
                if  self.lon_span <=28 and self.lat_span <=16:
                    self.lon_span +=7
                    self.lat_span += 4
                    self.lon_mid = int(event.xdata)
                    self.lat_mid = int(event.ydata)
                    self.extent = [self.lon_mid - self.lon_span, self.lon_mid + self.lon_span, self.lat_mid - self.lat_span, self.lat_mid+self.lat_span]
                    self.extent = self.check_extent(self.extent)
                    self.axes_map.cla()  # Clear drawing area
                    self.axes_data.cla()  # Clear drawing area
                    self.refresh_map()
                    self.drow()
                    self.figs.canvas.draw()  # Notice here that the canvas is redrawn, self figs. canvas
                    self.figs.canvas.flush_events()  # Canvas refresh self figs. canvas
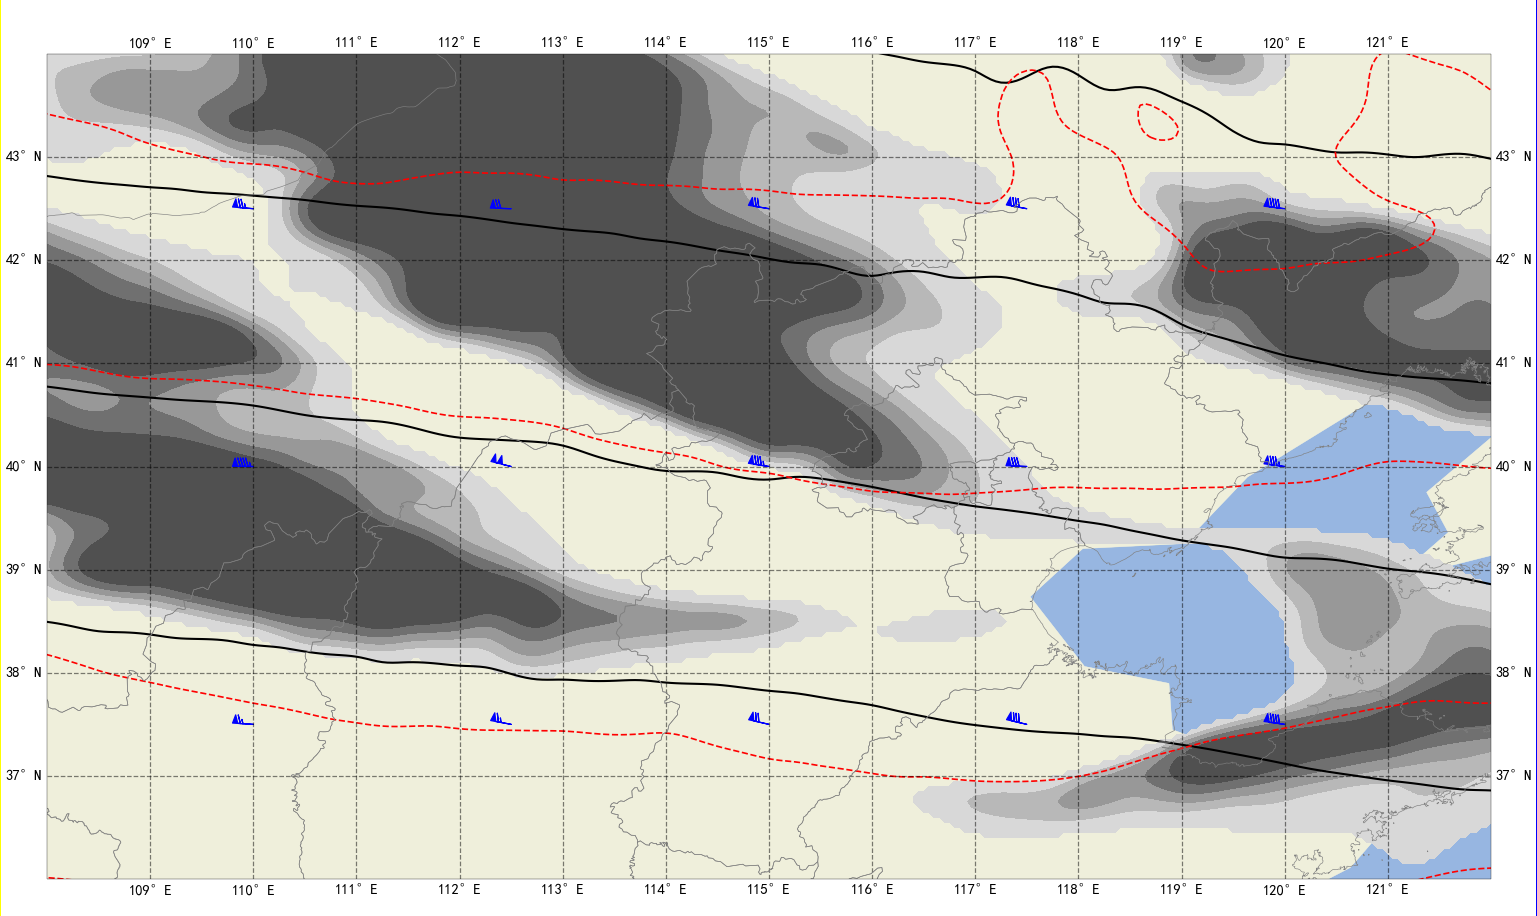
The following figure shows the enlarged image with the mouse wheel
8, Summary
If you need test data, you can leave a mailbox in the comment area. This article introduces the information of one time. For continuous playback, you only need to modify the reading path. There is no code in this block. At the same time, shp is actually used to read the map, using maskout py
maskout.readshapefile('bou2_4l.shp',linewidth=3,ax=self.axes_map)
If some of the contents are helpful, please give a praise. Here is the complete code:
main.py
from PyQt5.Qt import *
#A custom class used to combine pyqt5 and matplotlib
from My_Class import MyDataFigure

class Window(QWidget):
    def __init__(self):
        super().__init__()
        self.setWindowTitle("Give me a compliment")
        self.showMaximized()#Maximize main window
        self.setup_ui()


    def setup_ui(self):
        #Three controls are added, namely the left, middle and right middle controls, which will be used to draw pictures at that time, and various buttons are placed on the left and right sides
        self.left_ql = QLabel(self)
        self.mid_ql = QLabel(self)#Used to draw pictures
        self.right_wt = QWidget(self)
        #In order to make it easy to distinguish, make the left yellow and the right blue
        self.left_ql.setStyleSheet("background-color:yellow")
        self.right_wt.setStyleSheet("background-color:blue")

        #A horizontal dynamic layout is made, which divides the window into ten parts in total, with eight in the middle
        main_layout = QHBoxLayout()
        main_layout.addWidget(self.left_ql,1)
        main_layout.addWidget(self.mid_ql,8)
        main_layout.addWidget(self.right_wt,1)
        main_layout.setContentsMargins(0,0,0,0)#Border is 0
        main_layout.setSpacing(0)#Control interval is 0
        self.setLayout(main_layout)

        #Instantiate the custom class MyDataFigure and pass in two control parameters, which can be modified by yourself
        self.canvas_data = MyDataFigure(self.left_ql,self.mid_ql)
        #Embed class into QLabel control
        self.hboxlayout = QHBoxLayout(self.mid_ql)
        self.hboxlayout.addWidget(self.canvas_data)
        #Set border to 0
        self.hboxlayout.setContentsMargins(0,0,0,0)
        #Adjust the area boundary of the drawing
        self.canvas_data.figs.subplots_adjust(left=0.05, right=1.3, top=0.9, bottom=0.5)


if __name__ == "__main__":
    import sys
    app = QApplication(sys.argv)
    window = Window()
    window.show()
    sys.exit(app.exec_())
My_Class.py
#None of the packages introduced below can be less
import matplotlib
matplotlib.use("Qt5Agg")
from matplotlib.backends.backend_qt5agg import FigureCanvasQTAgg
import matplotlib.pyplot as plt
from matplotlib.figure import Figure
from PyQt5.Qt import *

#Package required for drawing
import matplotlib.colors as colors#colour
import cartopy.feature as cfeature#Map loading
import cartopy.crs as ccrs#Projection mode
from cartopy.mpl.gridliner import LATITUDE_FORMATTER, LONGITUDE_FORMATTER#Longitude latitude conversion
import matplotlib.ticker as mticker#x. Y-axis scale display


import numpy as np

from read_mdfs import MDFS_Grid#Reading grid data using
from scipy.interpolate import interpolate#interpolation


#The class needed to embed the interface is inherited from figurecanvasqtag
class MyDataFigure(FigureCanvasQTAgg):
    #Constructor
    #The first two parameters QL, mid_ QL is two QLabel controls. It is not necessary. It is added by the author. One is used to display the longitude and latitude of the mouse, and the other is used to make the mouse press to change the shape. Similarly, you can write any parameters you need to pass in__ init__ () medium
    def __init__(self, ql ,mid_ql,width=100, height=100, dpi=30):
        self.figs = Figure(figsize=(width, height), dpi=dpi)
        super(MyDataFigure, self).__init__(self.figs)#None of the preceding codes should be missing, and the class name should be consistent
        plt.rcParams['font.sans-serif'] = ['SimHei']#Solve Chinese character garbled code
        plt.rcParams['axes.unicode_minus'] = False#The negative sign is not displayed
        print('Created successfully')#Now you can start drawing
        self.ql = ql
        self.mid_ql = mid_ql


        # self.extent = [70,140,20,60]#It shows the area of 70-140 east longitude and 20-60 north latitude
        #Central longitude 70:40 7:4 [70140,20,60]
        self.lon_mid = 105
        #Longitude span
        self.lon_span = 35
        #Central latitude
        self.lat_mid = 40
        #Latitude span
        self.lat_span = 20
        self.extent = [self.lon_mid - self.lon_span, self.lon_mid + self.lon_span, self.lat_mid - self.lat_span, self.lat_mid+self.lat_span]


        self.axes_map = self.figs.add_axes([0.03, 0, 0.94, 0.95], projection=ccrs.PlateCarree())#Create subgraph, normal projection
        self.axes_map.set_extent(self.extent,crs=ccrs.PlateCarree())#Set range, normal projection

        #Read CN border la Dat file
        with open('CN-border-La.dat') as src:
            context = src.read()
            blocks = [cnt for cnt in context.split('>') if len(cnt) > 0]
            self.borders = [np.fromstring(block, dtype=float, sep=' ') for block in blocks]
        self.refresh_map()
        self.flg = {
            'HGT':False,
            'RH':False,
            'TMP':False,
            'UGRD':False,
            'VGRD':False
        }
        #Mouse movement
        self.figs.canvas.mpl_connect('motion_notify_event',self.fun_motion_event)
        #Mouse down
        self.figs.canvas.mpl_connect('button_press_event',self.fun_button_press)
        #Mouse release
        self.figs.canvas.mpl_connect('button_release_event',self.fun_button_release)
        #Mouse wheel
        self.figs.canvas.mpl_connect('scroll_event',self.fun_scroll_event)
        #Create latitude grid
        self.lon = np.arange(60.0,150.01,0.25)
        self.lat = np.arange(0,60.1,0.25)
        self.lon_scipy = np.arange(60.0,150.01,0.05)
        self.lat_scipy = np.arange(0,60.1,0.05)
        self.olon , self.olat= np.meshgrid(self.lon_scipy,self.lat_scipy)
        #Read data
        self.read_data(r'D:\project\readEC\21010308\ECMWF_HR_HGT_500_21010308.003','HGT')
        self.read_data(r'D:\project\readEC\21010308\ECMWF_HR_TMP_500_21010308.003','TMP')
        self.read_data(r'D:\project\readEC\21010308\ECMWF_HR_RH_500_21010308.003','RH')
        self.read_data(r'D:\project\readEC\21010308\ECMWF_HR_UGRD_500_21010308.003','UGRD')
        self.read_data(r'D:\project\readEC\21010308\ECMWF_HR_VGRD_500_21010308.003','VGRD')
        self.axes_data = self.figs.add_axes([0.03, 0, 0.94, 0.95],projection=ccrs.PlateCarree())
        self.drow()


    #Data reading method, the first parameter is the path, and the second is the data type
    def read_data(self,filepath,data_type):
        if data_type == 'HGT':
            a = MDFS_Grid(filepath)
            self.data_hgt = a.data['Grid']
            spline_hgt = interpolate.RectBivariateSpline(self.lat, self.lon,self.data_hgt,)
            self.data_hgt = spline_hgt(self.lat_scipy,self.lon_scipy)
            self.data_hgt = self.data_hgt[::-1,:]
            self.flg['HGT'] = True
        if data_type == 'RH':
            a = MDFS_Grid(filepath)
            data_rh = a.data['Grid']
            spline_rh = interpolate.RectBivariateSpline(self.lat, self.lon,data_rh,)
            data_rh = spline_rh(self.lat_scipy,self.lon_scipy)
            e = (data_rh <= 100)
            data_rh  = np.where(e,data_rh,100.0)
            e = (data_rh >= 70)
            self.data_rh  = np.where(e,data_rh,np.nan)
            self.data_rh = self.data_rh[::-1,:]
            self.flg['RH'] = True
        if data_type == 'TMP':
            a = MDFS_Grid(filepath)
            self.data_tmp = a.data['Grid']
            spline_tmp = interpolate.RectBivariateSpline(self.lat, self.lon,self.data_tmp,)
            self.data_tmp = spline_tmp(self.lat_scipy,self.lon_scipy)
            self.data_tmp = self.data_tmp[::-1,:]
            self.flg['TMP'] = True#'UGRD')VGRD
        if data_type == 'UGRD':
            a = MDFS_Grid(filepath)
            self.data_u = a.data['Grid']
            self.data_u = self.data_u[::-1,:]
            self.flg['UGRD'] = True
        if data_type == 'VGRD':
            a = MDFS_Grid(filepath)
            self.data_v = a.data['Grid']
            self.data_v = self.data_v[::-1,:]
            self.flg['VGRD'] = True
    def drow(self):
        self.axes_data.set_extent(self.extent,crs=ccrs.PlateCarree())
        gl = self.axes_data.gridlines(crs=ccrs.PlateCarree(), draw_labels=True, linewidth=3, color='k', alpha=0.5,linestyle='--')
        gl.xformatter = LONGITUDE_FORMATTER ##Convert coordinate scale to latitude and longitude style
        gl.yformatter = LATITUDE_FORMATTER
        if int(self.lon_span/5)==0 or int(self.lat_span/5) == 0:
            gl.xlocator = mticker.FixedLocator(np.arange(self.extent[0], self.extent[1], 1))
            gl.ylocator = mticker.FixedLocator(np.arange(self.extent[2], self.extent[3], 1))
        else:
            gl.xlocator = mticker.FixedLocator(np.arange(self.extent[0], self.extent[1], int(self.lon_span/5)))
            gl.ylocator = mticker.FixedLocator(np.arange(self.extent[2], self.extent[3], int(self.lat_span/5)))


        gl.xlabel_style={'size':35}
        gl.ylabel_style={'size':35}

        if self.flg['HGT'] or self.flg['RH'] or self.flg['TMP'] or (self.flg['UGRD'] and self.flg['VGRD']):
            if self.flg['HGT']:
                ct_hgt = self.axes_data.contour(self.lon_scipy,self.lat_scipy,self.data_hgt,10,colors='black',linewidths=5)
                self.axes_data.clabel(ct_hgt, inline=True, fontsize=30,fmt='%d')
            if self.flg['TMP']:
                ct_tmp = self.axes_data.contour(self.lon_scipy,self.lat_scipy,self.data_tmp,10,colors='red',linewidths=4)
                self.axes_data.clabel(ct_tmp, inline=True, fontsize=30,fmt='%.1f')
            if self.flg['RH']:
                clevs = [70.,80.,85.,90.,95.,100.]#Custom color list
                cdict = ['#d8d8d8','#b8b8b8','#989898','#707070','#505050']#Custom color list
                my_cmap = colors.ListedColormap(cdict)#Custom palette
                norm = colors.BoundaryNorm(clevs,my_cmap.N)#normalization
                cf_rh = self.axes_data.contourf(self.lon_scipy,self.lat_scipy,self.data_rh,clevs,transform=ccrs.PlateCarree(),cmap=my_cmap,norm =norm)
            if self.flg['UGRD'] and self.flg['VGRD']:
                self.axes_data.barbs(self.lon[::10],self.lat[::10], self.data_u[::10,::10],self.data_v[::10,::10],barbcolor=['b'],linewidth=3, length=10, barb_increments=dict(half=2, full=4, flag=20))
    def fun_motion_event(self,event):
        if event.button == 1:#1 means the left key is pressed all the time
            str111 = 'X=' + str(event.xdata) + '\n' +  'Y=' + str(event.ydata)
            self.ql.setText(str111)#The QLabel control passed in at the beginning of the constructor displays the latitude and longitude of the mouse
            move_lon = int(event.xdata) - self.mouse_press_lon#Calculate longitude movement
            move_lat = int(event.ydata) - self.mouse_press_lat#Calculate latitude movement
            self.lon_mid = self.lon_mid - move_lon#Display center modification
            self.lat_mid = self.lat_mid - move_lat#Modify display area center
            self.extent = [self.lon_mid - self.lon_span, self.lon_mid + self.lon_span, self.lat_mid - self.lat_span, self.lat_mid+self.lat_span]#Modify display area
            self.extent = self.check_extent(self.extent)#set up
            self.axes_map.cla()  # Clear drawing area
            self.axes_data.cla()  # Clear drawing area
            self.refresh_map()#Refresh map
            self.drow()#refresh data
            self.figs.canvas.draw()  # Notice here that the canvas is redrawn, self figs. canvas
            self.figs.canvas.flush_events()  # Canvas refresh self figs. canvas
    def fun_button_press(self,event):
        if event.button == 1:
            str111 = 'X=' + str(event.xdata) + '\n' +  'Y=' + str(event.ydata)
            self.ql.setText(str111)#Display latitude and longitude
            self.mid_ql.setCursor(Qt.SizeAllCursor)#The mouse changes shape when pressed
            self.mouse_press_lon = int(event.xdata)#Record the longitude when the mouse is pressed
            self.mouse_press_lat = int(event.ydata)#Record the latitude when the mouse is pressed
    def fun_button_release(self,event):
        self.mid_ql.unsetCursor()#Release the mouse to reset the shape
    def fun_scroll_event(self,event):
            if event.button == 'up':#[70,140,20,60]
                if  self.lon_span >=14 and self.lat_span >=8:
                    self.lon_span -=7
                    self.lat_span -= 4
                    self.lon_mid = int(event.xdata)
                    self.lat_mid = int(event.ydata)
                    self.extent = [self.lon_mid - self.lon_span, self.lon_mid + self.lon_span, self.lat_mid - self.lat_span, self.lat_mid+self.lat_span]
                    self.extent = self.check_extent(self.extent)
                    self.axes_map.cla()  # Clear drawing area
                    self.axes_data.cla()  # Clear drawing area
                    self.refresh_map()
                    self.drow()
                    self.figs.canvas.draw()  # Notice here that the canvas is redrawn, self figs. canvas
                    self.figs.canvas.flush_events()  # Canvas refresh self figs. canvas
            if event.button == 'down':  #35  20
                if  self.lon_span <=28 and self.lat_span <=16:
                    self.lon_span +=7
                    self.lat_span += 4
                    self.lon_mid = int(event.xdata)
                    self.lat_mid = int(event.ydata)
                    self.extent = [self.lon_mid - self.lon_span, self.lon_mid + self.lon_span, self.lat_mid - self.lat_span, self.lat_mid+self.lat_span]
                    self.extent = self.check_extent(self.extent)
                    self.axes_map.cla()  # Clear drawing area
                    self.axes_data.cla()  # Clear drawing area
                    self.refresh_map()
                    self.drow()
                    self.figs.canvas.draw()  # Notice here that the canvas is redrawn, self figs. canvas
                    self.figs.canvas.flush_events()  # Canvas refresh self figs. canvas
    def refresh_map(self):
            self.axes_map.set_extent(self.extent,crs=ccrs.PlateCarree())
            # Draw borders
            for line in self.borders:
                self.axes_map.plot(line[0::2], line[1::2], '-', color='gray',transform=ccrs.PlateCarree())
            #Draw the sea with cartopy's own map
            self.axes_map.add_feature(cfeature.OCEAN.with_scale('110m'))
            #Using cartopy's own land map
            self.axes_map.add_feature(cfeature.LAND.with_scale('110m'))
            # #Using cartopy's own map of rivers
            self.axes_map.add_feature(cfeature.RIVERS.with_scale('110m'))
            #Using cartopy's own map of lakes
            self.axes_map.add_feature(cfeature.LAKES.with_scale('110m'))
    def check_extent(self,extent):
        if extent[3] >= 90:
            extent[3] = 90
            extent[2] = 90 - 2*self.lat_span
        if extent[2] <= -90:
            extent[2] = -90
            extent[3] = -90 + 2*self.lat_span
        if extent[0] <= -180:
            extent[0] = -180
            extent[1] = -180 +2*self.lon_span
        if extent[1] >= 180:
            extent[1] = 180
            extent[0] = 180-2*self.lon_span
        return extent
maskout.py
from matplotlib.collections import LineCollection
from shapefile import Reader

def readshapefile(shapefile,drawbounds=True,zorder=None,
                      linewidth=0.5,color='k',ax=None,city = None
                      ):
    shf = Reader(shapefile, encoding='utf-8')
    coords = []
    shptype = shf.shapes()[0].shapeType
    for shprec in shf.shapeRecords():
        shp = shprec.shape
        if shptype != shp.shapeType:
            raise ValueError('readshapefile can only handle a single shape type per file')
        if shptype not in [1,3,5,8]:
            raise ValueError('readshapefile can only handle 2D shape types')
        verts = shp.points
        if shptype in [1,8]: # a Point or MultiPoint shape.
            lons, lats = list(zip(*verts))
                # if latitude is slightly greater than 90, truncate to 90
            lats = [max(min(lat, 90.0), -90.0) for lat in lats]
            if len(verts) > 1: # MultiPoint
                x,y = lons, lats
                coords.append(list(zip(x,y)))
            else: # single Point
                x,y = lons[0], lats[0]
                coords.append((x,y))
        else: # a Polyline or Polygon shape.
            parts = shp.parts.tolist()
            for indx1,indx2 in zip(parts,parts[1:]+[len(verts)]):
                lons, lats = list(zip(*verts[indx1:indx2]))
                    # if latitude is slightly greater than 90, truncate to 90
                lats = [max(min(lat, 90.0), -90.0) for lat in lats]
                x, y = lons, lats
                coords.append(list(zip(x,y)))
        # draw shape boundaries for polylines, polygons  using LineCollection.
    if shptype not in [1,8] and drawbounds:
            # get current axes instance (if none specified).
        ax = ax
        lines = LineCollection(coords,antialiaseds=(1,))
        lines.set_color(color)
        lines.set_linewidth(linewidth)
        if zorder is not None:
            lines.set_zorder(zorder)
        ax.add_collection(lines)

        if city != None:
            line = LineCollection(coords[4:5],antialiaseds=(1,))
            line.set_color('r')
            line.set_linewidth(2)
            ax.add_collection(line)
read_mdfs.py
import struct
import datetime
import numpy as np
class MDFS_Grid:
    def __init__(self, filepath):
        f = open(filepath, 'rb')
        if f.read(4).decode() != 'mdfs':
            raise ValueError('Not valid mdfs data')
        self.datatype = struct.unpack('h', f.read(2))[0]
        self.model_name = f.read(20).decode('gbk').replace('\x00', '')
        self.element = f.read(50).decode('gbk').replace('\x00', '')
        self.data_dsc = f.read(30).decode('gbk').replace('\x00', '')
        self.level = struct.unpack('f', f.read(4))
        year, month, day, hour, tz = struct.unpack('5i', f.read(20))
        self.utc_time = datetime.datetime(year, month, day, hour) - datetime.timedelta(hours=tz)
        self.period = struct.unpack('i', f.read(4))
        start_lon, end_lon, lon_spacing, lon_number = struct.unpack('3fi', f.read(16))
        start_lat, end_lat, lat_spacing, lat_number = struct.unpack('3fi', f.read(16))
        lon_array = np.arange(start_lon, end_lon + lon_spacing, lon_spacing)
        lat_array = np.arange(start_lat, end_lat + lat_spacing, lat_spacing)
        isoline_start_value, isoline_end_value, isoline_space = struct.unpack('3f', f.read(12))
        f.seek(100, 1)
        block_num = lat_number * lon_number
        data = {}
        data['Lon'] = lon_array
        data['Lat'] = lat_array
        if self.datatype == 4:
            # Grid form
            grid = struct.unpack('{}f'.format(block_num), f.read(block_num * 4))
            grid_array = np.array(grid).reshape(lat_number, lon_number)
            data['Grid'] = grid_array
        elif self.datatype == 11:
            # Vector form
            norm = struct.unpack('{}f'.format(block_num), f.read(block_num * 4))
            angle = struct.unpack('{}f'.format(block_num), f.read(block_num * 4))
            norm_array = np.array(norm).reshape(lat_number, lon_number)
            angle_array = np.array(angle).reshape(lat_number, lon_number)
            # Convert stupid self-defined angle into correct direction angle
            corr_angle_array = 270 - angle_array
            corr_angle_array[corr_angle_array < 0] += 360
            data['Norm'] = norm_array
            data['Direction'] = corr_angle_array
        self.data = data