1, Code
from matplotlib import pyplot as plt
from matplotlib import font_manager
#Set the value of x, y
x1=[-7,-4,-1,0,3,5,7,9,12,15,16,17]
y1=[12,13,15,17,23,11,13,26,99,10,12,36]
y2=[-12,73,-15,7,13,33,12,36,9,11,1,7]

#Set the size and pixels of the instance fig
fig = plt.figure(figsize=(30,10),dpi=300)

#Import windows fonts
font = font_manager.FontProperties(fname='C:/Windows/Fonts/msyh.ttc',size=20)

#Set the legend name, color, transparency, width, shape, size, color and edge color of the break point. Here, the shape is*
plt.plot(x1,y1,label='Key 1',color='orange',alpha=1,linewidth=3,marker='*',markersize=30,markerfacecolor='red',markeredgecolor='purple',markeredgewidth=5)
plt.plot(x1,y2,label='Key 2',color='green',alpha=1,linewidth=3,marker='o',markersize=20,markerfacecolor='purple',markeredgecolor='red',markeredgewidth=5)

#Set the display of the legend in Chinese
plt.legend(prop=font,loc='upper right')

#Set the grid of the diagram, x hide, and only display the grid lines in the vertical direction, as well as the style, transparency and width of the grid lines
plt.grid(axis='x',color='red',alpha=0.5,linestyle='--',linewidth=1)


#Set the maximum value on the left of the x-axis to - 2, hide the right and upper coordinate axes, and overlap the 0 points of the left and lower coordinate axes to form a new coordinate axis
plt.xlim(left=-2)
ax = plt.gca()
ax.spines['right'].set_color('none')
ax.spines['top'].set_color('none')
ax.spines['bottom'].set_color('blue')
ax.spines['left'].set_color('blue')
ax.spines['bottom'].set_position(('data',0))
ax.spines['left'].set_position(('data',0))

#Set the scale of x-axis and y-axis, display Chinese, and rotate 30 degrees
x=[-8,-6,-4,-2,0,2,4,6,8,10,12,14,16,18]
y=[0,10,20,30,40,50,60,70,80,90,100]
x_ticks_label = ["{}degree".format(i) for i in x]
plt.xticks(x,x_ticks_label,fontproperties=font)
y_ticks_label = ["{}individual".format(i) for i in y]
plt.yticks(y,y_ticks_label,fontproperties=font)

#Set x-axis label
plt.xlabel('temperature',fontproperties=font)

#Display the x and y values of the broken line and broken point corresponding to legend 1, the position of coordinate annotation, font linetype and font color and outline display
for a,b in zip(x1,y1):
    plt.annotate('(%s,%s)'%(a,b),xy=(a,b),xytext=(10,10),textcoords='offset points',weight='heavy',color='#0926f1', bbox=dict(boxstyle='round,pad=0.5', fc='yellow', ec='k', lw=1, alpha=0.5))
#Display the coordinates, vertical alignment, horizontal alignment, font size, font background color, rotation angle and transparency of the broken line and broken point corresponding to legend 2
for a,b in zip(x1,y2):
    plt.text(a,b,(a,b),ha='left',va='top',fontsize=12,color='#0926f1',backgroundcolor='yellow',rotation=3,alpha=0.5)
#Save the generated picture
plt.savefig('D:/tools/Git/data-analysis-learning-route/Fundamentals of data analysis/python/python Basic grammar/Examples.png')
plt.show()
2, Result display
3, Matplotlib diagram component - Official
4, jupyter Notebook get function and its parameter usage
For example: get the usage of abs function and parameters. After entering, click Run, or press Shift+Tab at the cursor position
abs?
5, Detailed explanation of common parameters of code functions and classes
1,plt.figure() parameter
plt.figure(num=None, figsize=None, dpi=None, facecolor=None, edgecolor=None, frameon=True)
- num: number or string. The number is used as the id. if the id does not exist in advance, a new figure will be added and the number will be increased in order. If the id exists, the reference to the image will be returned. The string is the window title
- figsize: Inch unit, (width, height)
- dpi: set image resolution
- facecolor: background color
- edgecolor: border color
- frameon: whether to display border
2,font_manager.FontProperties() parameter
font_manager.FontProperties(family=None,style=None,variant=None,weight=None,stretch=None,size=None,fname=None)
- family: font category. The default value is sans serif. Others include serif, cursive, fantasy and monospace
- Style: the font style. The default is normal. Others include italic and oblique
- variant: normal by default, and small caps (small uppercase font) for others
- weight: the thickness of the font, which is expressed in a numerical value of 0-1000. It can also be expressed in another way. The default is normal. Others are ultralight, light, regular, book, medium, roman, semibold, demibold, demi, bold, heavy, extra bold, black
- Stretch: stretch of font, expressed in numerical value of 0-1000. It can also be expressed in another way: Ultra condensed, extra condensed, condensed, semi condensed, normal, semi expanded, expanded, extra expanded, ultra expanded
- Size: font size. The default is 10. Use numbers or XX small, x-small, small, medium, large, x-large, XX Large
- fname: specify a specific font through the absolute path of the font file, which is generally the font of windows
3,plt.plot() parameter
plt.plot(*args, scalex=True, scaley=True, data=None, **kwargs)
For users, such as me, a rookie, this may be too abstract. Even though he added several parameters later, my use is mainly focused on the attribute settings of some of my commonly used 2D drawings. I learned to use word to make tables more clear here
-
x. y: X is optional. If it is not written, it is entered according to the length range of y by default
-
alpha: `: transparency
-
animated: Boolean type, a parameter of dynamic drawing
-
Color: color, which can be abbreviated to c
-
Label: Legend label
-
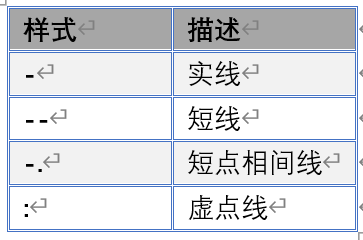
linestyle: line style, which can be abbreviated as ls. There are several types:
-
linewidth: the width of the line, floating-point type, which can be abbreviated as lw
-
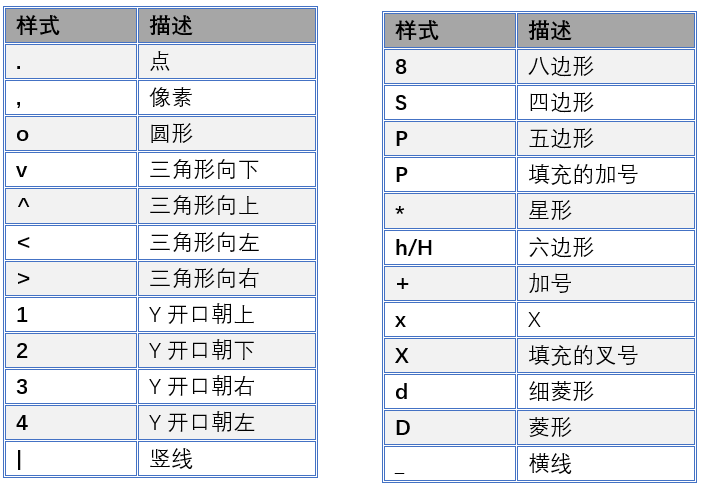
marker: the styles of break points are as follows:
-
Marked edge color: the edge color of the break point, which can be abbreviated as mec:
-
Marked edge width: the size of the edge of the break point, which can be abbreviated as mew
-
Marker color: break point color, which can be abbreviated as mfc
-
Marker size: break point size, which can be abbreviated as ms
4,plt.legend() parameter
plt.legend(*args, **kwargs)
- labels: contents of legend, list
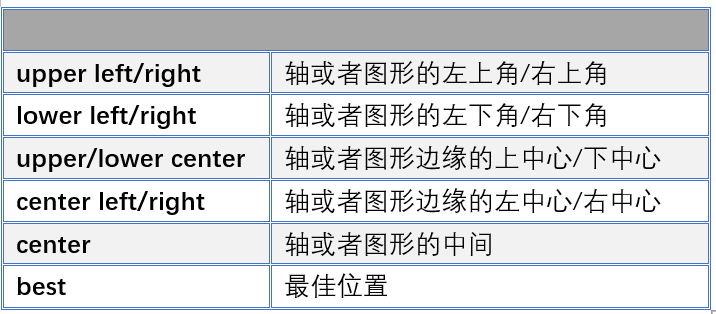
- loc: sets the location of the legend. There are the following types:
- bbox_to_anchor: Specifies the location of the legend in the axis / drawing
- ncol: the number of legend columns. The default value is 1
- prop: when there is a value, it is the font obtained. When there is no value, it is generally used by matplotli. Here, insert the code slice b.rc function to obtain the font
- fontsize: font size. When it is a numerical value, it is in points. Generally, XX small, X-Small, small, medium, large, X-LARGE, XX Large are used when prop is not specified
- shadow: whether to add shadows after the legend
- framealpha: sets the transparency of the legend frame
- Title: Legend title, none by default
- title_fontsize: Legend title font size
- borderpad: the inner margin of the legend border, floating point type
- Label spacing: vertical spacing between legend entries
- handlelength: the length of the legend handle
- handletextpad: the gap between the legend handle and the text
- Borderlaxespad: the distance between the axis and the legend border
5,plt.grid() parameter
plt.grid(b=None, which='major', axis='both', **kwargs)