Visualization and graph analysis of dependency parsing in natural language processing (NLP)
Although the effect of dependency parsing is not as good as that of word segmentation and NER, it also has its use value. In our daily work, we have to deal with it. How to analyze the results of dependency parsing, an important aspect is its visualization and its graph analysis.
The NLP tools we use are jieba and LTP. jieba is used for word segmentation and LTP is used for part of speech tagging and syntactic analysis. You need to download pos.model and parser Model file.
The example sentences used in this article are:
On July 26, 2018, Ren Zhengfei, founder of Huawei, held an award ceremony to Professor Eldar, the father of 5G Polar code, in recognition of his contribution to the communication field.
First, let's take a look at the parsing results before there is no visualization effect. Python code is as follows:
import os
import jieba
from pyltp import Postagger, Parser

sent = '2018 On July 26, 2006, Ren Zhengfei, founder of Huawei, told 5 G Polarization code( Polar Professor Eldar, the father of code), held an award ceremony to recognize his contribution to the field of communication.'

jieba.add_word('Polar code')
jieba.add_word('5G Polarization code')
jieba.add_word('Eldar')
jieba.add_word('Father of')
words = list(jieba.cut(sent))

print(words)

# Part of speech tagging
pos_model_path = os.path.join(os.path.dirname(__file__), 'pos.model')
postagger = Postagger()
postagger.load(pos_model_path)
postags = postagger.postag(words)

# dependency parsing
par_model_path = os.path.join(os.path.dirname(__file__), 'parser.model')
parser = Parser()
parser.load(par_model_path)
arcs = parser.parse(words, postags)

rely_id = [arc.head for arc in arcs]  # Extract dependent parent node id
relation = [arc.relation for arc in arcs]  # Extract dependencies
heads = ['Root' if id == 0 else words[id - 1] for id in rely_id]  # Match dependent parent node words

for i in range(len(words)):
    print(relation[i] + '(' + words[i] + ', ' + heads[i] + ')')
Operation results:
['2018', 'year', '7', 'month', '26', 'day', ',', 'Huawei', 'founder', 'Ren Zhengfei', 'towards', '5G Polarization code', '(', 'Polar code', ')', 'Father of', 'Eldar', 'professor', 'hold', 'awarding ceremony', ',', 'Commend', 'his', 'about', 'signal communication', 'field', 'do', 'of', 'contribution', '. ']
ATT(2018, year)
ATT(year, day)
ATT(7, month)
ATT(month, day)
ATT(26, day)
ADV(day, hold)
WP(,, day)
ATT(Huawei, founder)
ATT(founder, Ren Zhengfei)
SBV(Ren Zhengfei, hold)
ADV(towards, hold)
ATT(5G Polarization code, Father of)
WP((, Polar code)
COO(Polar code, 5G Polarization code)
WP(), Polar code)
ATT(Father of, Eldar)
ATT(Eldar, professor)
POB(professor, towards)
HED(hold, Root)
VOB(awarding ceremony, hold)
WP(,, hold)
COO(Commend, hold)
ATT(his, contribution)
ADV(about, do)
ATT(signal communication, field)
POB(field, about)
ATT(do, contribution)
RAD(of, do)
VOB(contribution, Commend)
WP(. , hold)
We get the result of dependency parsing of the sentence, but its visualization effect is not good.
We use the above syntax analysis tool (graph8195z) to get the following results:
from graphviz import Digraph

g = Digraph('Test picture')

g.node(name='Root')
for word in words:
    g.node(name=word)

for i in range(len(words)):
    if relation[i] not in ['HED']:
        g.edge(words[i], heads[i], label=relation[i])
    else:
        if heads[i] == 'Root':
            g.edge(words[i], 'Root', label=relation[i])
        else:
            g.edge(heads[i], 'Root', label=relation[i])

g.view()
The visual syntactic analysis of dependency is as follows:
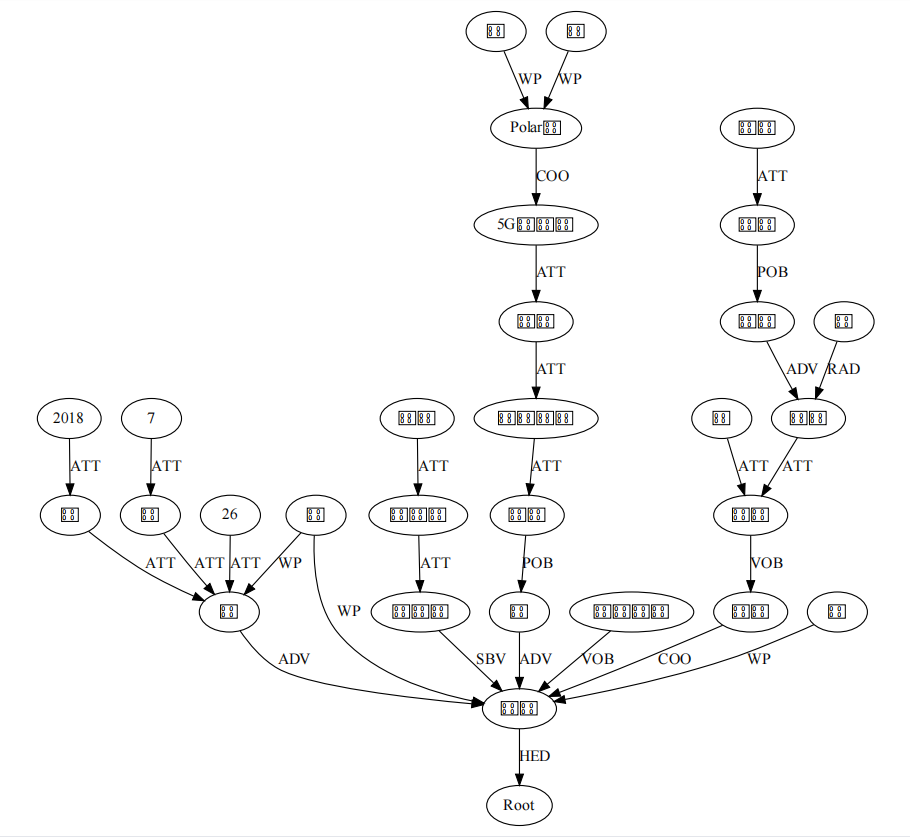
At this time, there is a problem of Chinese garbled code, mostly because fontname is not set to support Chinese display. Just put fontname="Microsoft YaHei" in node or edge to display normally
from graphviz import Digraph

g = Digraph('Test picture')

g.node(name='Root')
for word in words:
    g.node(name=word, fontname="Microsoft YaHei")

for i in range(len(words)):
    if relation[i] not in ['HED']:
        g.edge(words[i], heads[i], label=relation[i])
    else:
        if heads[i] == 'Root':
            g.edge(words[i], 'Root', label=relation[i])
        else:
            g.edge(heads[i], 'Root', label=relation[i])

g.view()
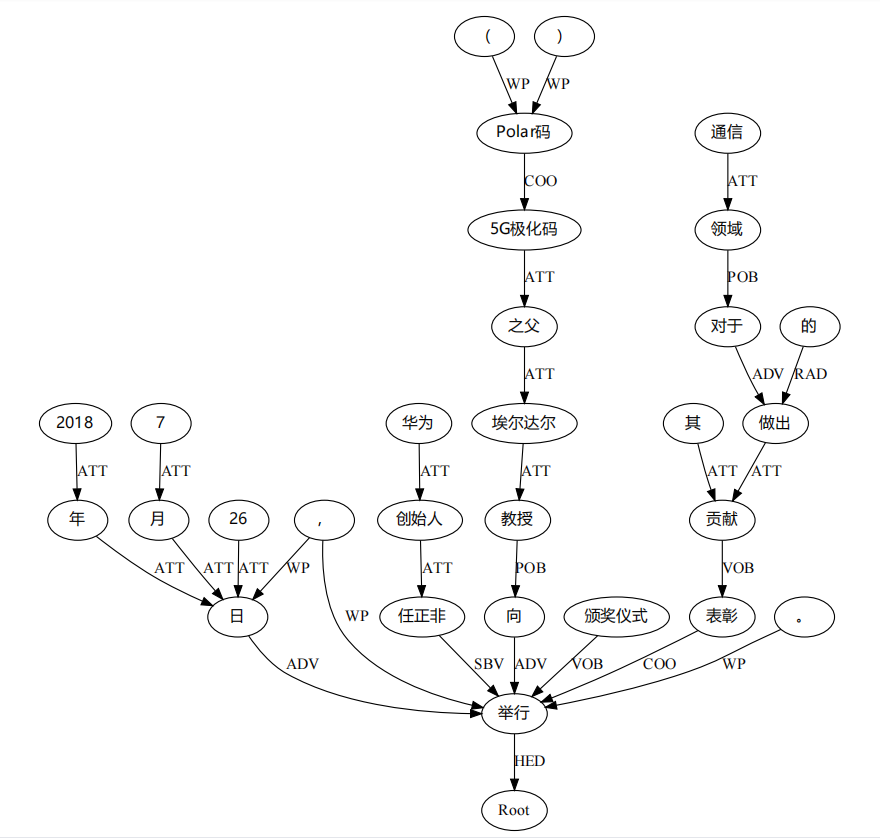
In this picture, we have an intuitive feeling of the dependency parsing results, and the effect is also very good. Unfortunately, we can't analyze the Graph formed by the above visualization results, because Graphviz is just a visualization tool. So, what kind of tool should we use for Graph analysis?
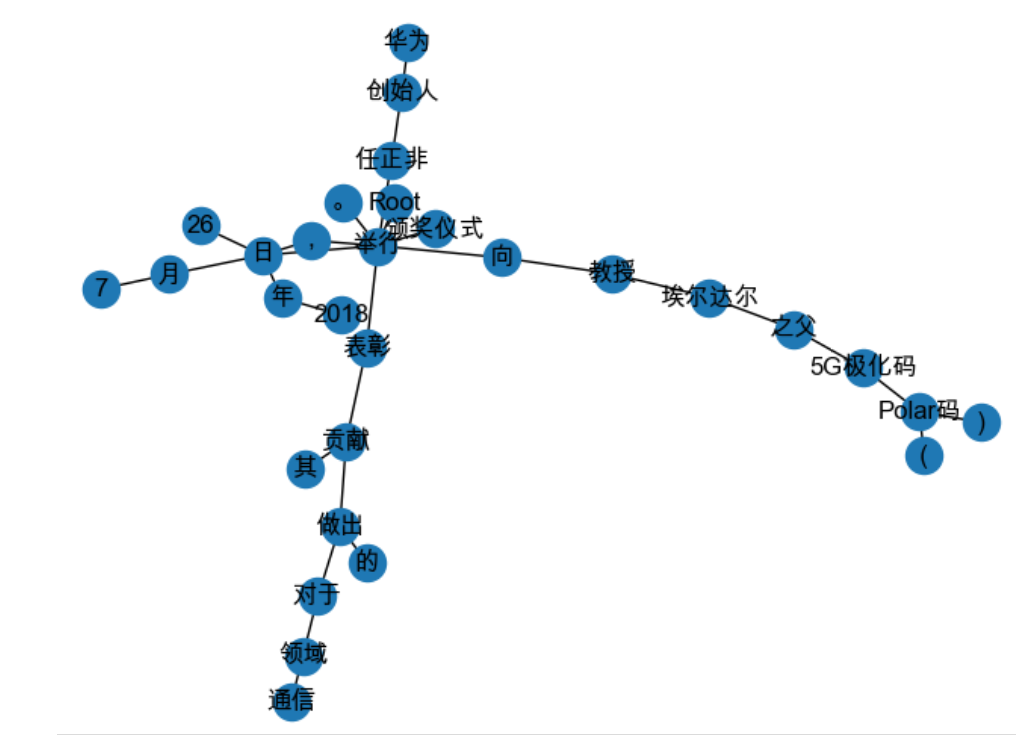
The answer is NetworkX. The following is a demonstration of the visualization and graph analysis of NetworkX applied to dependency parsing, in which graph analysis shows the shortest path between two nodes. The Python code of the example is as follows:
# Drawing parsing results using networkx
import networkx as nx
import matplotlib.pyplot as plt
from pylab import mpl

mpl.rcParams['font.sans-serif'] = ['Arial Unicode MS']  # Specifies the default font

G = nx.Graph()  # Establish undirected graph G

# Add node
for word in words:
    G.add_node(word)

G.add_node('Root')

# Add edge
for i in range(len(words)):
    G.add_edge(words[i], heads[i])

source = '5G Polarization code'
target1 = 'Ren Zhengfei'
distance1 = nx.shortest_path_length(G, source=source, target=target1)
print("'%s'And'%s'The shortest distance in the dependency parsing graph is:  %s" % (source, target1, distance1))

target2 = 'Eldar'
distance2 = nx.shortest_path_length(G, source=source, target=target2)
print("'%s'And'%s'The shortest distance in the dependency parsing graph is:  %s" % (source, target2, distance2))

nx.draw(G, with_labels=True)
plt.savefig("undirected_graph.png")
Operation results:
'5G Polarization code'And'Ren Zhengfei'The shortest distance in the dependency parsing graph is:  6
'5G Polarization code'And'Eldar'The shortest distance in the dependency parsing graph is:  2
The obtained visual images are as follows:
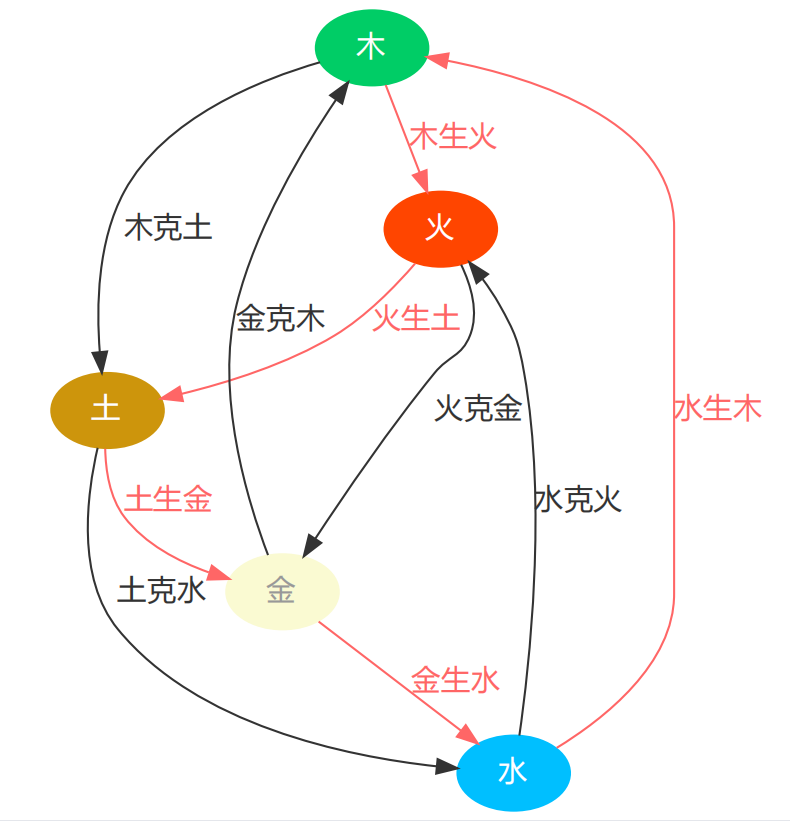
graphviz Chinese garbled code, color and other attribute settings:
from graphviz import Digraph

digraph = Digraph("Chinese pictures")

digraph.node(name="a", label="wood", color="#00CD66", style="filled", fontcolor="white", fontname="Microsoft YaHei")
digraph.node(name="b", label="fire", color="#FF4500", style="filled", fontcolor="white", fontname="Microsoft YaHei")
digraph.node(name="c", label="Soil", color="#CD950C", style="filled", fontcolor="white", fontname="Microsoft YaHei")
digraph.node(name="d", label="gold", color="#FAFAD2", style="filled", fontcolor="#999999", fontname="Microsoft YaHei")
digraph.node(name="e", label="water", color="#00BFFF", style="filled", fontcolor="white", fontname="Microsoft YaHei")

digraph.edge("a", "b", label="Wood makes fire", color="#FF6666", fontcolor="#FF6666", fontname="Microsoft YaHei")
digraph.edge("b", "c", label="Pyrogenic soil", color="#FF6666", fontcolor="#FF6666", fontname="Microsoft YaHei")
digraph.edge("c", "d", label="Native gold", color="#FF6666", fontcolor="#FF6666", fontname="Microsoft YaHei")
digraph.edge("d", "e", label="Jin Shengshui", color="#FF6666", fontcolor="#FF6666", fontname="Microsoft YaHei")
digraph.edge("e", "a", label="Aquatic wood", color="#FF6666", fontcolor="#FF6666", fontname="Microsoft YaHei")

digraph.edge("a", "c", label="Muketu", color="#333333", fontcolor="#333333", fontname="Microsoft YaHei")
digraph.edge("c", "e", label="Tuke water", color="#333333", fontcolor="#333333", fontname="Microsoft YaHei")
digraph.edge("e", "b", label="Water conquers fire", color="#333333", fontcolor="#333333", fontname="Microsoft YaHei")
digraph.edge("b", "d", label="Huokejin", color="#333333", fontcolor="#333333", fontname="Microsoft YaHei")
digraph.edge("d", "a", label="Jin Kemu", color="#333333", fontcolor="#333333", fontname="Microsoft YaHei")

digraph.view()
Operation results: