I am 3y, with one year of CRUD experience and ten years of markdown programmer 👨🏻💻 It is known as a high-quality eight part essay player all the year round
Two days ago, I posted an article on data link tracking, leaving TODO at the end: the servers running applications are generally clusters, and the log data will be recorded on different machines. Troubleshooting and locating problems can only be viewed by logging in to each server.
Let's talk about this topic today.
00. Why do you need a distributed log component?
Before the article starts, I'd like to share a system I've been responsible for before. Its architecture is as follows:
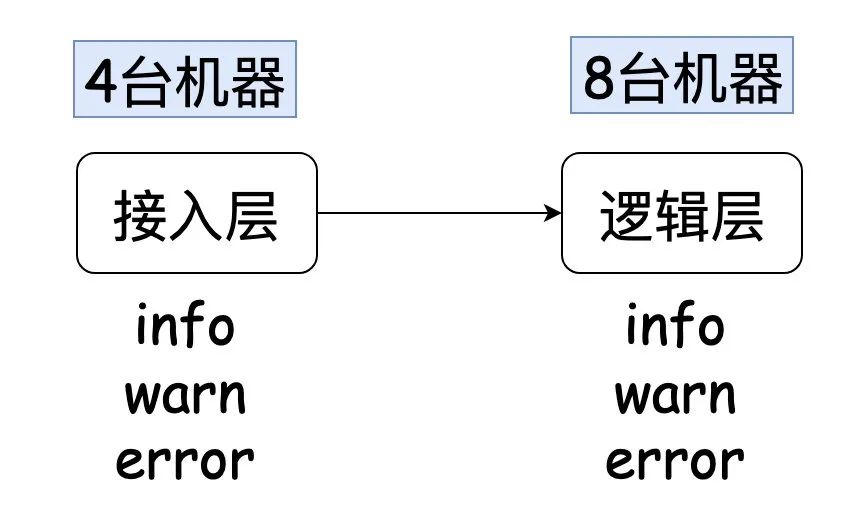
Every time I check a problem, I may be able to initially locate the problem at the logic layer, but in order to explain it to the business party, I need to show it to the evidence business party (log information is hard evidence).
A request must be processed by one of the eight machines, but I don't know which one it is. Therefore, I need a log of grep on each machine, and then I can find the corresponding log to prove my analysis.
Sometimes, it is very likely that the access layer also needs to participate together. It is silly to check a problem (you need to log in to many servers to check the logs).
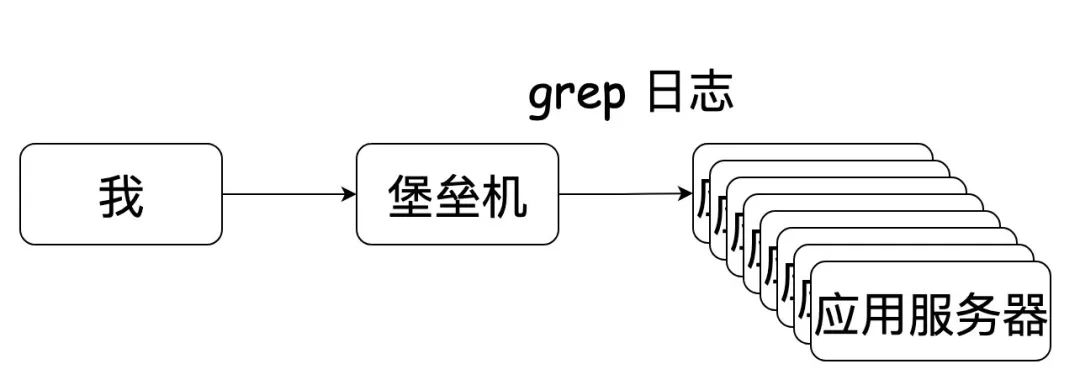
Later, I saw the operation of my colleagues (write a script in item2: quickly log in to the fortress machine (without entering account and password information), cut the window according to the number of application servers and switch to the corresponding log directory). To put it bluntly, it is to log in to multiple application servers with one click. Well, the speed of checking logs is much faster than before.
Later, the company's operation and maintenance side mainly pushed to log in to the application server on the Web page (automatically log in to the fortress machine), which can eliminate the need to write scripts (support batch operation). But from the experience at that time, I didn't use item2 to access smoothly (I always felt stuck).
However, there are still problems, because we often don't know which file is in info/warn/error. Many times, you can only check one file by one, although you can check it directly. If the log is too large, it will bring pause time, which is also very annoying.
Once the system is asked about business problems, the frequency of checking logs is too high. So when I was planning a Q, I wanted to write the log information into the search engine and learn the knowledge of search engine by the way. Then the plan was seen by a big man in the group and commented below: why don't you try grayog?
The original group itself maintains a log framework, but I don't know So I connected to the Graylog log, and my work efficiency was improved. With this thing, I blew a Q.
I haven't logged in to the application server since I accessed it. Once I almost couldn't write grep.
01. Lightweight ELK (grayog)
Speaking of ELK, I've heard of it even if I haven't used it. It's really popular in the back end. This time austin accesses a relatively lightweight ELK framework: grayog
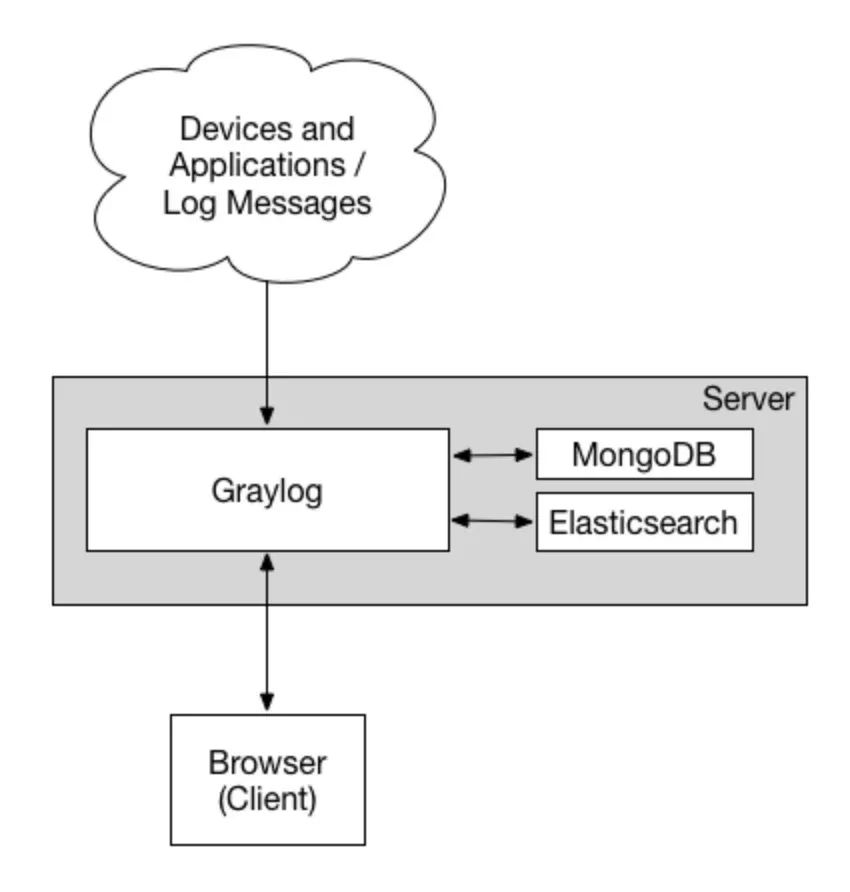
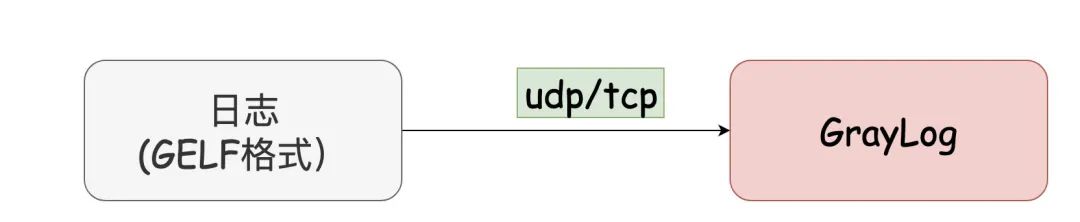
I feel that this framework is very easy to use. As a user, it is extremely simple to access (I guess the operation and maintenance should also be very simple. Many use Graylog to send UDP directly to the Server without installing an agent on the machine to collect logs)
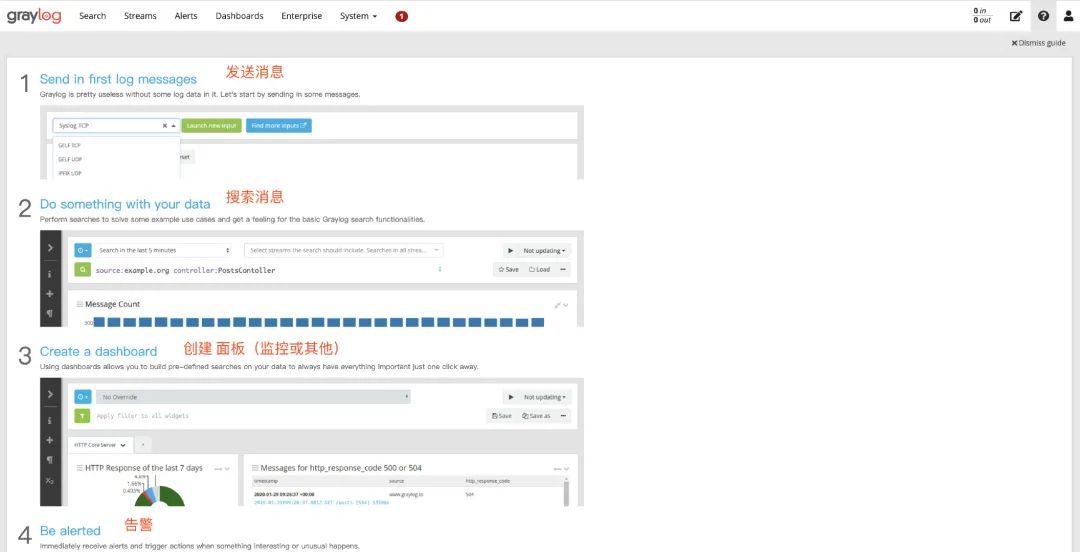
One picture wins ten words:
Official documents: https://docs.graylog.org/docs
As far as I know, quite a number of enterprises use it to view logs and business monitoring alarms. I'll let you experience this article directly.
Deployment, grayog 02
As usual, go directly to docker compose. If you keep following my steps, you should be familiar with it. docker-compose. In fact, I copied the content of YML from the official website. I'd better post it here (you don't have to turn it over)
version: '3'
services:
    mongo:
      image: mongo:4.2
      networks:
        - graylog
    elasticsearch:
      image: docker.elastic.co/elasticsearch/elasticsearch-oss:7.10.2
      environment:
        - http.host=0.0.0.0
        - transport.host=localhost
        - network.host=0.0.0.0
        - "ES_JAVA_OPTS=-Dlog4j2.formatMsgNoLookups=true -Xms512m -Xmx512m"
      ulimits:
        memlock:
          soft: -1
          hard: -1
      deploy:
        resources:
          limits:
            memory: 1g
      networks:
        - graylog
    graylog:
      image: graylog/graylog:4.2
      environment:
        - GRAYLOG_PASSWORD_SECRET=somepasswordpepper
        - GRAYLOG_ROOT_PASSWORD_SHA2=8c6976e5b5410415bde908bd4dee15dfb167a9c873fc4bb8a81f6f2ab448a918
        - GRAYLOG_HTTP_EXTERNAL_URI=http://ip:9009 / # please change the ip address here
      entrypoint: /usr/bin/tini -- wait-for-it elasticsearch:9200 --  /docker-entrypoint.sh
      networks:
        - graylog
      restart: always
      depends_on:
        - mongo
        - elasticsearch
      ports:
        - 9009:9000
        - 1514:1514
        - 1514:1514/udp
        - 12201:12201
        - 12201:12201/udp
networks:
    graylog:
      driver: bridg
The only thing that needs to be changed in this file is ip (the original port is 9000. Since I have occupied 9000 port, I change the port here to 9009. You can change it at will)
Well, after writing docker compose YML file, directly docker compose up -d, and it will start.
After startup, we can access the corresponding Graylog background address through ip:port. The default account and password are admin/admin
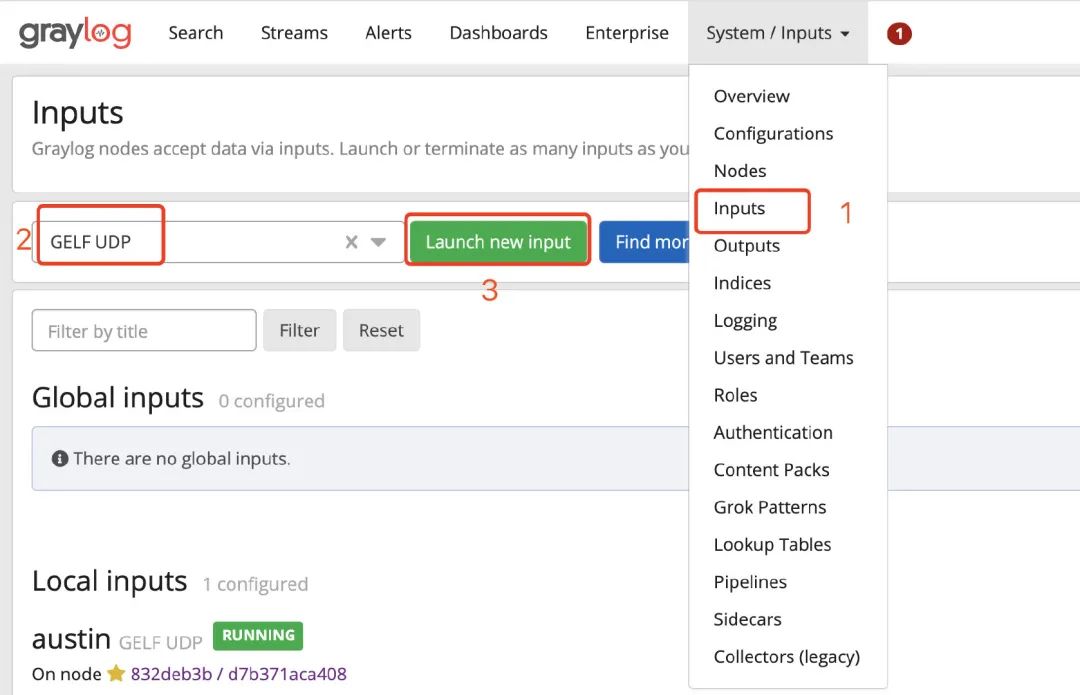
Then, we configure the input configuration, find GELF UDP, and then click Launch new input. Just fill in the Title field and save it (don't touch anything else).
Well, at this point, our GrayLog setting is completed.
03. Spring boot uses GrayLog
Remember the logging framework we used in austin project? Yes, it's logback. To write the log data to Graylog is very simple. It only needs two steps:
1. Import dependency:
<dependency>
  <groupId>de.siegmar</groupId>
  <artifactId>logback-gelf</artifactId>
  <version>3.0.0</version>
</dependency>
2. In logback XML configuration graylog related information:
<appender name="GELF" class="de.siegmar.logbackgelf.GelfUdpAppender">
  <!-- Graylog Address of the service -->
  <graylogHost>ip</graylogHost>
  <!-- UDP Input port -->
  <graylogPort>12201</graylogPort>
  <!-- maximum GELF Data block size (in bytes), 508 is the recommended minimum and 65467 is the maximum -->
  <maxChunkSize>508</maxChunkSize>
  <!-- Use compression -->
  <useCompression>true</useCompression>
  <encoder class="de.siegmar.logbackgelf.GelfEncoder">
    <!-- Send native log information -->
    <includeRawMessage>false</includeRawMessage>
    <includeMarker>true</includeMarker>
    <includeMdcData>true</includeMdcData>
    <includeCallerData>false</includeCallerData>
    <includeRootCauseData>false</includeRootCauseData>
    <!-- Whether to send the name of the log level. Otherwise, the log level is represented by a number by default -->
    <includeLevelName>true</includeLevelName>
    <shortPatternLayout class="ch.qos.logback.classic.PatternLayout">
      <pattern>%m%nopex</pattern>
    </shortPatternLayout>
    <fullPatternLayout class="ch.qos.logback.classic.PatternLayout">
      <pattern>%d - [%thread] %-5level %logger{35} - %msg%n</pattern>
    </fullPatternLayout>

    <!-- Configure the application name (service name) through staticField The tag can customize some fixed log fields -->
    <staticField>app_name:austin</staticField>
  </encoder>
</appender>
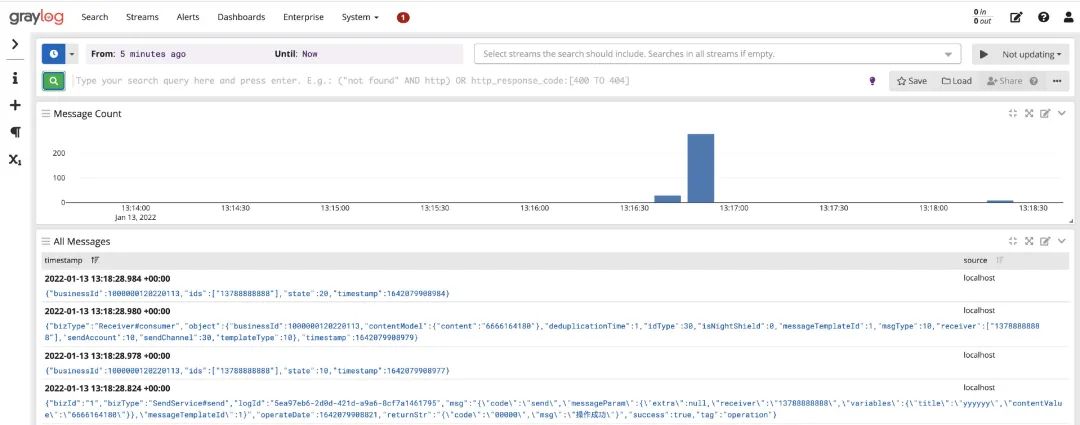
In this configuration information, the only thing that needs to be changed is the ip address. The access is completed here. We can open the console and see the log information.
04. Understand GrayLog
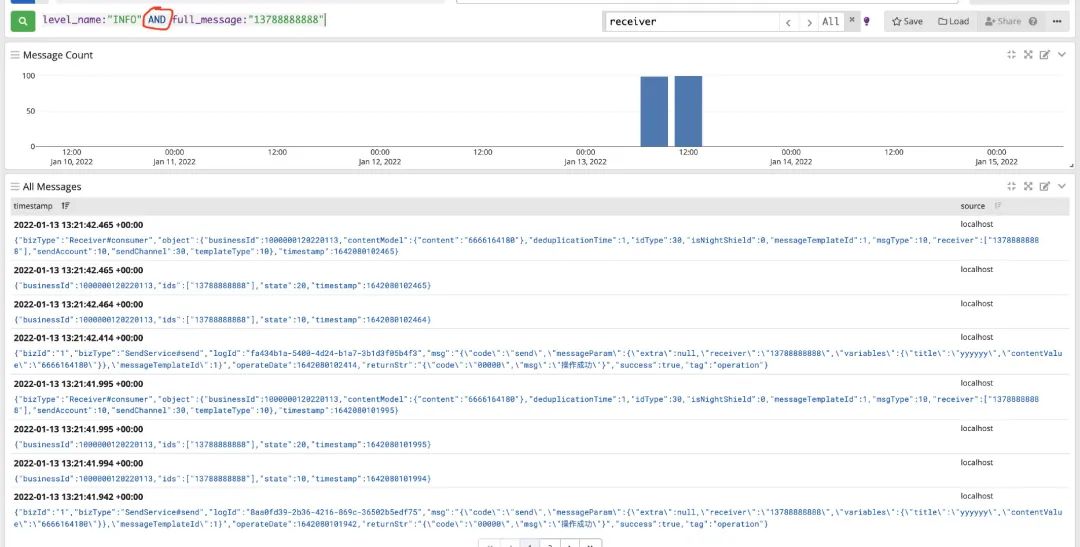
Understand the query syntax of GrayLog: in fact, I use a few for my daily coming and going. Let me show what I usually use. If you don't think it's enough, go to the official website to make a profit: https://docs.graylog.org/docs/query-language
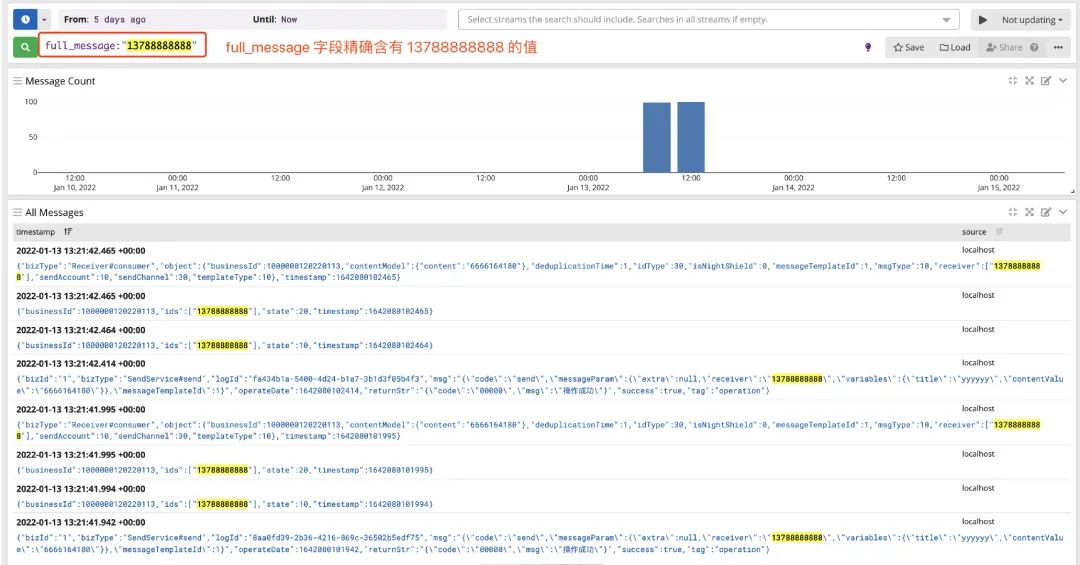
1. Exact query by field: full_message:"13788888888"
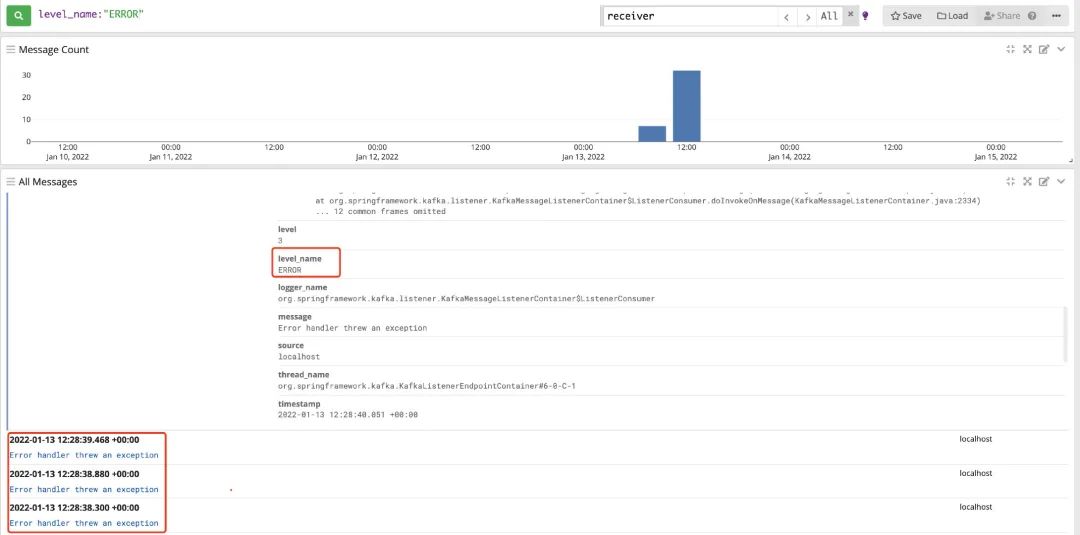
2. Query error log information: level_name:"ERROR"
3. Combined multi field query: level_name:"INFO" AND full_message:"13788888888"
When accessing, careful partners may find that I choose GELF when I Input, and then there is the word GELF when I introduce Maven dependency. What does GELF mean?
The graylog extended log format (gelf) is a log format that avoids the shortcuts of classic plain syslog
Details: https://docs.graylog.org/docs/gelf
GELF is a log format, which can avoid some problems of syslogs in the traditional sense. The Maven dependency we introduced is to format the log into GELF format and then append it to GrayLog.
05. Fan Wai: Swagger
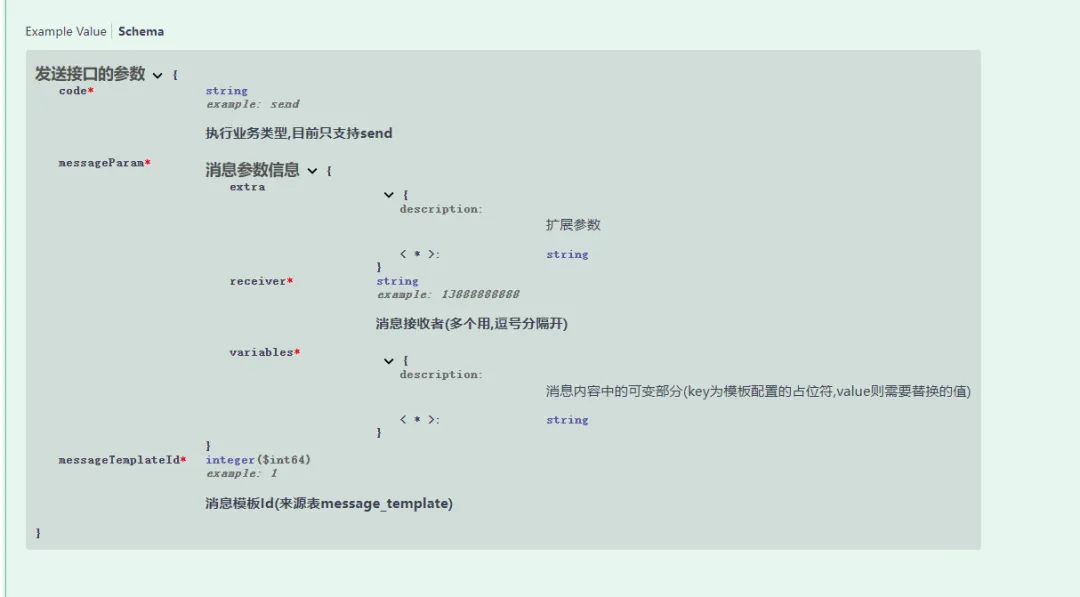
A few days ago, an old man put me a pull request about swagger in GitHub. I merge d him yesterday and upgraded the version of swagger.
I haven't used a document tool like swagger before. I also experienced swagger this time by pulling request.
The first experience is good: it can uniformly manage the document information of all interfaces of the project on one page, and send the request directly through the sample parameters. Write the document by annotation, and don't worry about changing the code and forgetting to update the document.
However, after configuring the corresponding parameter information document, I found it was really ugly after experiencing the swagger ui. Seeing this ui, I'd better give up in stages.
There are several competing products of swagger. I think the ui looks better than swagger. However, there is only one main interface of austin project. As a skilled markdown engineer, I can easily do the document work, so I don't continue to experience other competitive products.
06. Summary
Finally, share a little insight.
A long time ago, I seem to have seen a similar passage: the excellent use of a tool or framework depends on its difficulty in getting started. If a framework takes a long time to understand, it may not do so well.
In fact, I don't often study the details and principles of various frameworks used, and I don't look at the source code blindfolded. There's no need. After all, there's nothing wrong with it.
If a tool framework like GrayLog is not a major maintainer in the company, there is no need to worry too much about its implementation details. We can grasp its design idea as a whole. In my opinion, if you really want to learn, you have to look at its specific storage (such as the principle of elastic search)
Learning should bring benefits (learning can improve efficiency, boast and increase salary in the interview, make yourself happy and pretend to be forced)
Gitee link of Austin project (you can jump to it after reading the original text): https://gitee.com/zhongfucheng/austin
Austin project GitHub link: https://github.com/ZhongFuCheng3y/austin