Hello, I'm Ou K.
The May Day holiday is coming. There is plenty of time for welfare (five-day holiday) this year. How do you want to play such a long holiday?
Play like this?

Still playing like this?

In this issue, we will briefly analyze the distribution of popular scenic spots and national travel in China through the sales of tickets in all provinces of qunar.com, and see which scenic spots are more popular, hoping to help our friends.
Contents involved:
request+json – web page data crawling
openpyxl – save data to Excel
pandas – table data processing
pyechars – data visualization
1. Web page analysis
Open the qunar ticket page: https://piao.qunar.com/ , take Beijing as an example:
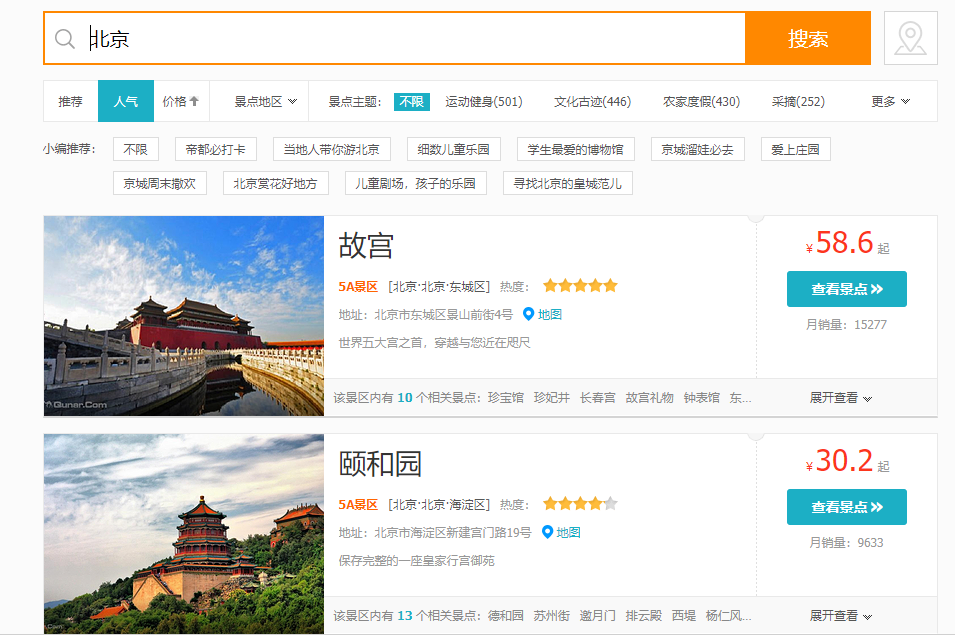
You can see some recommended scenic spot information. F12 open the browser debugging window, find the url of the loaded data, click each page to observe the change of the website:
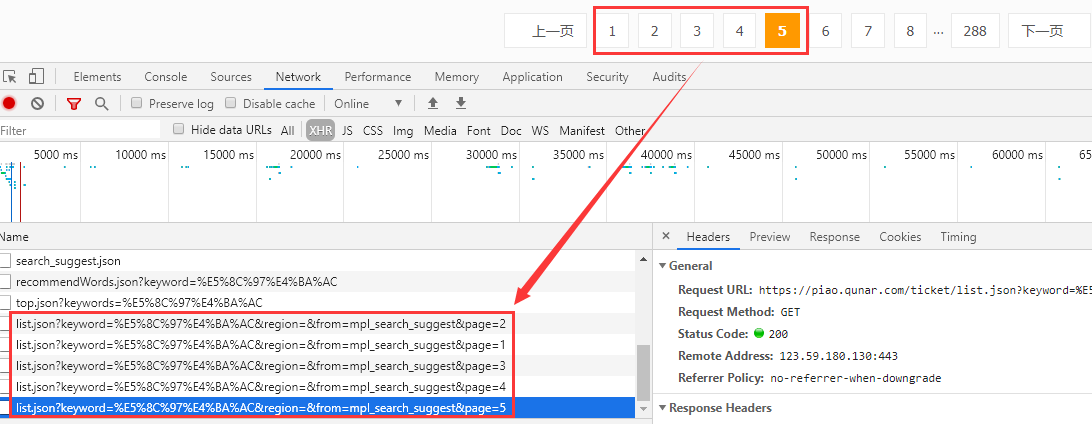
website:
'https://piao.qunar.com/ticket/list.json?keyword=%E5%8C%97%E4%BA%AC®ion=&from=mpl_search_suggest&page=1' 'https://piao.qunar.com/ticket/list.json?keyword=%E5%8C%97%E4%BA%AC®ion=&from=mpl_search_suggest&page=2' 'https://piao.qunar.com/ticket/list.json?keyword=%E5%8C%97%E4%BA%AC®ion=&from=mpl_search_suggest&page=3' 'https://piao.qunar.com/ticket/list.json?keyword=%E5%8C%97%E4%BA%AC®ion=&from=mpl_search_suggest&page=4' 'https://piao.qunar.com/ticket/list.json?keyword=%E5%8C%97%E4%BA%AC®ion=&from=mpl_search_suggest&page=5'
Beijing =% E5%8C%97%E4%BA%AC, it can be seen that only the page value of each page of the website is changing, and the keyword parameter can be written in Chinese directly.
Take a look at the interface return information:
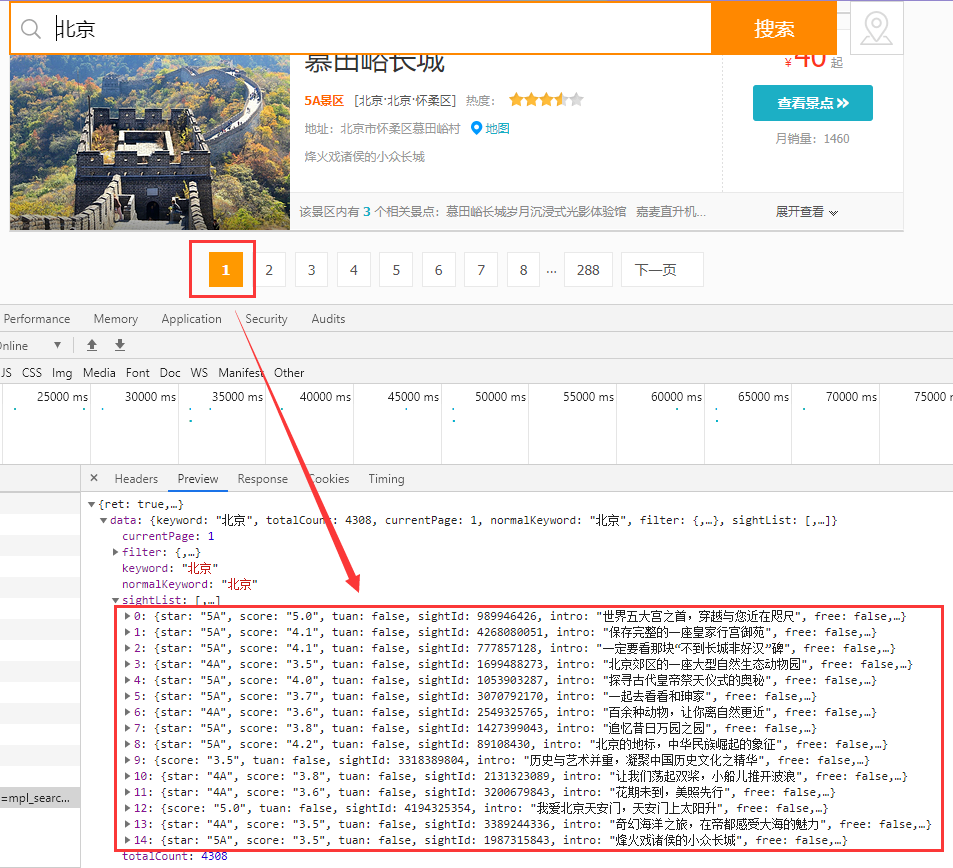
nice! The returned json string is simply not too good!
2. Crawl data
Preparatory work, import the following modules:
import os
import time
import json
import random
import requests
from fake_useragent import UserAgent
from openpyxl import Workbook, load_workbook
If the module is missing, it can be installed directly pip.
2.1 34 Administrative Regions
cities = ['Guangdong', 'Beijing', 'Shanghai', 'Tianjin', 'Chongqing', 'Yunnan', 'Heilongjiang', 'Inner Mongolia', 'Jilin',
          'Ningxia', 'Anhui', 'Shandong', 'Shanxi', 'Sichuan', 'Guangxi', 'Xinjiang', 'Jiangsu', 'Jiangxi',
          'Hebei', 'Henan', 'Zhejiang', 'Hainan', 'Hubei', 'Hunan', 'Macao', 'Gansu',
          'Fujian', 'Tibet', 'Guizhou', 'Liaoning', 'Shaanxi', 'Qinghai', 'Hong Kong', 'Taiwan']
2.2 crawling data of each administrative region
code:
def get_city_scenic(city, page):
ua = UserAgent(verify_ssl=False)
headers = {'User-Agent': ua.random}
url = f'https://piao.qunar.com/ticket/list.json?keyword={city}®ion=&from=mpl_search_suggest&sort=pp&page={page}'
result = requests.get(url, headers=headers, timeout=10)
result.raise_for_status()
return get_scenic_info(city, result.text)
Click "f-string" to refer to the specific usage of this article:
Tips | 5000 words super full parsing Python three formatting output methods [% / format / f-string]
2.3 crawl each page of data
code:
def get_scenic_info(city, response):
    response_info = json.loads(response)
    sight_list = response_info['data']['sightList']
    one_city_scenic = []
    for sight in sight_list:
        scenic = []
        name = sight['sightName'] # Name of scenic spot
        star = sight.get('star', None) # Stars
        score = sight.get('score', 0) # score
        price = sight.get('qunarPrice', 0) # Price
        sale = sight.get('saleCount', 0) # sales volume
        districts = sight.get('districts', None) # Province, city, district
        point = sight.get('point', None) # coordinate
        intro = sight.get('intro', None) # brief introduction
        free = sight.get('free', True) # Is it free
        address = sight.get('address', None) # Specific address
        scenic.append(city)
        scenic.append(name)
        scenic.append(star)
        scenic.append(score)
        scenic.append(price)
        scenic.append(sale)
        scenic.append(districts)
        scenic.append(point)
        scenic.append(intro)
        scenic.append(free)
        scenic.append(address)
        one_city_scenic.append(scenic)
    return one_city_scenic
You can crawl some fields according to your needs.
2.4 cyclic crawling of data on each page of each administrative region
code:
def get_city_info(cities, pages):
    for city in cities:
        one_city_info = []
        for page in range(1, pages+1):
            try:
                print(f'Crawling-{city}(province/city), The first{page}Page attraction data...')
                time.sleep(random.uniform(0.8,1.5))
                one_page_info = get_city_scenic(city, page)
            except:
                continue
            if one_page_info:
                one_city_info += one_page_info
Output some information so that you can easily view the current progress:
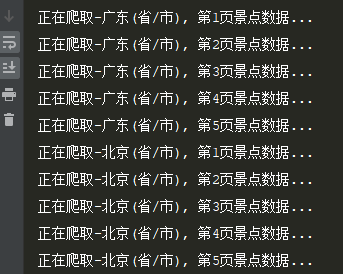
2.5 saving data
Here we use openpyxl to save the data to Excel. You can also try to save it to other files or databases:
def insert2excel(filepath,allinfo):
    try:
        if not os.path.exists(filepath):
            tableTitle = ['city','name','Stars','score','Price','sales volume','province/city/area','coordinate','brief introduction','Is it free','Specific address']
            wb = Workbook()
            ws = wb.active
            ws.title = 'sheet1'
            ws.append(tableTitle)
            wb.save(filepath)
            time.sleep(3)
        wb = load_workbook(filepath)
        ws = wb.active
        ws.title = 'sheet1'
        for info in allinfo:
            ws.append(info)
        wb.save(filepath)
        return True
    except:
        return False
result:

3. Data visualization
3.1 reading data
Import the following modules:
import os
import pandas as pd
from pyecharts.charts import Bar
from pyecharts.charts import Map
from pyecharts import options as opts
Use pandas module to traverse folders and read data:
# Traverse the files in the scene folder
def get_datas():
    df_allinfo = pd.DataFrame()
    for root, dirs, files in os.walk('./scenic'):
        for filename in files:
            try:
                df = pd.read_excel(f'./scenic/{filename}')
                df_allinfo = df_allinfo.append(df, ignore_index=True)
            except:
                continue
    # duplicate removal
    df_allinfo.drop_duplicates(subset=['name'], keep='first', inplace=True)
    return df_allinfo
3.2 data map of popular scenic spots
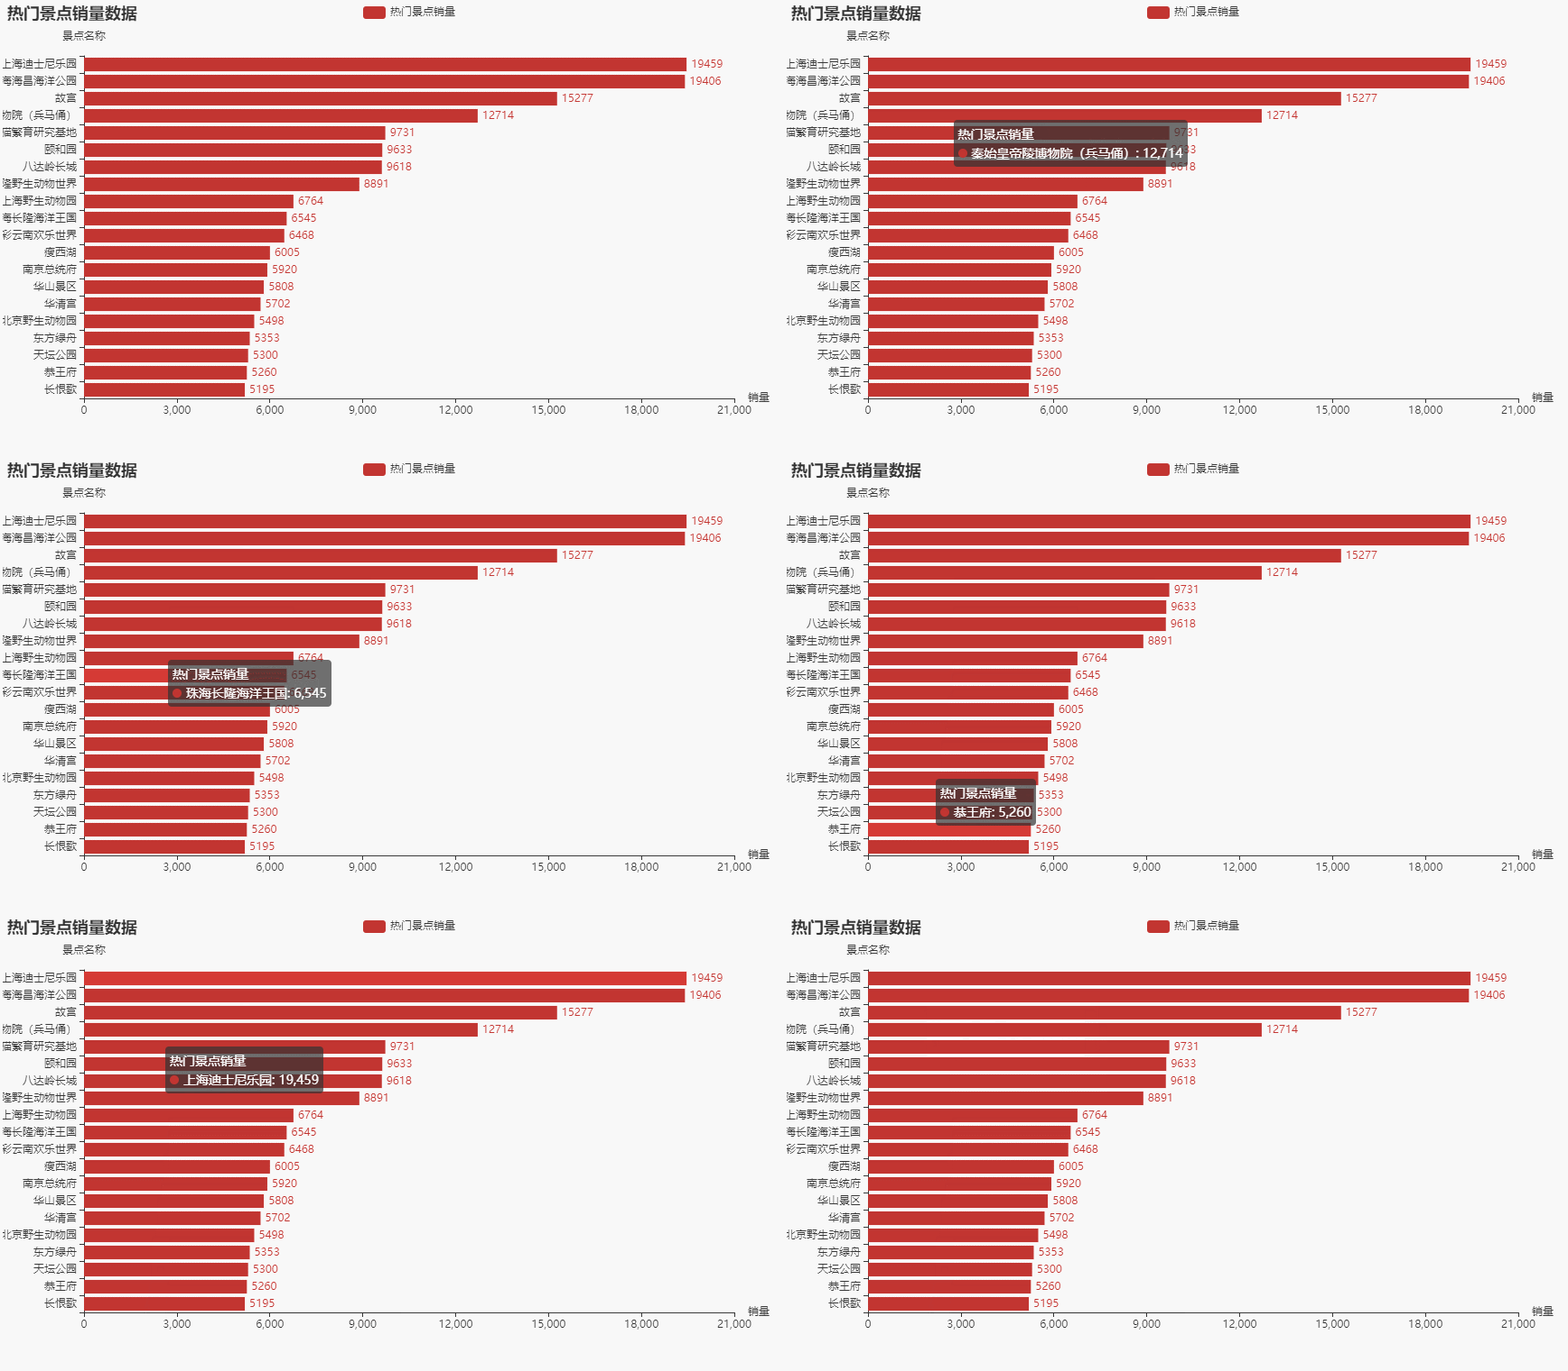
Take the top 20 ticket sales as an example:
def get_sales_bar(data):
    sort_info = data.sort_values(by='sales volume', ascending=True)
    c = (
        Bar()
        .add_xaxis(list(sort_info['name'])[-20:])
        .add_yaxis('Sales volume of popular scenic spots', sort_info['sales volume'].values.tolist()[-20:])
        .reversal_axis()
        .set_global_opts(
            title_opts=opts.TitleOpts(title='Sales data of popular scenic spots'),
            yaxis_opts=opts.AxisOpts(name='Name of scenic spot'),
            xaxis_opts=opts.AxisOpts(name='sales volume'),
            )
        .set_series_opts(label_opts=opts.LabelOpts(position="right"))
        .render('1-Popular scenic spot data.html')
        )
effect:
3.3 holiday travel data map distribution
code:
def get_sales_geo(data):
    df = data[['city','sales volume']]
    df_counts = df.groupby('city').sum()
    c = (
        Map()
        .add('Holiday travel distribution', [list(z) for z in zip(df_counts.index.values.tolist(), df_counts.values.tolist())], 'china')
        .set_global_opts(
        title_opts=opts.TitleOpts(title='Holiday travel data map distribution'),
        visualmap_opts=opts.VisualMapOpts(max_=100000, is_piecewise=True),
        )
        .render('2-Holiday travel data map distribution.html')
    )
effect:
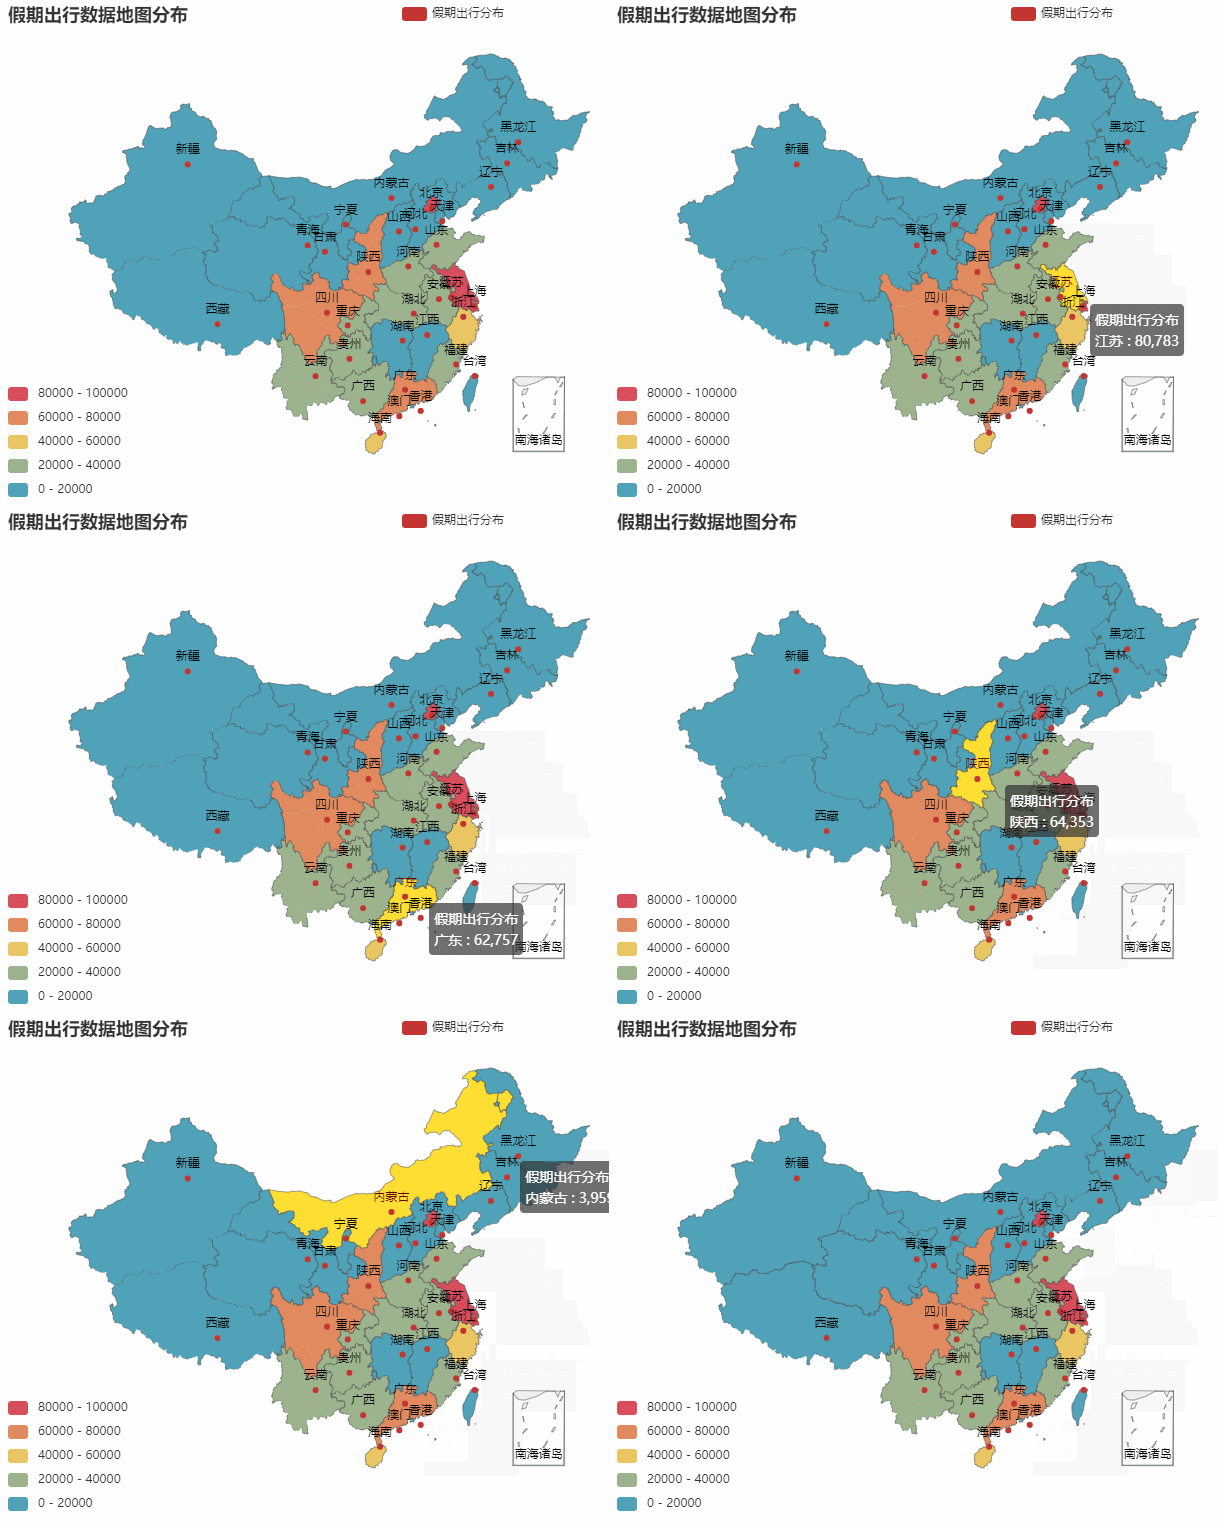
It can be seen that the number of people traveling in Beijing, Shanghai, Jiangsu, Guangdong, Sichuan, Shaanxi and other places is relatively large.
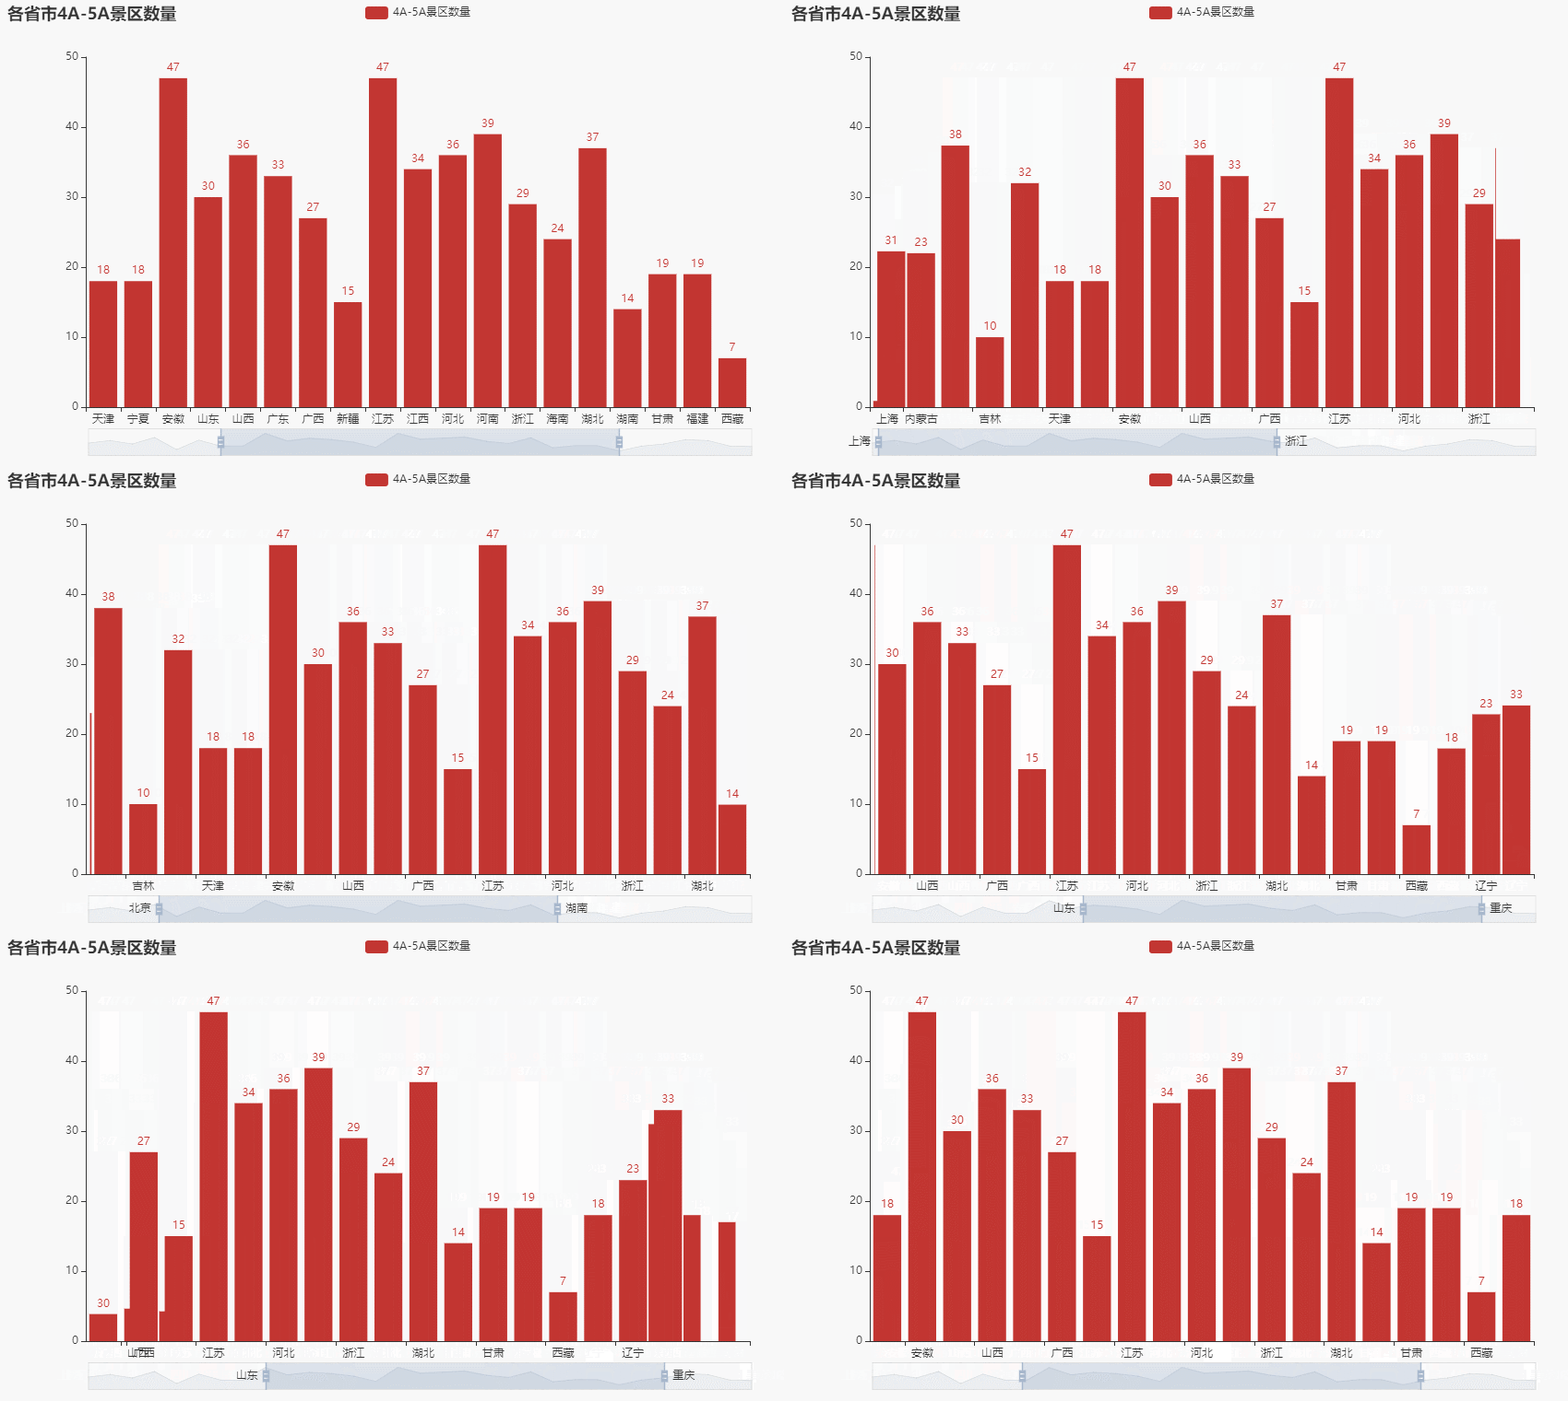
3.4 number of 4A-5A scenic spots in each province
code:
def get_level_counts(data):
    df = data[data['Stars'].isin(['4A', '5A'])]
    df_counts = df.groupby('city').count()['Stars']
    c = (
        Bar()
            .add_xaxis(df_counts.index.values.tolist())
            .add_yaxis('4A-5A Number of scenic spots', df_counts.values.tolist())
            .set_global_opts(
            title_opts=opts.TitleOpts(title='Provinces and cities 4 A-5A Number of scenic spots'),
            datazoom_opts=[opts.DataZoomOpts(), opts.DataZoomOpts(type_='inside')],
        )
        .render('3-Provinces and cities 4 A-5A Number of scenic spots.html')
    )
effect:
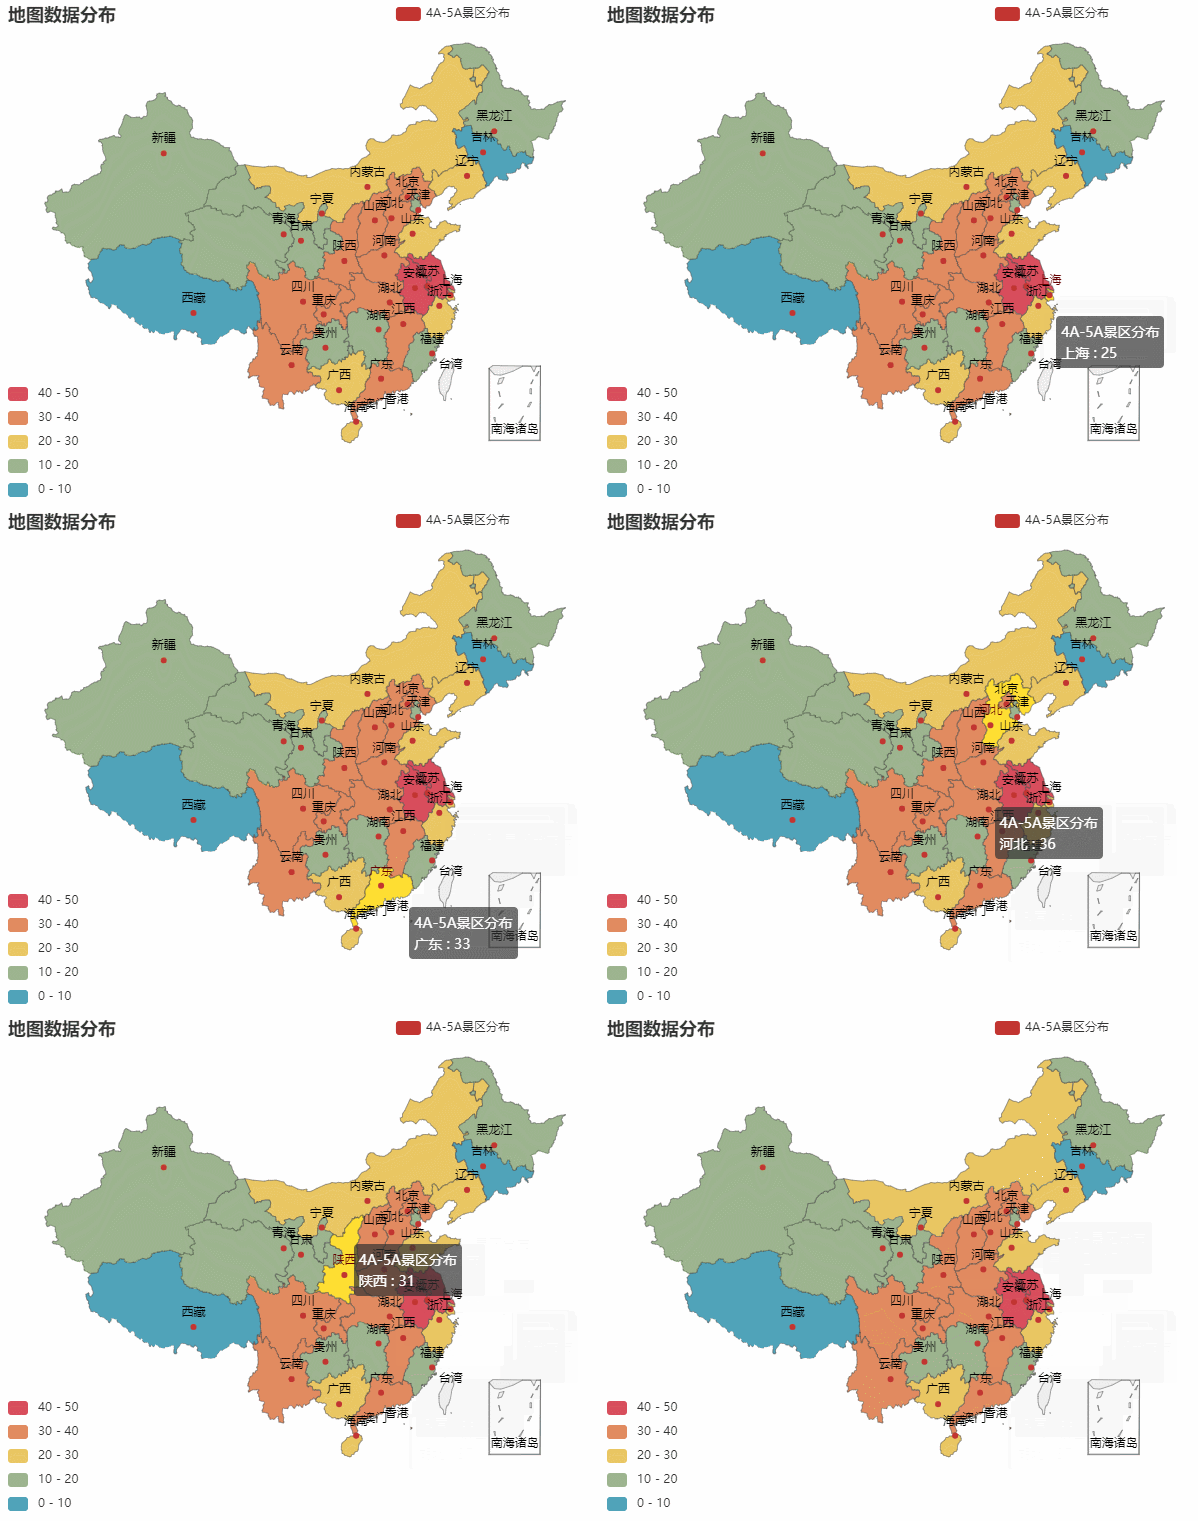
3.5 data map distribution of 4a-5a scenic spots
code:
def get_level_geo(data):
    df = data[data['Stars'].isin(['4A', '5A'])]
    df_counts = df.groupby('city').count()['Stars']
    c = (
        Map()
        .add('4A-5A Scenic spot distribution', [list(z) for z in zip(df_counts.index.values.tolist(), df_counts.values.tolist())], 'china')
        .set_global_opts(
        title_opts=opts.TitleOpts(title='Map data distribution'),
        visualmap_opts=opts.VisualMapOpts(max_=50, is_piecewise=True),
        )
        .render('4-4A-5A Scenic spot data map distribution.html')
    )
effect:
End.
The above is all the content sorted out for you in this issue. Practice it quickly. It's not easy to be original. Friends who like it can praise, collect and share it for more people to know
Recommended reading
Basic | detailed explanation of Python object-oriented
Basic Python functions
Tips | 20 most practical and efficient shortcut keys of pychar (dynamic display)
Tips | Python makes cool pictures of nine squares in the circle of friends
Reptile Python gives you a full set of skin on the official website of King glory
Crawler | one click to download N novels. All you want are free here
Visualization | Python makes the most dazzling 3D visual map
Visualize the moving ranking of Chinese universities and see where your alma mater is
Crawler | Python crawls Douban movie Top250 + data visualization
WeChat official account "Python when the year of the fight", every day, python programming skills push, I hope you can love.
