This paper mainly introduces the implementation steps of using ArcGIS JS API 4.14 and ecarts 4.7.0 to draw the migration map in the two-dimensional chart on the map, including two-dimensional and three-dimensional.
summary
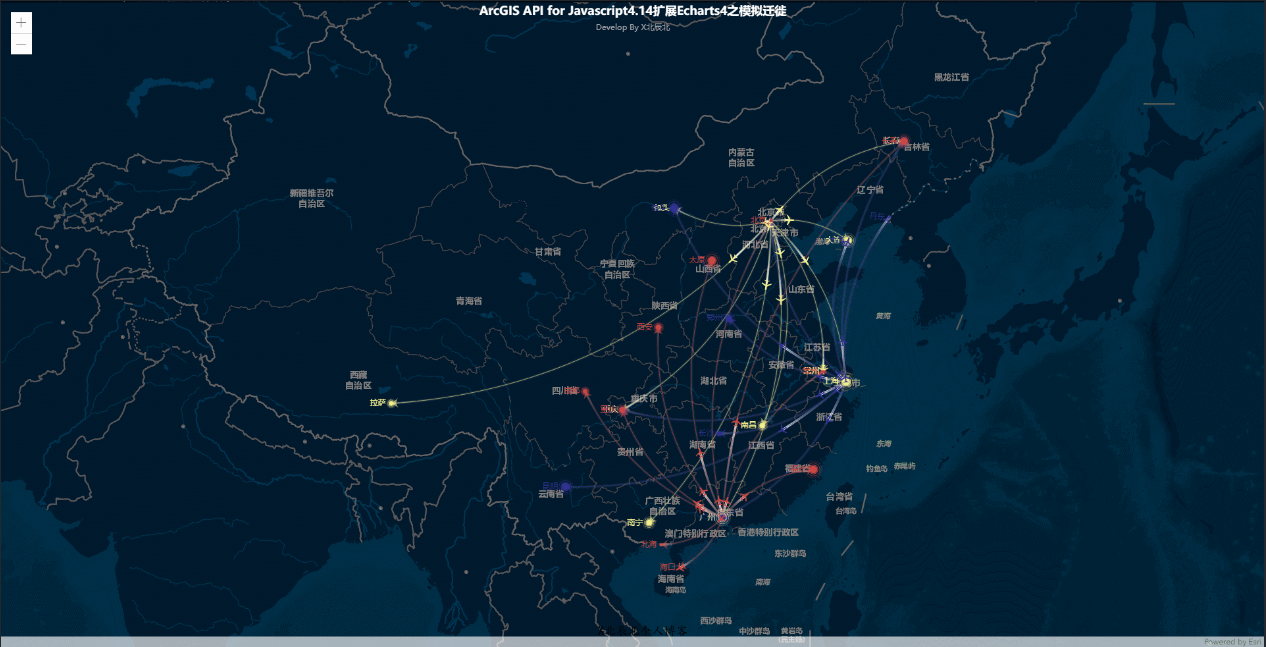
In the previous article, the ordinary two-dimensional chart drawing of ArcGIS JS API and ecarts was realized through the pure front-end method. Because these chart drawing is actually independent of geographical coordinates, it only needs to set the position of the chart, so it is only realized by the pure front-end method. This article is by reference dGIS The article of the boss reconstructs echartslayer JS file (because all the codes about echotslayer.js file on the Internet have been compiled, which is very unfriendly to read, and some echotslayer.js extension files only support ArcGIS JS API version 4.6, and there are still some problems in switching to higher versions such as ArcGIS JS API 4.14), so that it supports the latest versions of ArcGIS API for JavaScript 4.14 and echots 4, It enables it to draw two-dimensional and three-dimensional migration maps on the base map of ArcGIS. Let's take a look at the effect first:
Realization idea
Migration chart and scatter chart are closely related to geographical coordinates, so they cannot be drawn only by two-dimensional ordinary chart. Therefore, we need to expand the relevant functions of ecarts to complete the drawing of such charts on the map in combination with the latest version of ArcGIS JS API. The official website of ecarts also provides corresponding extension plug-ins, However, this plug-in can not well support the high version of our ArcGIS JS API, so we directly extend a layer class in this article. The following is the specific implementation idea: To realize the combination of ArcGIS JS API and ecarts, the key is to realize the coordinate system transformation in the two plug-in libraries. This is the key point. As long as we understand this, we can completely break away from the constraints of map API library and theoretically realize the combination of ecarts and any map library. When converting coordinates here, we use the registerCoordinateSystem method provided by ecarts. Through this method, we register a coordinate system called "arcgis", which rewrites the dataToPoint, pointToData and other methods in ecarts, and then encapsulates all these contents into an ecartslayer layer class. As for the source code of this file, it will be provided at the end of the article. Next, let's take a look at the specific implementation steps.
Implementation steps
1. The demo used in this article is built based on the React framework, so we first build an initialization project based on the React framework, and then rewrite the app in the src directory JS, the main file, instantiates a two-dimensional map, which uses the ESRI loader plug-in. For the specific implementation process, see my article [Fan Wai] ArcGIS JS API 4.14 is used in React , there are specific implementation steps. 2. After instantiating a two-dimensional map through the above operations, we will start to draw the migration map. Before we start, we need some data. First, the coordinates of the provincial capital cities of various administrative divisions used during the migration are a JSON file. The source file is as follows:
let GeoCodingData = {
'Haimen': [121.15, 31.89],
'erdos': [109.781327, 39.608266],
'Zhaoyuan': [120.38, 37.35],
'Zhoushan': [122.207216, 29.985295],
'Qiqihar': [123.97, 47.33],
'ynz ': [120.13, 33.38],
'Chifeng': [118.87, 42.28],
'Qingdao': [120.33, 36.07],
'Rushan': [121.52, 36.89],
'Jinchang': [102.188043, 38.520089],
'Quanzhou': [118.58, 24.93],
'Lacey': [120.53, 36.86],
'sunshine': [119.46, 35.42],
'Jiaonan': [119.97, 35.88],
'Nantong': [121.05, 32.08],
'Lhasa': [91.11, 29.97],
'Yunfu': [112.02, 22.93],
'Meizhou': [116.1, 24.55],
'Wendeng': [122.05, 37.2],
'Shanghai': [121.48, 31.22],
'Panzhihua': [101.718637, 26.582347],
'Weihai': [122.1, 37.5],
'Chengde': [117.93, 40.97],
'Xiamen': [118.1, 24.46],
'Shanwei': [115.375279, 22.786211],
'Chaozhou': [116.63, 23.68],
'Dandong': [124.37, 40.13],
'Taicang': [121.1, 31.45],
'Qu Jing': [103.79, 25.51],
'Yantai': [121.39, 37.52],
'Fuzhou': [119.3, 26.08],
'Wafangdian': [121.979603, 39.627114],
'compound surname': [120.45, 36.38],
'Fushun': [123.97, 41.97],
'Yuxi': [102.52, 24.35],
'Zhangjiakou': [114.87, 40.82],
'Yangquan': [113.57, 37.85],
'Laizhou': [119.942327, 37.177017],
'Huzhou': [120.1, 30.86],
'Shantou': [116.69, 23.39],
'Kunshan': [120.95, 31.39],
'Ningbo': [121.56, 29.86],
'Zhanjiang': [110.359377, 21.270708],
'Jieyang': [116.35, 23.55],
'Rongcheng': [122.41, 37.16],
'Lianyungang': [119.16, 34.59],
'Huludao': [120.836932, 40.711052],
'Changshu': [120.74, 31.64],
'Dongguan': [113.75, 23.04],
'Heyuan': [114.68, 23.73],
'Huai'an': [119.15, 33.5],
'Taizhou': [119.9, 32.49],
'Nanning': [108.33, 22.84],
'Yingkou': [122.18, 40.65],
'Huizhou': [114.4, 23.09],
'Jiangyin': [120.26, 31.91],
'Penglai': [120.75, 37.8],
'Shaoguan': [113.62, 24.84],
'Jiayuguan': [98.289152, 39.77313],
'Guangzhou': [113.23, 23.16],
'Yan'an': [109.47, 36.6],
'Taiyuan': [112.53, 37.87],
'Qingyuan': [113.01, 23.7],
'Zhongshan': [113.38, 22.52],
'Kunming': [102.73, 25.04],
'Shouguang': [118.73, 36.86],
'Panjin': [122.070714, 41.119997],
'CiH ': [113.08, 36.18],
'Shenzhen': [114.07, 22.62],
'Zhuhai': [113.52, 22.3],
'Suqian': [118.3, 33.96],
'Xianyang': [108.72, 34.36],
'Tongchuan': [109.11, 35.09],
'Evenness': [119.97, 36.77],
'Foshan': [113.11, 23.05],
'Haikou': [110.35, 20.02],
'Jiangmen': [113.06, 22.61],
'Zhang Qiu': [117.53, 36.72],
'Zhaoqing': [112.44, 23.05],
'Dalian': [121.62, 38.92],
'Linfen': [111.5, 36.08],
'Wujiang': [120.63, 31.16],
'Shizuishan': [106.39, 39.04],
'Shenyang': [123.38, 41.8],
'Suzhou': [120.62, 31.32],
'Maoming': [110.88, 21.68],
'Jiaxing': [120.76, 30.77],
'Changchun': [125.35, 43.88],
'Jiaozhou': [120.03336, 36.264622],
'Yinchuan': [106.27, 38.47],
'Zhangjiagang': [120.555821, 31.875428],
'Sanmenxia': [111.19, 34.76],
'Jinzhou': [121.15, 41.13],
'Nanchang': [115.89, 28.68],
'city in Guangxi': [109.4, 24.33],
'Sanya': [109.511909, 18.252847],
'Zigong': [104.778442, 29.33903],
'Jilin': [126.57, 43.87],
'Yangjiang': [111.95, 21.85],
'Luzhou': [105.39, 28.91],
'Xining': [101.74, 36.56],
'Yibin': [104.56, 29.77],
'Hohhot': [111.65, 40.82],
'Chengdu': [104.06, 30.67],
'da tong': [113.3, 40.12],
'Zhenjiang': [119.44, 32.2],
'Guilin': [110.28, 25.29],
'Zhangjiajie': [110.479191, 29.117096],
'Yixing': [119.82, 31.36],
'the north sea': [109.12, 21.49],
'Xi'an': [108.95, 34.27],
'Jintan': [119.56, 31.74],
'doy ': [118.49, 37.46],
'Mudanjiang': [129.58, 44.6],
'Zunyi': [106.9, 27.7],
'Shaoxing': [120.58, 30.01],
'Yangzhou': [119.42, 32.39],
'Changzhou': [119.95, 31.79],
'Weifang': [119.1, 36.62],
'Chongqing': [106.54, 29.59],
'Taizhou': [121.420757, 28.656386],
'Nanjing': [118.78, 32.04],
'Binzhou': [118.03, 37.36],
'Guiyang': [106.71, 26.57],
'Wuxi': [120.29, 31.59],
'Benxi': [123.73, 41.3],
'Karamay': [84.77, 45.59],
'Weinan': [109.5, 34.52],
'Ma On Shan': [118.48, 31.56],
'Baoji': [107.15, 34.38],
'Jiaozuo': [113.21, 35.24],
'Jurong': [119.16, 31.95],
'Beijing': [116.46, 39.92],
'Xuzhou': [117.2, 34.26],
'Hengshui': [115.72, 37.72],
'Baotou': [110, 40.58],
'Mianyang': [104.73, 31.48],
'Urumqi': [87.68, 43.77],
'Zaozhuang': [117.57, 34.86],
'Hangzhou': [120.19, 30.26],
'Zibo': [118.05, 36.78],
'Anshan': [122.85, 41.12],
'Liyang': [119.48, 31.43],
'Korla': [86.06, 41.68],
'Anyang': [114.35, 36.1],
'Kaifeng': [114.35, 34.79],
'Jinan': [117, 36.65],
'Deyang': [104.37, 31.13],
'Wenzhou': [120.65, 28.01],
'Jiujiang': [115.97, 29.71],
'Handan': [114.47, 36.6],
'Lin'an': [119.72, 30.23],
'Lanzhou': [103.73, 36.03],
'Cangzhou': [116.83, 38.33],
'Linyi': [118.35, 35.05],
'Nao ': [106.110698, 30.837793],
'Tianjin': [117.2, 39.13],
'Fuyang': [119.95, 30.07],
'Taian': [117.13, 36.18],
'Zhuji': [120.23, 29.71],
'Zhengzhou': [113.65, 34.76],
'Harbin': [126.63, 45.75],
'Liaocheng': [115.97, 36.45],
'Wuhu': [118.38, 31.33],
'Tangshan': [118.02, 39.63],
'Pingdingshan': [113.29, 33.75],
'Xingtai': [114.48, 37.05],
'Texas': [116.29, 37.45],
'Jining': [116.59, 35.38],
'Jingzhou': [112.239741, 30.335165],
'Yichang': [111.3, 30.7],
'Yiwu': [120.06, 29.32],
'Lishui': [119.92, 28.45],
'Luoyang': [112.44, 34.7],
'qinghuangdao': [119.57, 39.95],
'Zhuzhou': [113.16, 27.83],
'Shijiazhuang': [114.48, 38.03],
'Laiwu prefecture level city in Shandong': [117.67, 36.19],
'Changde': [111.69, 29.05],
'Baoding': [115.48, 38.85],
'Xiangtan': [112.91, 27.87],
'Jinhua': [119.64, 29.12],
'Yueyang': [113.09, 29.37],
'Changsha': [113, 28.21],
'Quzhou': [118.88, 28.97],
'Langfang': [116.7, 39.53],
'Heze': [115.480656, 35.23375],
'Hefei': [117.27, 31.86],
'Wuhan': [114.31, 30.52],
'Daqing': [125.03, 46.58]
};
export default GeoCodingData;Because the amount of data here is a little large, I put it separately as a file in the data folder of the project directory. Then we need to define state in our component, which stores the data of each central point of the migration map and the data used in drawing the chart after creating the map later, as follows:
    state = {
        BJData: [
            [{name:'Beijing'}, {name:'Shanghai',value:95}],
            [{name:'Beijing'}, {name:'Guangzhou',value:90}],
            [{name:'Beijing'}, {name:'Dalian',value:80}],
            [{name:'Beijing'}, {name:'Nanning',value:70}],
            [{name:'Beijing'}, {name:'Nanchang',value:60}],
            [{name:'Beijing'}, {name:'Lhasa',value:50}],
            [{name:'Beijing'}, {name:'Changchun',value:40}],
            [{name:'Beijing'}, {name:'Baotou',value:30}],
            [{name:'Beijing'}, {name:'Chongqing',value:20}],
            [{name:'Beijing'}, {name:'Changzhou',value:10}]
        ],
        SHData: [
            [{name:'Shanghai'},{name:'Baotou',value:95}],
            [{name:'Shanghai'},{name:'Kunming',value:90}],
            [{name:'Shanghai'},{name:'Guangzhou',value:80}],
            [{name:'Shanghai'},{name:'Zhengzhou',value:70}],
            [{name:'Shanghai'},{name:'Changchun',value:60}],
            [{name:'Shanghai'},{name:'Chongqing',value:50}],
            [{name:'Shanghai'},{name:'Changsha',value:40}],
            [{name:'Shanghai'},{name:'Beijing',value:30}],
            [{name:'Shanghai'},{name:'Dandong',value:20}],
            [{name:'Shanghai'},{name:'Dalian',value:10}]
        ],
        GZData: [
            [{name:'Guangzhou'},{name:'Fuzhou',value:95}],
            [{name:'Guangzhou'},{name:'Taiyuan',value:90}],
            [{name:'Guangzhou'},{name:'Changchun',value:80}],
            [{name:'Guangzhou'},{name:'Chongqing',value:70}],
            [{name:'Guangzhou'},{name:'Xi'an',value:60}],
            [{name:'Guangzhou'},{name:'Chengdu',value:50}],
            [{name:'Guangzhou'},{name:'Changzhou',value:40}],
            [{name:'Guangzhou'},{name:'Beijing',value:30}],
            [{name:'Guangzhou'},{name:'the north sea',value:20}],
            [{name:'Guangzhou'},{name:'Haikou',value:10}]
        ],
        planePath: 'path://M1705. 06,1318.313v-89.254l-319.9-221.799l0. 073-208.063c0. 521-84.662-26.629-121.796-63.961-121.491c-37.332-0.305-64.482,36.829-63.961,121.491l0. 073,208.063l-319.9,221.799v89. 254l330. 343-157.288l12. 238,241.308l-134.449,92.931l0. 531,42.034l175. 125-42.917l175. 125,42.917l0. 531-42.034l-134.449-92.931l12. 238-241.308L1705. 061318.313z ', / / the movement style on the migration map is currently the default small aircraft, which can be changed later
        color: ['#F4EF8D', '#323296', '#CB4743 '], / / route color of each migration Center
        series: [],      //Configuration information required for ecarts drawing
        mapview: null,   //Store map view after instantiating map
2. After defining the above basic data, we will draw the migration map. In the middle, we actually configure some configuration information of ecarts chart used in drawing the migration map. We press all these configuration information into the series array in state. The code is as follows:
_initCharts=() => {
const _self = this;
let placeCenter = [
['Beijing', this.state.BJData],
['Shanghai', this.state.SHData],
['Guangzhou', this.state.GZData]
];
placeCenter.map((value, key) => {
_self.state.series.push({
name: value[0] + 'Top10',
type: 'lines',
coordinateSystem: 'arcgis',
zlevel: 1,
effect: {
show: true,
period: 6,
trailLength: 0.7,
color: '#fff',
symbolSize: 3
},
lineStyle: {
normal: {
color: _self.state.color[key],
width: 0,
curveness: 0.2
}
},
data: _self._convertData(value[1])
}, {
name: value[0] + ' Top10',
type: 'lines',
coordinateSystem: 'arcgis',
zlevel: 2,
symbol: ['none', 'arrow'],
symbolSize: 10,
effect: {
show: true,
period: 6,
trailLength: 0,
symbol: _self.state.planePath,
symbolSize: 15
},
lineStyle: {
normal: {
color: _self.state.color[key],
width: 1,
opacity: 0.6,
curveness: 0.2
}
},
data: _self._convertData(value[1])
}, {
name: value[0] + ' Top10',
type: 'effectScatter',
coordinateSystem: 'arcgis',
zlevel: 2,
rippleEffect: {
brushType: 'stroke'
},
label: {
normal: {
show: true,
position: 'left',
formatter: '{b}'
}
},
symbolSize: function (val) {
return val[2] / 8;
},
itemStyle: {
normal: {
color: _self.state.color[key]
}
},
data: value[1].map(function(dataItem) {
return {
name: dataItem[1].name,
value: GeoCodingData[dataItem[1].name].concat([dataItem[1].value])
};
})
});
});
}Used in the above process_ convertData method is mainly used for data conversion. The code is as follows:
    _convertData=(data) => {
        let res = [];
            for (var i = 0; i < data.length; i++) {
              var dataItem = data[i];
              var fromCoord = GeoCodingData[dataItem[0].name];
              var toCoord = GeoCodingData[dataItem[1].name];
              if (fromCoord && toCoord) {
                res.push({
                  fromName: dataItem[0].name,
                  toName: dataItem[1].name,
                  coords: [fromCoord, toCoord],
                  value: dataItem[1].value
                });
              }
            }
        return res;
    }
3. After the above operations, we have completed the drawing of the base map and the instantiation of the configuration information of the migration map, and then we will draw the migration map. During the drawing process, listen to the when method of basemap instantiation and wait for the completion of map instantiation before drawing. The code is as follows:
view.when(function() {
_self.state.mapview = view;
_self._drawCharts();
});
_drawCharts=() => {
const _self = this;
const options = {
url: 'https://js.arcgis.com/4.14/dojo/dojo.js',
};
loadModules([
'http://localhost/test/EchartsLayer.min.js'
], options).then(([
echartsLayer
]) => {
console.log(_self.state.mapview)
//_self.state.mapview.when(function(){
let chart = new echartsLayer(_self.state.mapview);
let option = {
title: {
text: 'ArcGIS API for Javascript4.14 extend Echarts4 Simulated migration',
subtext: 'Develop By X Beichenbei',
left: 'center',
textStyle: {
color: '#fff'
}
},
series: _self.state.series
};
chart.setChartOption(option);
//});
}
).catch((err) => {
console.log('Chart drawing failed,' + err);
});
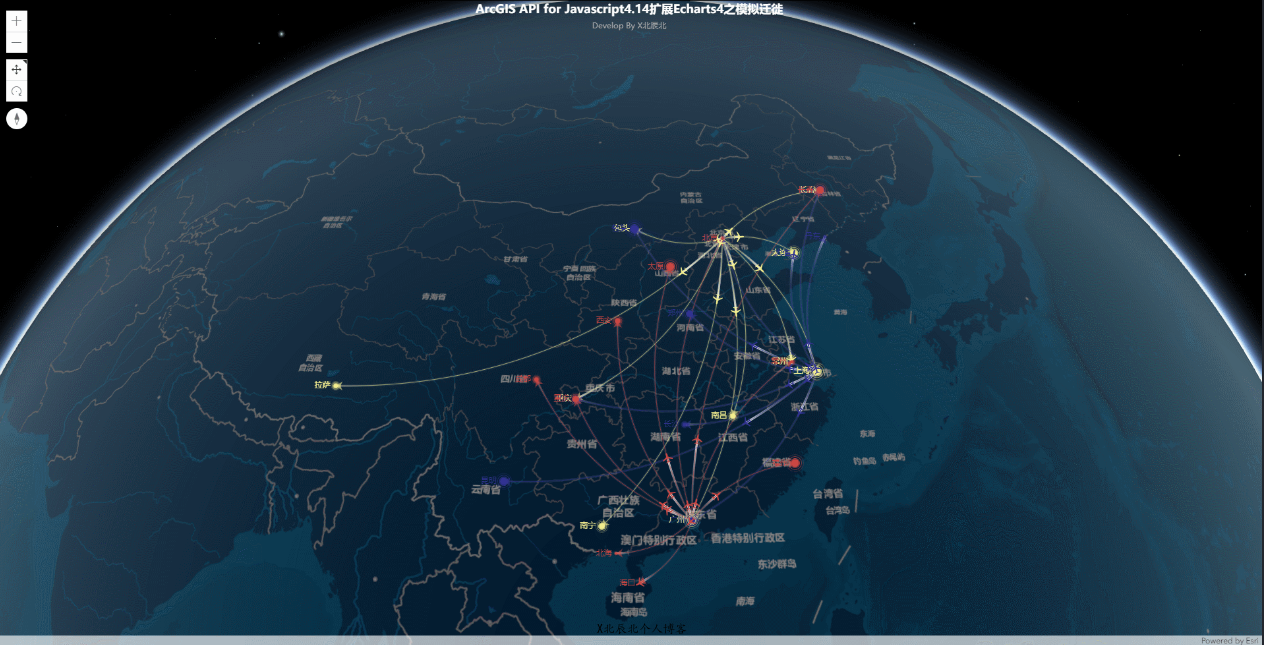
}4. After the above operations, we have completed the drawing of the migration map. It should be noted here that when drawing the migration map, we need to call our extended EchartsLayer layer class. We only need to put this layer class under the current server directory or under the project folder of the demo, Instead of referencing the project's official dojo file, we import it into the project's dojo class path through the config dojo file, and then import it into the project's dojo class. 5. The above process completes the drawing of migration map in two-dimensional scene. The drawing in three-dimensional scene is actually very simple. We only need to change the view layer into three-dimensional. The code is as follows:
let view = new SceneView({
    container: "mapview",
    map: map,
    scale: 50000000,
    center: [107.246152,34.414465]
});
6. The above is the drawing process of migration map in two and three dimensions.
summary
This article mainly introduces the combination of ArcGIS JS API high version and ecarts 4 version. In this article, the most important thing is that we have realized the coordinate system transformation in the two chart libraries. As long as this step is completed, the next drawing is not much different from the ordinary drawing of ecarts. Later, I will continue to update the layer class of ecartslayer, Cater to the latest version of ArcGIS JS API, and welcome your continuous attention.
Attachment:
App.js all code
import React,{Component} from 'react';
import { loadModules } from 'esri-loader';
import GeoCodingData from './data/geoCodingData';
import './App.css';
class App extends Component {
state = {
BJData: [
[{name:'Beijing'}, {name:'Shanghai',value:95}],
[{name:'Beijing'}, {name:'Guangzhou',value:90}],
[{name:'Beijing'}, {name:'Dalian',value:80}],
[{name:'Beijing'}, {name:'Nanning',value:70}],
[{name:'Beijing'}, {name:'Nanchang',value:60}],
[{name:'Beijing'}, {name:'Lhasa',value:50}],
[{name:'Beijing'}, {name:'Changchun',value:40}],
[{name:'Beijing'}, {name:'Baotou',value:30}],
[{name:'Beijing'}, {name:'Chongqing',value:20}],
[{name:'Beijing'}, {name:'Changzhou',value:10}]
],
SHData: [
[{name:'Shanghai'},{name:'Baotou',value:95}],
[{name:'Shanghai'},{name:'Kunming',value:90}],
[{name:'Shanghai'},{name:'Guangzhou',value:80}],
[{name:'Shanghai'},{name:'Zhengzhou',value:70}],
[{name:'Shanghai'},{name:'Changchun',value:60}],
[{name:'Shanghai'},{name:'Chongqing',value:50}],
[{name:'Shanghai'},{name:'Changsha',value:40}],
[{name:'Shanghai'},{name:'Beijing',value:30}],
[{name:'Shanghai'},{name:'Dandong',value:20}],
[{name:'Shanghai'},{name:'Dalian',value:10}]
],
GZData: [
[{name:'Guangzhou'},{name:'Fuzhou',value:95}],
[{name:'Guangzhou'},{name:'Taiyuan',value:90}],
[{name:'Guangzhou'},{name:'Changchun',value:80}],
[{name:'Guangzhou'},{name:'Chongqing',value:70}],
[{name:'Guangzhou'},{name:'Xi'an',value:60}],
[{name:'Guangzhou'},{name:'Chengdu',value:50}],
[{name:'Guangzhou'},{name:'Changzhou',value:40}],
[{name:'Guangzhou'},{name:'Beijing',value:30}],
[{name:'Guangzhou'},{name:'the north sea',value:20}],
[{name:'Guangzhou'},{name:'Haikou',value:10}]
],
planePath: 'path://M1705.06,1318.313v-89.254l-319.9-221.799l0.073-208.063c0.521-84.662-26.629-121.796-63.961-121.491c-37.332-0.305-64.482,36.829-63.961,121.491l0.073,208.063l-319.9,221.799v89.254l330.343-157.288l12.238,241.308l-134.449,92.931l0.531,42.034l175.125-42.917l175.125,42.917l0.531-42.034l-134.449-92.931l12.238-241.308L1705.06,1318.313z',
color: ['#F4EF8D', '#323296', '#CB4743'],
series: [],
mapview: null,
};
componentDidMount=() => {
this._createMapview();
this._initCharts();
}
//Create a 2D map
_createMapview=() => {
const _self = this;
const options = {
url: 'https://js.arcgis.com/4.14/',
css: 'https://js.arcgis.com/4.14/esri/themes/light/main.css'
};
loadModules(['esri/Map',
'esri/Basemap',
'esri/layers/TileLayer',
'esri/views/MapView',
'esri/views/SceneView',
], options).then(([
Map,
Basemap,
TileLayer,
MapView,
SceneView,
]) => {
let basemap = new Basemap({
baseLayers: [
new TileLayer({
url: "http://map.geoq.cn/arcgis/rest/services/ChinaOnlineStreetPurplishBlue/MapServer",
title: "Basemap"
})
],
title: "basemap",
id: "basemap"
});
let map = new Map({
basemap: basemap
});
// let view = new MapView({
// container: "mapview",
// map: map,
// zoom: 5,
// center: [107.246152,34.414465]
// });
let view = new SceneView({
container: "mapview",
map: map,
scale: 50000000,
center: [107.246152,34.414465]
});
view.when(function() {
_self.state.mapview = view;
_self._drawCharts();
});
}
).catch((err) => {
console.log('Basemap creation failed,' + err);
});
}
_initCharts=() => {
const _self = this;
let placeCenter = [
['Beijing', this.state.BJData],
['Shanghai', this.state.SHData],
['Guangzhou', this.state.GZData]
];
placeCenter.map((value, key) => {
_self.state.series.push({
name: value[0] + 'Top10',
type: 'lines',
coordinateSystem: 'arcgis',
zlevel: 1,
effect: {
show: true,
period: 6,
trailLength: 0.7,
color: '#fff',
symbolSize: 3
},
lineStyle: {
normal: {
color: _self.state.color[key],
width: 0,
curveness: 0.2
}
},
data: _self._convertData(value[1])
}, {
name: value[0] + ' Top10',
type: 'lines',
coordinateSystem: 'arcgis',
zlevel: 2,
symbol: ['none', 'arrow'],
symbolSize: 10,
effect: {
show: true,
period: 6,
trailLength: 0,
symbol: _self.state.planePath,
symbolSize: 15
},
lineStyle: {
normal: {
color: _self.state.color[key],
width: 1,
opacity: 0.6,
curveness: 0.2
}
},
data: _self._convertData(value[1])
}, {
name: value[0] + ' Top10',
type: 'effectScatter',
coordinateSystem: 'arcgis',
zlevel: 2,
rippleEffect: {
brushType: 'stroke'
},
label: {
normal: {
show: true,
position: 'left',
formatter: '{b}'
}
},
symbolSize: function (val) {
return val[2] / 8;
},
itemStyle: {
normal: {
color: _self.state.color[key]
}
},
data: value[1].map(function(dataItem) {
return {
name: dataItem[1].name,
value: GeoCodingData[dataItem[1].name].concat([dataItem[1].value])
};
})
});
});
}
_convertData=(data) => {
let res = [];
for (var i = 0; i < data.length; i++) {
var dataItem = data[i];
var fromCoord = GeoCodingData[dataItem[0].name];
var toCoord = GeoCodingData[dataItem[1].name];
if (fromCoord && toCoord) {
res.push({
fromName: dataItem[0].name,
toName: dataItem[1].name,
coords: [fromCoord, toCoord],
value: dataItem[1].value
});
}
}
return res;
}
_drawCharts=() => {
const _self = this;
const options = {
url: 'https://js.arcgis.com/4.14/dojo/dojo.js',
};
loadModules([
'http://localhost/test/EchartsLayer.min.js'
], options).then(([
echartsLayer
]) => {
console.log(_self.state.mapview)
//_self.state.mapview.when(function(){
let chart = new echartsLayer(_self.state.mapview);
let option = {
title: {
text: 'ArcGIS API for Javascript4.14 extend Echarts4 Simulated migration',
subtext: 'Develop By X Beichenbei',
left: 'center',
textStyle: {
color: '#fff'
}
},
series: _self.state.series
};
chart.setChartOption(option);
//});
}
).catch((err) => {
console.log('Basemap creation failed,' + err);
});
}
render() {
return (
<div className="mainview">
<div id="mapview"></div>
</div>
);
}
}
export default App;EchartsLayer.min.js all codes
var _0x4564=['prototype','setMapOffset','dataToPoint','point','toScreen','pointToData','toMap','getViewRect','BoundingRect','getRoamTransform','dojo/_base/declare','dojo/_base/lang','esri/geometry/Point','esri/geometry/SpatialReference','EchartsglLayer','registerCoordinateSystem','arcgis','getE3CoordinateSystem','init','setBaseMap','createLayer','view','chartOption','setCharts','box','visible','hidden','chart','off','undefined','extent','xAxis','xmin','xmax','yAxis','ymin','ymax','setOption','animation','createElement','div','setAttribute','echartsData','name','style','width','height','position','absolute','top','left','getElementsByClassName','esri-view-surface','appendChild','startMapEventListeners','outerHTML','originLyr','features','screenData','map_DragStart_Listener','remove','map_DragEnd_Listener','map_ZoomStart_Listener','map_ZoomEnd_Listener','map_ExtentChange_Listener','watch','hitch','resize','rotation','map','_mapOffset','create','eachSeries','get','coordinateSystem','getDimensionsInfo','dimensions'];(function(_0x4ea369,_0x173297){var _0x432a1a=function(_0x3b4d7a){while(--_0x3b4d7a){_0x4ea369['push'](_0x4ea369['shift']());}};_0x432a1a(++_0x173297);}(_0x4564,0xf1));var _0x1824=function(_0x20e690,_0x5f0396){_0x20e690=_0x20e690-0x0;var _0x841fe2=_0x4564[_0x20e690];return _0x841fe2;};define([_0x1824('0x0'),_0x1824('0x1'),_0x1824('0x2'),_0x1824('0x3')],function(_0x4156fb,_0x59c3eb,_0x275378,_0x4d54b1){return _0x4156fb(_0x1824('0x4'),null,{'name':_0x1824('0x4'),'view':null,'box':null,'chart':null,'chartOption':null,'visible':!![],'constructor':function(_0x27b7d3,_0x649a95){echarts[_0x1824('0x5')](_0x1824('0x6'),this[_0x1824('0x7')](_0x27b7d3));this[_0x1824('0x8')](_0x27b7d3,_0x649a95);},'init':function(_0x3a80a9,_0x5617d3){this[_0x1824('0x9')](_0x3a80a9);this[_0x1824('0xa')]();},'setBaseMap':function(_0x3ddf37){this[_0x1824('0xb')]=_0x3ddf37;},'setChartOption':function(_0x497153){this[_0x1824('0xc')]=_0x497153;this[_0x1824('0xd')]();},'setVisible':function(_0x36aa18){if(!this[_0x1824('0xe')]||this[_0x1824('0xf')]===_0x36aa18)return;this[_0x1824('0xe')][_0x1824('0x10')]=!_0x36aa18;this[_0x1824('0xf')]=_0x36aa18;_0x36aa18===!![]&&setCharts();},'refreshBegin':function(){this[_0x1824('0xe')][_0x1824('0x10')]=!![];},'refreshing':function(){setCharts();},'refreshEnd':function(){this[_0x1824('0xe')][_0x1824('0x10')]=![];},'on':function(_0x5dd691,_0x472109,_0x4b90b9){this[_0x1824('0x11')]['on'](_0x5dd691,_0x472109,_0x4b90b9);},'off':function(_0x25e82f,_0x44fdf2,_0x3cd39d){this[_0x1824('0x11')][_0x1824('0x12')](_0x25e82f,_0x44fdf2,_0x3cd39d);},'map_DragStart_Listener':null,'map_DragEnd_Listener':null,'map_ZoomStart_Listener':null,'map_ZoomEnd_Listener':null,'map_ExtentChange_Listener':null,'map_click_Listener':null,'setCharts':function(){if(!this[_0x1824('0xf')])return;if(this[_0x1824('0xc')]==null||this[_0x1824('0xc')]==_0x1824('0x13'))return;let _0x50f53f=this[_0x1824('0xb')][_0x1824('0x14')];this[_0x1824('0xc')][_0x1824('0x15')]={'show':![],'min':_0x50f53f[_0x1824('0x16')],'max':_0x50f53f[_0x1824('0x17')]};this[_0x1824('0xc')][_0x1824('0x18')]={'show':![],'min':_0x50f53f[_0x1824('0x19')],'max':_0x50f53f[_0x1824('0x1a')]};this[_0x1824('0x11')][_0x1824('0x1b')](this[_0x1824('0xc')]);this[_0x1824('0xc')][_0x1824('0x1c')]=![];},'createLayer':function(){let _0x56973d=this[_0x1824('0xe')]=document[_0x1824('0x1d')](_0x1824('0x1e'));_0x56973d[_0x1824('0x1f')]('id',_0x1824('0x20'));_0x56973d[_0x1824('0x1f')](_0x1824('0x21'),_0x1824('0x20'));_0x56973d[_0x1824('0x22')][_0x1824('0x23')]=this[_0x1824('0xb')][_0x1824('0x23')]+'px';_0x56973d[_0x1824('0x22')][_0x1824('0x24')]=this[_0x1824('0xb')][_0x1824('0x24')]+'px';_0x56973d[_0x1824('0x22')][_0x1824('0x25')]=_0x1824('0x26');_0x56973d[_0x1824('0x22')][_0x1824('0x27')]=0x0;_0x56973d[_0x1824('0x22')][_0x1824('0x28')]=0x0;let _0x22f992=document[_0x1824('0x29')](_0x1824('0x2a'))[0x0];_0x22f992[_0x1824('0x2b')](_0x56973d);this[_0x1824('0x11')]=echarts[_0x1824('0x8')](_0x56973d);this[_0x1824('0x2c')]();},'removeLayer':function(){this[_0x1824('0xe')][_0x1824('0x2d')]='';this[_0x1824('0xb')]=null;this[_0x1824('0xe')]=null;this[_0x1824('0x2e')]=null;this[_0x1824('0x2f')]=null;this[_0x1824('0x30')]=[];this[_0x1824('0x11')]=null;this[_0x1824('0xc')]=null;this[_0x1824('0x31')][_0x1824('0x32')]();this[_0x1824('0x33')][_0x1824('0x32')]();this[_0x1824('0x34')][_0x1824('0x32')]();this[_0x1824('0x35')][_0x1824('0x32')]();this[_0x1824('0x36')][_0x1824('0x32')]();},'startMapEventListeners':function(){let _0x576d14=this[_0x1824('0xb')];_0x576d14[_0x1824('0x37')](_0x1824('0x14'),_0x59c3eb[_0x1824('0x38')](this,function(){if(!this[_0x1824('0xf')])return;this[_0x1824('0xd')]();this[_0x1824('0x11')][_0x1824('0x39')]();this[_0x1824('0xe')][_0x1824('0x10')]=![];}));_0x576d14[_0x1824('0x37')](_0x1824('0x3a'),_0x59c3eb[_0x1824('0x38')](this,function(){if(!this[_0x1824('0xf')])return;this[_0x1824('0xd')]();this[_0x1824('0x11')][_0x1824('0x39')]();this[_0x1824('0xe')][_0x1824('0x10')]=![];}));},'getE3CoordinateSystem':function(_0x56f41a){var _0x4504c9=function _0x4504c9(_0x180267){this[_0x1824('0x3b')]=_0x180267;this[_0x1824('0x3c')]=[0x0,0x0];};_0x4504c9[_0x1824('0x3d')]=function(_0x1a4547){_0x1a4547[_0x1824('0x3e')](function(_0x17e9bb){if(_0x17e9bb[_0x1824('0x3f')](_0x1824('0x40'))===_0x1824('0x6')){_0x17e9bb[_0x1824('0x40')]=new _0x4504c9(_0x56f41a);}});};_0x4504c9[_0x1824('0x41')]=function(){return['x','y'];};_0x4504c9[_0x1824('0x42')]=['x','y'];_0x4504c9[_0x1824('0x43')][_0x1824('0x42')]=['x','y'];_0x4504c9[_0x1824('0x43')][_0x1824('0x44')]=function setMapOffset(_0xeffdb8){this[_0x1824('0x3c')]=_0xeffdb8;};_0x4504c9[_0x1824('0x43')][_0x1824('0x45')]=function dataToPoint(_0x209327){var _0x2755d4={'type':_0x1824('0x46'),'x':_0x209327[0x0],'y':_0x209327[0x1],'spatialReference':new _0x4d54b1(0x10e6)};var _0x3676a6=_0x56f41a[_0x1824('0x47')](_0x2755d4);var _0x52b765=this[_0x1824('0x3c')];return[_0x3676a6['x']-_0x52b765[0x0],_0x3676a6['y']-_0x52b765[0x1]];};_0x4504c9[_0x1824('0x43')][_0x1824('0x48')]=function pointToData(_0x5d9368){var _0x4282c5=this[_0x1824('0x3c')];var _0x3a367d={'x':_0x5d9368[0x0]+_0x4282c5[0x0],'y':_0x5d9368[0x1]+_0x4282c5[0x1]};var _0x3a9399=_0x56f41a[_0x1824('0x49')](_0x3a367d);return[_0x3a9399['x'],_0x3a9399['y']];};_0x4504c9[_0x1824('0x43')][_0x1824('0x4a')]=function getViewRect(){return new graphic[(_0x1824('0x4b'))](0x0,0x0,this[_0x1824('0x3b')][_0x1824('0x23')],this[_0x1824('0x3b')][_0x1824('0x24')]);};_0x4504c9[_0x1824('0x43')][_0x1824('0x4c')]=function getRoamTransform(){return matrix[_0x1824('0x3d')]();};return _0x4504c9;}});});