This paper mainly introduces the implementation steps of drawing network path map on map using ArcGIS JS API 4.14 and ecarts 4.7.0, including two-dimensional and three-dimensional.
summary
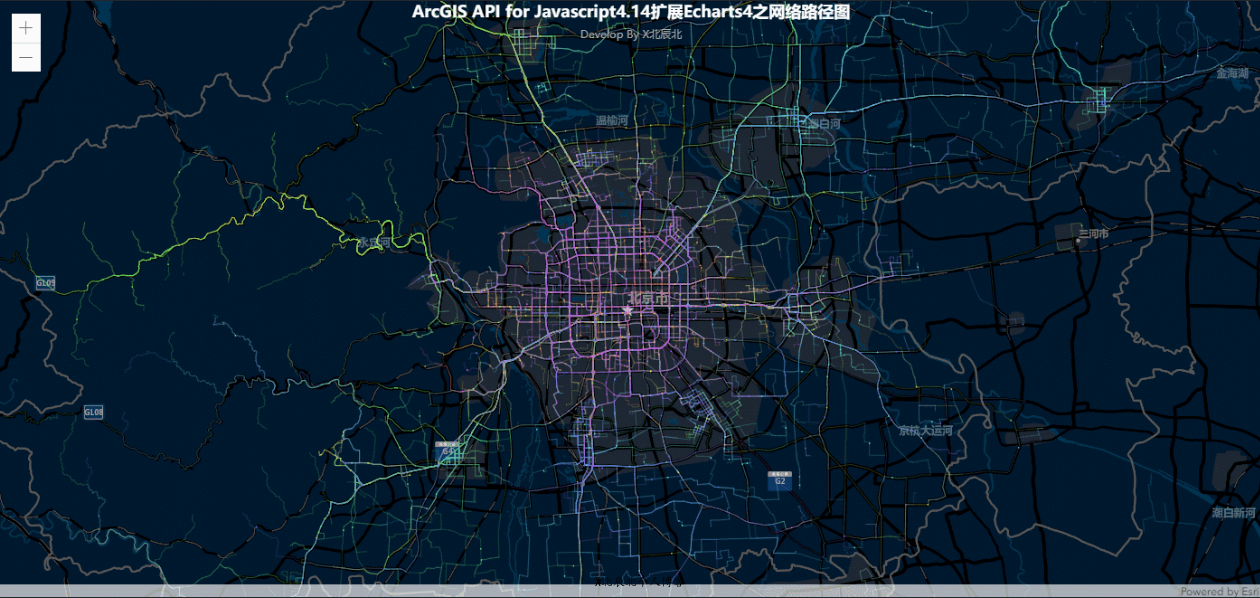
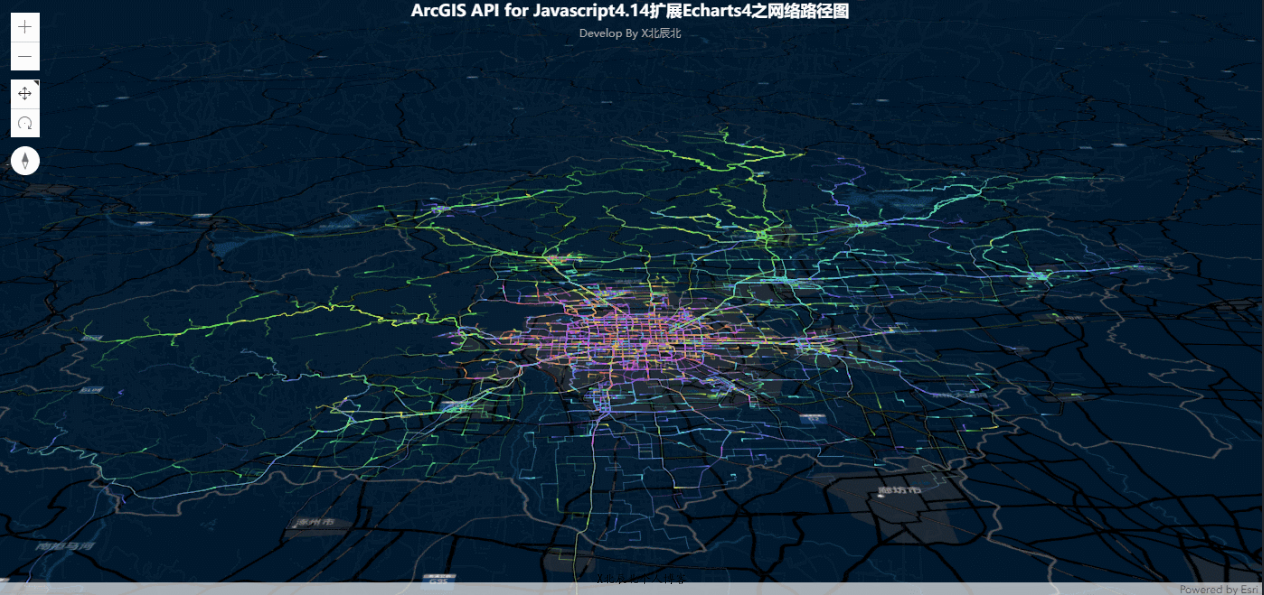
The previous two articles extended echartslayer JS this layer class realizes the use of ArcGIS JS API and ecarts to draw migration map and scatter map in two-dimensional and three-dimensional scenes. This article continues to verify whether the layer class we extended is available through the example of drawing network path map. First, let's see the final effect:
Realization idea
Migration map, scatter map and network path map are closely related to geographical coordinates, so this kind of chart cannot be drawn only by drawing the first two-dimensional ordinary chart. Therefore, we need to expand the relevant functions of ecarts to enable it to complete the drawing of this kind of chart on the map in combination with the latest version of ArcGIS JS API, The official website of ecarts also provides corresponding extension plug-ins, but this plug-in can not well support the high version of our ArcGIS JS API, so we directly extend a layer class in this article. The following is the specific implementation idea: To realize the combination of ArcGIS JS API and ecarts, the key is to realize the coordinate system transformation in the two plug-in libraries. This is the key point. As long as we understand this, we can completely break away from the constraints of map API library and theoretically realize the combination of ecarts and any map library. When converting coordinates here, we use the registerCoordinateSystem method provided by ecarts. Through this method, we register a coordinate system called "arcgis", which rewrites the dataToPoint, pointToData and other methods in ecarts, and then encapsulates all these contents into an ecartslayer layer class. As for the source code of this file, it will be provided at the end of the article. Next, let's take a look at the specific implementation steps.
Implementation steps
1. The demo used in this article is also built based on the React framework, so we first build an initialization project based on the React framework, and then rewrite the app in the src directory JS, the main file, instantiates a two-dimensional map, which uses the ESRI loader plug-in. For the specific implementation process, see my article[ [Fan Wai] ArcGIS JS API 4.14 is used in React ], there are specific implementation steps. 2. After instantiating a two-dimensional map through the above operations, we will draw the network path map next. Before we start, we need data, that is, the coordinate data and corresponding weight value data of the network path. I saved it in a JS file. This file is relatively large, so I don't intend to paste it here, If necessary, you can download it from this address( https://download.csdn.net/download/qq_35117024/12279946). 3. After downloading the data, copy the data to the demo code directory, and then import it into the component code. Here, we import it into our new TrafficNetwork component directory, and then write the data processing function to initialize the downloaded data. The code is as follows:
//Initialization data
_initData=() => {
const _self = this;
let data = trafficData;
let hStep = 300 / (data.length - 1);
_self.state.busLines = [].concat.apply([], data.map(function (busLine, idx) {
let prevPt;
let points = [];
for (let i = 0; i < busLine.length; i += 2) {
let pt = [busLine[i], busLine[i + 1]];
if (i > 0) {
pt = [
prevPt[0] + pt[0],
prevPt[1] + pt[1]
];
}
prevPt = pt;
points.push([pt[0] / 1e4, pt[1] / 1e4]);
}
return {
coords: points,
lineStyle: {
normal: {
color: echarts.color.modifyHSL('#5A94DF', Math.round(hStep * idx))
}
}
}
}))
}4. After the initial data, we configure the drawing information of the network path chart, that is, initialize the series attribute. The code is as follows:
    //Initialize chart configuration
    _initCharts=() => {
        const _self = this;
        _self.state.series = [{
            type: 'lines',
            coordinateSystem: 'arcgis',
            polyline: true,
            data: _self.state.busLines,
            silent: true,
            lineStyle: {
                // color: '#c23531',
                // color: 'rgb(200, 35, 45)',
                opacity: 0.2,
                width: 1
            },
            progressiveThreshold: 500,
            progressive: 200
        }, {
            type: 'lines',
            coordinateSystem: 'arcgis',
            polyline: true,
            data: _self.state.busLines,
            lineStyle: {
                width: 0
            },
            effect: {
                constantSpeed: 20,
                show: true,
                trailLength: 0.1,
                symbolSize: 1.5
            },
            zlevel: 1
        }]
    }
5. Next, like the flow of the previous articles, monitor the completion of the map, and then use the graph drawing function to draw the network path map. The code is as follows:
view.when(function() {
    _self.state.mapview = view;
    _self._drawCharts();
});
//Draw a chart
_drawCharts=() => {
const _self = this;
const options = {
url: 'https://js.arcgis.com/4.14/dojo/dojo.js',
};
loadModules([
'http://localhost/test/EchartsLayer.min.js'
], options).then(([
echartsLayer
]) => {
console.log(_self.state.mapview)
//_self.state.mapview.when(function(){
let chart = new echartsLayer(_self.state.mapview);
let option = {
title: {
text: 'ArcGIS API for Javascript4.14 extend Echarts4 Network path map',
subtext: 'Develop By X Beichenbei',
left: 'center',
textStyle: {
color: '#fff'
}
},
series: _self.state.series
};
chart.setChartOption(option);
//});
}
).catch((err) => {
console.log('Chart drawing failed,' + err);
});
}6. Through the above steps, the two-dimensional drawing of the network path is completed. The three-dimensional drawing is very simple. You only need to replace MapView with SceneView. The code is as follows:
let view = new SceneView({
    container: "mapview",
    map: map,
    scale: 50000000,
    center: [107.246152,34.414465]
});
summary
Through three articles, we introduced the process of how to draw the chart of geographical coordinates in ecarts on the base map of ArcGIS. The implementation process in this article is the same as the previous two, both by extending ecartslayer JS this layer class, so you can use this extended class to implement when you need to draw the charts related to geographical coordinates in ecarts on ArcGIS map in the future. For the operation of drawing ordinary two-dimensional charts in ecarts onto ArcGIS base map, because it does not involve the problem of geographical coordinates, we can solve it through pure front-end. Please see this article for specific implementation[ 01 [ArcGIS JS API + ecarts series] realize the drawing of two-dimensional charts on the map].
Attachment:
TrafficNetwork component code:
import React,{Component} from 'react';
import {loadModules} from 'esri-loader';
import echarts from 'echarts';
import './trafficNetwork.css';
import trafficData from './data/trafficData';
class TrafficNetwork extends Component {
state = {
busLines: null,
series: null,
}
componentDidMount=() => {
this._initMapView();
this._initData();
this._initCharts();
}
//Instantiate map
_initMapView=() => {
const _self = this;
const options = {
url: 'https://js.arcgis.com/4.14/',
css: 'https://js.arcgis.com/4.14/esri/themes/light/main.css'
};
loadModules(['esri/Map',
'esri/Basemap',
'esri/layers/TileLayer',
'esri/views/MapView',
'esri/views/SceneView',
], options).then(([
Map,
Basemap,
TileLayer,
MapView,
SceneView,
]) => {
let basemap = new Basemap({
baseLayers: [
new TileLayer({
url: "http://map.geoq.cn/arcgis/rest/services/ChinaOnlineStreetPurplishBlue/MapServer",
title: "Basemap"
})
],
title: "basemap",
id: "basemap"
});
let map = new Map({
basemap: basemap
});
let view = new MapView({
container: "mapview",
map: map,
zoom: 10,
center: [116.403406,39.91582] //Beijing 116.403406,39.91582 Chengdu 107.246152,34.414465
});
// let view = new SceneView({
// container: "mapview",
// map: map,
// scale: 50000000,
// center: [107.246152,34.414465]
// });
view.when(function() {
_self.state.mapview = view;
_self._drawCharts();
});
}
).catch((err) => {
console.log('Basemap creation failed,' + err);
});
}
//Initialization data
_initData=() => {
const _self = this;
let data = trafficData;
let hStep = 300 / (data.length - 1);
_self.state.busLines = [].concat.apply([], data.map(function (busLine, idx) {
let prevPt;
let points = [];
for (let i = 0; i < busLine.length; i += 2) {
let pt = [busLine[i], busLine[i + 1]];
if (i > 0) {
pt = [
prevPt[0] + pt[0],
prevPt[1] + pt[1]
];
}
prevPt = pt;
points.push([pt[0] / 1e4, pt[1] / 1e4]);
}
return {
coords: points,
lineStyle: {
normal: {
color: echarts.color.modifyHSL('#5A94DF', Math.round(hStep * idx))
}
}
}
}))
}
//Initialize chart configuration
_initCharts=() => {
const _self = this;
_self.state.series = [{
type: 'lines',
coordinateSystem: 'arcgis',
polyline: true,
data: _self.state.busLines,
silent: true,
lineStyle: {
// color: '#c23531',
// color: 'rgb(200, 35, 45)',
opacity: 0.2,
width: 1
},
progressiveThreshold: 500,
progressive: 200
}, {
type: 'lines',
coordinateSystem: 'arcgis',
polyline: true,
data: _self.state.busLines,
lineStyle: {
width: 0
},
effect: {
constantSpeed: 20,
show: true,
trailLength: 0.1,
symbolSize: 1.5
},
zlevel: 1
}]
}
//Draw a chart
_drawCharts=() => {
const _self = this;
const options = {
url: 'https://js.arcgis.com/4.14/dojo/dojo.js',
};
loadModules([
'http://localhost/test/EchartsLayer.min.js'
], options).then(([
echartsLayer
]) => {
console.log(_self.state.mapview)
//_self.state.mapview.when(function(){
let chart = new echartsLayer(_self.state.mapview);
let option = {
title: {
text: 'ArcGIS API for Javascript4.14 extend Echarts4 Network path map',
subtext: 'Develop By X Beichenbei',
left: 'center',
textStyle: {
color: '#fff'
}
},
series: _self.state.series
};
chart.setChartOption(option);
//});
}
).catch((err) => {
console.log('Chart drawing failed,' + err);
});
}
render() {
return (
<div id="mapview"></div>
)
}
}
export default TrafficNetwork;EchartsLayer.min.js file code:
var _0x4564=['prototype','setMapOffset','dataToPoint','point','toScreen','pointToData','toMap','getViewRect','BoundingRect','getRoamTransform','dojo/_base/declare','dojo/_base/lang','esri/geometry/Point','esri/geometry/SpatialReference','EchartsglLayer','registerCoordinateSystem','arcgis','getE3CoordinateSystem','init','setBaseMap','createLayer','view','chartOption','setCharts','box','visible','hidden','chart','off','undefined','extent','xAxis','xmin','xmax','yAxis','ymin','ymax','setOption','animation','createElement','div','setAttribute','echartsData','name','style','width','height','position','absolute','top','left','getElementsByClassName','esri-view-surface','appendChild','startMapEventListeners','outerHTML','originLyr','features','screenData','map_DragStart_Listener','remove','map_DragEnd_Listener','map_ZoomStart_Listener','map_ZoomEnd_Listener','map_ExtentChange_Listener','watch','hitch','resize','rotation','map','_mapOffset','create','eachSeries','get','coordinateSystem','getDimensionsInfo','dimensions'];(function(_0x4ea369,_0x173297){var _0x432a1a=function(_0x3b4d7a){while(--_0x3b4d7a){_0x4ea369['push'](_0x4ea369['shift']());}};_0x432a1a(++_0x173297);}(_0x4564,0xf1));var _0x1824=function(_0x20e690,_0x5f0396){_0x20e690=_0x20e690-0x0;var _0x841fe2=_0x4564[_0x20e690];return _0x841fe2;};define([_0x1824('0x0'),_0x1824('0x1'),_0x1824('0x2'),_0x1824('0x3')],function(_0x4156fb,_0x59c3eb,_0x275378,_0x4d54b1){return _0x4156fb(_0x1824('0x4'),null,{'name':_0x1824('0x4'),'view':null,'box':null,'chart':null,'chartOption':null,'visible':!![],'constructor':function(_0x27b7d3,_0x649a95){echarts[_0x1824('0x5')](_0x1824('0x6'),this[_0x1824('0x7')](_0x27b7d3));this[_0x1824('0x8')](_0x27b7d3,_0x649a95);},'init':function(_0x3a80a9,_0x5617d3){this[_0x1824('0x9')](_0x3a80a9);this[_0x1824('0xa')]();},'setBaseMap':function(_0x3ddf37){this[_0x1824('0xb')]=_0x3ddf37;},'setChartOption':function(_0x497153){this[_0x1824('0xc')]=_0x497153;this[_0x1824('0xd')]();},'setVisible':function(_0x36aa18){if(!this[_0x1824('0xe')]||this[_0x1824('0xf')]===_0x36aa18)return;this[_0x1824('0xe')][_0x1824('0x10')]=!_0x36aa18;this[_0x1824('0xf')]=_0x36aa18;_0x36aa18===!![]&&setCharts();},'refreshBegin':function(){this[_0x1824('0xe')][_0x1824('0x10')]=!![];},'refreshing':function(){setCharts();},'refreshEnd':function(){this[_0x1824('0xe')][_0x1824('0x10')]=![];},'on':function(_0x5dd691,_0x472109,_0x4b90b9){this[_0x1824('0x11')]['on'](_0x5dd691,_0x472109,_0x4b90b9);},'off':function(_0x25e82f,_0x44fdf2,_0x3cd39d){this[_0x1824('0x11')][_0x1824('0x12')](_0x25e82f,_0x44fdf2,_0x3cd39d);},'map_DragStart_Listener':null,'map_DragEnd_Listener':null,'map_ZoomStart_Listener':null,'map_ZoomEnd_Listener':null,'map_ExtentChange_Listener':null,'map_click_Listener':null,'setCharts':function(){if(!this[_0x1824('0xf')])return;if(this[_0x1824('0xc')]==null||this[_0x1824('0xc')]==_0x1824('0x13'))return;let _0x50f53f=this[_0x1824('0xb')][_0x1824('0x14')];this[_0x1824('0xc')][_0x1824('0x15')]={'show':![],'min':_0x50f53f[_0x1824('0x16')],'max':_0x50f53f[_0x1824('0x17')]};this[_0x1824('0xc')][_0x1824('0x18')]={'show':![],'min':_0x50f53f[_0x1824('0x19')],'max':_0x50f53f[_0x1824('0x1a')]};this[_0x1824('0x11')][_0x1824('0x1b')](this[_0x1824('0xc')]);this[_0x1824('0xc')][_0x1824('0x1c')]=![];},'createLayer':function(){let _0x56973d=this[_0x1824('0xe')]=document[_0x1824('0x1d')](_0x1824('0x1e'));_0x56973d[_0x1824('0x1f')]('id',_0x1824('0x20'));_0x56973d[_0x1824('0x1f')](_0x1824('0x21'),_0x1824('0x20'));_0x56973d[_0x1824('0x22')][_0x1824('0x23')]=this[_0x1824('0xb')][_0x1824('0x23')]+'px';_0x56973d[_0x1824('0x22')][_0x1824('0x24')]=this[_0x1824('0xb')][_0x1824('0x24')]+'px';_0x56973d[_0x1824('0x22')][_0x1824('0x25')]=_0x1824('0x26');_0x56973d[_0x1824('0x22')][_0x1824('0x27')]=0x0;_0x56973d[_0x1824('0x22')][_0x1824('0x28')]=0x0;let _0x22f992=document[_0x1824('0x29')](_0x1824('0x2a'))[0x0];_0x22f992[_0x1824('0x2b')](_0x56973d);this[_0x1824('0x11')]=echarts[_0x1824('0x8')](_0x56973d);this[_0x1824('0x2c')]();},'removeLayer':function(){this[_0x1824('0xe')][_0x1824('0x2d')]='';this[_0x1824('0xb')]=null;this[_0x1824('0xe')]=null;this[_0x1824('0x2e')]=null;this[_0x1824('0x2f')]=null;this[_0x1824('0x30')]=[];this[_0x1824('0x11')]=null;this[_0x1824('0xc')]=null;this[_0x1824('0x31')][_0x1824('0x32')]();this[_0x1824('0x33')][_0x1824('0x32')]();this[_0x1824('0x34')][_0x1824('0x32')]();this[_0x1824('0x35')][_0x1824('0x32')]();this[_0x1824('0x36')][_0x1824('0x32')]();},'startMapEventListeners':function(){let _0x576d14=this[_0x1824('0xb')];_0x576d14[_0x1824('0x37')](_0x1824('0x14'),_0x59c3eb[_0x1824('0x38')](this,function(){if(!this[_0x1824('0xf')])return;this[_0x1824('0xd')]();this[_0x1824('0x11')][_0x1824('0x39')]();this[_0x1824('0xe')][_0x1824('0x10')]=![];}));_0x576d14[_0x1824('0x37')](_0x1824('0x3a'),_0x59c3eb[_0x1824('0x38')](this,function(){if(!this[_0x1824('0xf')])return;this[_0x1824('0xd')]();this[_0x1824('0x11')][_0x1824('0x39')]();this[_0x1824('0xe')][_0x1824('0x10')]=![];}));},'getE3CoordinateSystem':function(_0x56f41a){var _0x4504c9=function _0x4504c9(_0x180267){this[_0x1824('0x3b')]=_0x180267;this[_0x1824('0x3c')]=[0x0,0x0];};_0x4504c9[_0x1824('0x3d')]=function(_0x1a4547){_0x1a4547[_0x1824('0x3e')](function(_0x17e9bb){if(_0x17e9bb[_0x1824('0x3f')](_0x1824('0x40'))===_0x1824('0x6')){_0x17e9bb[_0x1824('0x40')]=new _0x4504c9(_0x56f41a);}});};_0x4504c9[_0x1824('0x41')]=function(){return['x','y'];};_0x4504c9[_0x1824('0x42')]=['x','y'];_0x4504c9[_0x1824('0x43')][_0x1824('0x42')]=['x','y'];_0x4504c9[_0x1824('0x43')][_0x1824('0x44')]=function setMapOffset(_0xeffdb8){this[_0x1824('0x3c')]=_0xeffdb8;};_0x4504c9[_0x1824('0x43')][_0x1824('0x45')]=function dataToPoint(_0x209327){var _0x2755d4={'type':_0x1824('0x46'),'x':_0x209327[0x0],'y':_0x209327[0x1],'spatialReference':new _0x4d54b1(0x10e6)};var _0x3676a6=_0x56f41a[_0x1824('0x47')](_0x2755d4);var _0x52b765=this[_0x1824('0x3c')];return[_0x3676a6['x']-_0x52b765[0x0],_0x3676a6['y']-_0x52b765[0x1]];};_0x4504c9[_0x1824('0x43')][_0x1824('0x48')]=function pointToData(_0x5d9368){var _0x4282c5=this[_0x1824('0x3c')];var _0x3a367d={'x':_0x5d9368[0x0]+_0x4282c5[0x0],'y':_0x5d9368[0x1]+_0x4282c5[0x1]};var _0x3a9399=_0x56f41a[_0x1824('0x49')](_0x3a367d);return[_0x3a9399['x'],_0x3a9399['y']];};_0x4504c9[_0x1824('0x43')][_0x1824('0x4a')]=function getViewRect(){return new graphic[(_0x1824('0x4b'))](0x0,0x0,this[_0x1824('0x3b')][_0x1824('0x23')],this[_0x1824('0x3b')][_0x1824('0x24')]);};_0x4504c9[_0x1824('0x43')][_0x1824('0x4c')]=function getRoamTransform(){return matrix[_0x1824('0x3d')]();};return _0x4504c9;}});});