catalogue
(2) Case: sequence frame animation
4. canvas color style and shadow
6. Related operations of drawing environment
1. Draw text
- **ctx.font;** Set the font attribute of text content in the same way as css font
- **ctx.textAlign;** Sets the alignment of text content
- start: by default, the text starts at the specified position
- end: the text ends at the specified position
- Center: the center of the text is placed at the specified position
- Left: align text left
- Right: align text right
- **ctx.textBaseline;** Sets the current text baseline to use when drawing text
- Alphabetic: by default, the text baseline is the normal alphabetic baseline
- Top: the text baseline is the top of the em box
- Baseline hanging: hanging text
- middle: the text baseline is the center of the em box
- ideographic: the text baseline is the em baseline
- Bottom: the text baseline is the bottom of the em box
- **ctx.fillText();** Fill text
- **ctx.strokeText();** Draw text (no fill)
- **ctx.measureText();** Returns an object containing the specified text width
Next, we draw text based on the pie chart case above:
<!DOCTYPE html>
<html>

<head>
  <meta charset="UTF-8">
  <title>Draw pie chart&written words</title>
  <style></style>
</head>

<body>
  <div>
    <canvas id="table"></canvas>
  </div>
</body>
<script>
  var canvas = document.getElementById('table'); //Get canvas tag
  var ctx = canvas.getContext('2d'); //Get context

  //Set the width, height and border of the canvas (the border can also be set using CSS selector)
  canvas.width = 600;
  canvas.height = 400;
  canvas.style.border = '2px solid #000';

  //Define pie chart data
  var data = [{
      'value': 0.2,
      'color': '#149985',
      'title': 'city A'
    },
    {
      'value': 0.3,
      'color': 'red',
      'title': 'city B'
    },
    {
      'value': 0.4,
      'color': 'blue',
      'title': 'city C'
    },
    {
      'value': 0.1,
      'color': '#999999',
      'title': 'city D'
    },
  ]

  //Draw pie chart
  var tempAngle = -90; //Record to which angle
  for (var i = 0; i < data.length; i++) {
    ctx.beginPath(); //Each cycle draws a different sector, so a new state must be turned on
    ctx.moveTo(200, 200); //Each time, go back to the center point and start drawing
    var angle = data[i].value * 360; //Angle of each sector
    ctx.fillStyle = data[i].color; //The color fill is traversed according to the data
    var startAngle = tempAngle * Math.PI / 180; //Starting angle
    var endAngle = (tempAngle + angle) * Math.PI / 180; //End angle of each time = start angle + sector angle
    ctx.arc(200, 200, 100, startAngle, endAngle);

    //Draw text
    var txt = data[i].value * 100 + '%'; //Gets the text to draw
    var x, y; //Text coordinates
    var txtAngle = tempAngle + 1 / 2 * angle; //Angle of text position = starting angle + half of sector
    //Calculate text coordinates
    x = 200 + Math.cos(txtAngle * Math.PI / 180) * (100 + 20);
    y = 200 + Math.sin(txtAngle * Math.PI / 180) * (100 + 20);

    ctx.font = '20px "Microsoft YaHei "'; //Set font
    if (txtAngle > 90 && txtAngle < 270) { //Set the end position alignment of the text on the left of the y-axis to prevent incomplete text display
      ctx.textAlign = 'end';
    }

    ctx.fillText(txt, x, y); //Fill text

    ctx.fill();
    tempAngle = tempAngle + angle; //After each drawing, the starting angle of the sector is the original angle plus the angle of the sector
  }
</script>

</html>
The pie chart with text is as follows:
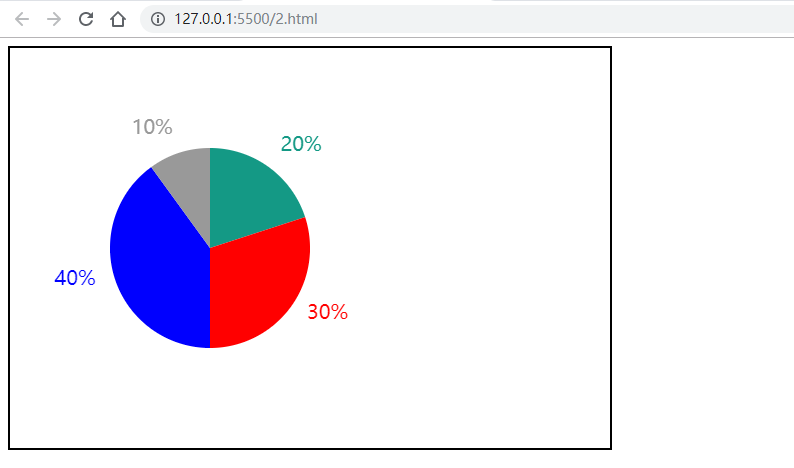
Note here that we use two formulas to calculate the position of the text: 200 is the position of the center point, cos is the position in the x-axis direction, sin is the position in the y-axis direction, 100 is the radius length, and 20 is the distance from the text to the circumference; The formula is universal.
x = 200 + Math.cos(txtAngle * Math.PI / 180) * (100 + 20);
y = 200 + Math.sin(txtAngle * Math.PI / 180) * (100 + 20);
2. Draw image
(1) Basic drawing method
- **ctx.drawImage(img,x,y); The basic method of drawing a picture, * * x y is the coordinate of the upper left corner of the drawing, and img is the dom object of drawing the picture
- **ctx.drawImage(img,x,y,width,height);** Draw pictures and specify width and height
- **ctx.drawImage(img,sx,sy,swidth,sheight,x,y,width,height);** Draw a picture and locate the clipped part on the canvas. The coordinates of the upper left corner of SX and sy clipping area, the width of the clipping picture, the height of the clipping height, and other properties are the same
The following is a simple case:
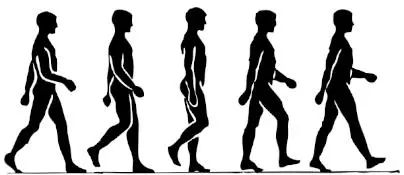
(2) Case: sequence frame animation (realize the dynamic effect of human walking through picture clipping)
Image clipping is often used to cut out one element in a picture with multiple elements, such as picking out one character in a picture with multiple characters, and so on. Next, we use a sequence frame diagram of human walking to realize the dynamic effect;
The picture of the original sequence frame is as follows:
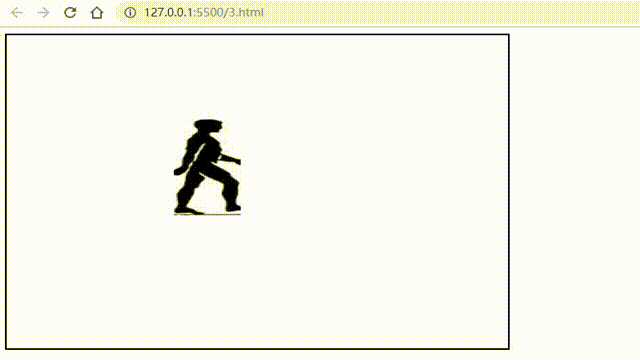
The process is also very simple, that is, the cycle timer setInterval is used to cycle and crop each frame in the picture, clear all the previously cropped elements, and only show the latest elements to achieve dynamic effects.
<!DOCTYPE html>
<html>

<head>
  <meta charset="UTF-8">
  <title>Sequence frame animation</title>
  <style></style>
</head>

<body>
  <div>
    <canvas id="table"></canvas>
  </div>
</body>
<script>
  var canvas = document.getElementById('table'); //Get canvas tag
  var ctx = canvas.getContext('2d'); //Get context

  //Set the width, height and border of the canvas (the border can also be set using CSS selector)
  canvas.width = 600;
  canvas.height = 400;
  canvas.style.border = '2px solid #000';

  //Draw picture
  var img = new Image(); //Create a picture DOM object
  img.src = 'img/zoulu.jpg'; //Picture path. After setting, img object will load pictures immediately
  img.onload = function () {
    var framIndex = 0;
    setInterval(function () {
      ctx.clearRect(0, 0, canvas.width, canvas.height);
      ctx.drawImage(img, framIndex * 80, 0, 50, 400, 200, 100, 80, 300); //Draw picture
      framIndex++; //Add to next frame
      framIndex %= 5;
    }, 1000 / 6);
  }
</script>

</html>
The case effect is as follows:
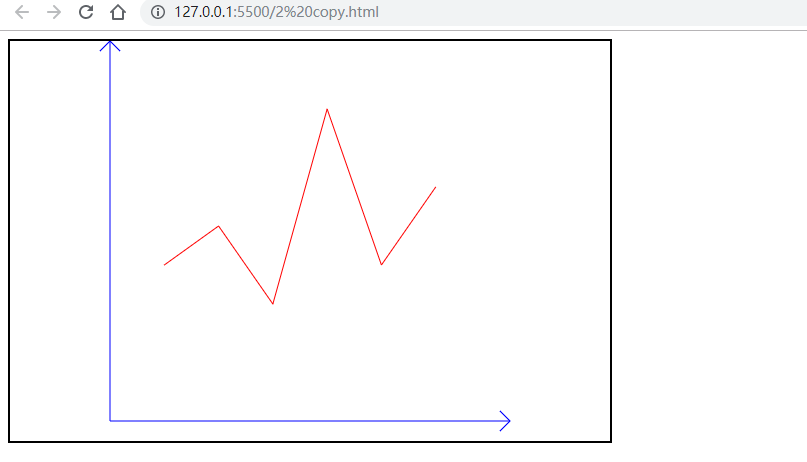
3. Drawing coordinate system
<!DOCTYPE html>
<html>

<head>
  <meta charset="UTF-8">
  <title>Draw coordinate system</title>
  <style></style>
</head>

<body>
  <div>
    <canvas id="table"></canvas>
  </div>
</body>
<script>
  var canvas = document.getElementById('table'); //Get canvas tag
  var ctx = canvas.getContext('2d'); //Get context

  //Set the width, height and border of the canvas (the border can also be set using CSS selector)
  canvas.width = 600;
  canvas.height = 400;
  canvas.style.border = '2px solid #000';

  //Brush starting point
  var x0 = 100;
  var y0 = 380;
  var maxHeight = 390;
  var arrowWidth = 10; //Arrow Width

  //Draw x axis
  ctx.beginPath();
  ctx.strokeStyle = 'blue';
  ctx.moveTo(x0, y0);
  ctx.lineTo(500, 380);

  ctx.lineTo(500 - arrowWidth, 380 - arrowWidth);
  ctx.moveTo(500, 380);
  ctx.lineTo(500 - arrowWidth, 380 + arrowWidth);
  ctx.stroke();

  //Draw y axis
  ctx.beginPath();
  ctx.moveTo(x0, y0);
  ctx.lineTo(100, 0);
  ctx.lineTo(100 - arrowWidth, arrowWidth);
  ctx.moveTo(100, 0);
  ctx.lineTo(100 + arrowWidth, arrowWidth);
  ctx.stroke();

  //Draw line segments
  var data = [0.4, 0.5, 0.3, 0.8, 0.4, 0.6]; //False data
  var pointWidth = 380 / (data.length + 1);
  ctx.beginPath();
  ctx.strokeStyle = 'red';
  for (var i = 0; i < data.length; i++) {
    var x = x0 + (i + 1) * pointWidth;
    var y = y0 - data[i] * maxHeight;
    ctx.lineTo(x, y)
  }
  ctx.stroke();
</script>

</html>
The effects are as follows:
4. canvas color style and shadow (understand)
Related color styles:
-
**ctx.fillStyle;** Fill color (can support colors of all formats)
-
**ctx.strokeStyle;** Stroke color (can support colors of all formats)
ctx.strokeStyle = 'red';
ctx.strokeStyle = '#ccc';
ctx.strokeStyle = 'rgb(255,0,0)';
ctx.strokeStyle = 'rgba(255,0,0,6)';
Related shadow styles (inefficient and poor performance, not recommended):
- **ctx.shadowColor;** Shadow color
- **ctx.shadowBlur;** Fuzzy level: a positive integer greater than 1. The higher the value, the greater the degree of fuzziness
- **ctx.shadowOffsetX;** The horizontal distance of the shadow from the shape
- **ctx.shadowOffsetY;** The vertical distance of the shadow from the shape
The usage is similar to that in css:
ctx.shadowColor = 'teal';
ctx.shadowBlur = 10;
ctx.shadowOffsetX = 10;
ctx.shadowOffsetY = 10;
ctx.fillRect(100, 100, 100, 100);
5. Complex style
(1) Gradual change
-
**ctx.createLinearGradient(x0,y0,x1,y1);** Linear gradient, x0, Y0 is the starting coordinate and x1, Y1 is the ending coordinate. Gradient color needs to be added when using
var grd = ctx.createLinearGradient(0, 0, 170, 0);
grd.addColorStop(0, ‘black’); // Add a gradient color with a value between 0.0 and 1.0
grd.addColorStop(1, ‘white’); // Add a gradient color
ctx.fillStyle = grd; // Set the gradient to the fill style -
**ctx.createRadialGradient(x0,y0,r0,x1,y1,r1);** Circular gradient, X coordinate of x0 gradient start circle, y coordinate of Y0 gradient start circle, R0: radius of start circle, X coordinate of X1 gradient end circle, y coordinate of Y1 gradient end circle, R1 radius of end circle
var rlg = ctx.createRadialGradient(300, 300, 10, 300, 300, 200);
rlg.addColorStop(0, ‘teal’); // Add a gradient color
rlg.addColorStop(0.4, 'navy');
rlg.addColorStop(1, 'purple');
ctx.fillStyle = rlg; // Set the fill style to a continuous gradient
ctx.fillRect(100, 100, 500, 500);
(2) Draw background map
-
**ctx.createPattern(img,repeat);** IMG sets the picture of tiled background and repeats the way of background tiling
var ctx = c.getContext('2d');
var img = document.getElementById('lamp');
var pat = ctx.createPattern(img, 'repeat');
ctx.rect(0, 0, 150, 100);
ctx.fillStyle = pat; // Set the background image to the fill pattern
ctx.fill();
(3) Transformation (emphasis)
- **ctx.scale(scalewidth,scaleheight);** Canvas zoom
- **ctx.translate(x,y);** Displace the canvas. After displacement, it is equivalent to changing the 0,0 coordinates of the canvas to the new x and Y positions, and all new elements drawn will be affected
- **ctx.rotate(angle);** Rotate canvas
6. Related operations of drawing environment
-
**ctx.save();** Save the state of the current environment. You can save the current drawing environment to the cache
-
**ctx.restore();** Returns previously saved path States and properties
-
**ctx.globalAlpha=number;** Set the transparency of the painting environment, with a value between 0-1
-
**ctx.clip();** Draw in a limited area of the canvas. Cut any shape and size from the original canvas. Once a certain area is cut, all subsequent drawings will be limited to the cut area
-
**canvas.toDataURL(type, encoderOptions);** Output the content drawn by canvas into base64 content, and set the output type, such as image / PNG, image / jpeg, etc; The encoderoptions value is a number between 0 and 1, which is used to identify the quality of the output picture, and 1 represents lossless compression
var canvas = document.getElementById("canvas");
var dataURL = canvas.toDataURL();
console.log(dataURL);
var img = document.querySelector("#img-demo");// Get the dom object of the picture
img.src = canvas.toDataURL(“image/png”); // Display the contents of the canvas to the picture label
Previous articles: H5 canvas introduction to mastery_ Part I