Task1 understand the game questions
I learning syllabus
● overview of competition questions
● data overview
● prediction index
● analyze competition questions
II Learning content
1. Overview of competition questions
The competition requires contestants to establish models and predict financial risks according to the given data set.
(1) The data comes from the loan records of a credit platform, with a total data volume of more than 120w, including 47 columns of variable information, one of which is anonymous.
(2) 800000 items are selected from the data set as the training set, 200000 items as the test set A and 200000 items as the test set B. at the same time, information such as employmentTitle, purpose, postCode and title will be desensitized.
2. Data overview
Characteristics of the nature to which the data column belongs.
3. Prediction indicators
The competition adopts AUC (Area Under Curve) as the evaluation index.
(1) Common evaluation indicators of classification algorithm:
(1). Confusion matrix
- True class TP(True Positive): the instance is a positive class and is predicted to be a positive class.
- False negative class FN (false negative): the instance is a positive class and is predicted to be a negative class.
- False positive class FP(False Positive): the instance is a negative class and is predicted to be a positive class.
- True negative class TM(True Negative): the instance is a negative class and is predicted to be a negative class.
(2). Accuracy [Note: not suitable for unbalanced samples]
(3). Precision
(4). Recall rate
(5).F1 Score [taking into account accuracy and recall]
(6)P-R curve
(7)ROC(ROC space defines the false positive case rate and real interest rate as X and Y axes)
(8).AUC (value range: 0.5 ~ 1.0; the closer it is to 1.0, the stronger the authenticity of the detection method; when it is equal to 0.5, the authenticity is the lowest and has no application value)
(2) For the common evaluation value indicators of financial risk control and prediction:
KS (commonly used to evaluate model discrimination)
-
In risk control, KS is often used to evaluate model discrimination. The greater the degree of discrimination, the stronger the risk ranking of the model.
-
Difference between K-S curve and ROC curve:
The ROC curve takes the true case rate and false positive case rate as the horizontal and vertical axis;
The K-S curve takes both the true case rate and the false positive case rate as the vertical axis, and the horizontal axis is served by the selected threshold. -
In general, the larger the KS value is, the stronger the distinguishing ability of the model is. However, the larger the KS value is, the better the model effect will be. If the KS value is too large, the model may be abnormal. Therefore, when the KS value is too high, it may be necessary to check whether the model is over fitted. The following is the model corresponding to KS value, but this correspondence is not unique and only represents the general trend.
-
KS < 0.2 it is generally considered that the model has no distinguishing ability
0.2 < = KS < = 0.3. It is considered that the model has certain distinguishing ability
0.3 < = KS < = 0.5. It is considered that the model has strong discrimination ability
KS > 0.75 model is abnormal
III Code example
1. Obtain data
import pandas as pd
train = pd.read_csv('http://tianchi-media.oss-cn-beijing.aliyuncs.com/dragonball/FRC/data_set/train.csv')
testA = pd.read_csv('http://tianchi-media.oss-cn-beijing.aliyuncs.com/dragonball/FRC/data_set/testA.csv')
print('Train data shape:',train.shape)
print('TestA data shape:',testA.shape)
train.head()
2. Evaluation index of classification algorithm
1) Confusion matrix
import numpy as meng
from sklearn.metrics import confusion_matrix
y_pred = [0, 1, 1, 1]
y_true = [0, 1, 1, 0]
print('Confusion matrix:\n',confusion_matrix(y_true, y_pred))
Confusion matrix:
[[1 1]
[0 2]]
2) Accuracy
 from sklearn.metrics import accuracy_score
  y_pred = [0, 1, 1, 1]
  y_true = [0, 1, 1, 0]
  print('ACC:',accuracy_score(y_true, y_pred))
ACC: 0.75
3) Precision
from sklearn import metrics
y_pred = [0, 1, 1, 1]
y_true = [0, 1, 1, 0]
print('Precision',metrics.precision_score(y_true, y_pred))
Precision 0.6666666666666666
4) Recall rate
from sklearn import metrics
y_pred = [0, 1, 1, 1]
y_true = [0, 1, 1, 0]
print('Recall',metrics.recall_score(y_true, y_pred))
Recall 1.0
5)F1 Score
from sklearn.metrics import accuracy_score
y_pred = [0, 1,1, 1]
y_true = [0, 1, 1,0]
print('F1-score:',metrics.f1_score(y_true, y_pred))
F1-score: 0.5
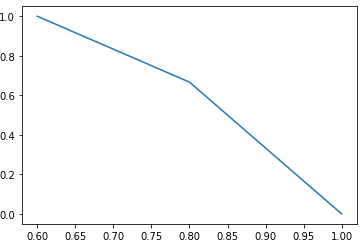
6) P-R curve
import matplotlib.pyplot as plt
from sklearn.metrics import precision_recall_curve
y_pred = [0, 0, 1, 0, 0, 0, 1, 1,1,1]
y_true = [0, 1, 1, 0, 1, 0, 1, 1, 0, 1]
precision, recall, thresholds = precision_recall_curve(y_true, y_pred)
plt.plot(precision, recall)
[<matplotlib.lines.Line2D at 0x7f6ff870b908>]
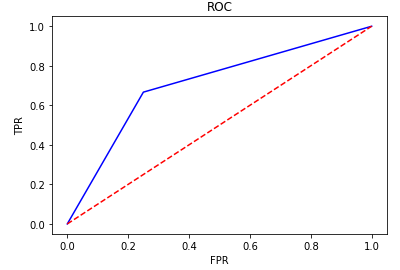
7)ROC
from sklearn.metrics import roc_curve
y_pred = [0, 0, 1, 0, 0, 0, 1, 1,1,1]
y_true = [0, 1, 1, 0, 1, 0, 1, 1, 0, 1]
FPR,TPR,thresholds=roc_curve(y_true, y_pred)
plt.title('ROC')
plt.plot(FPR, TPR,'b')
plt.plot([0,1],[0,1],'r--')
plt.ylabel('TPR')
plt.xlabel('FPR')
Text(0.5, 0, 'FPR')
8).AUC
import numpy as meng
from sklearn.metrics import roc_auc_score
y_true = meng.array([0, 1, 1, 0])
y_scores = meng.array([0.2, 0.3, 0.4, 0.7])
print('AUC socre:',roc_auc_score(y_true, y_scores))
AUC socre: 0.5