Component introduction
Node Exporter
node_exporter is the general name of a kind of data acquisition components. Exporter is responsible for collecting data from the target and converting it into the format supported by Prometheus. It opens an http interface (so that Prometheus can grab data) Different from the traditional data collection components, the exporter does not send data to the central server, but waits for the central server (such as Prometheus) to take the initiative to grab it. Prometheus · GitHub There are many written exporter s that can be downloaded and used directly.
Prometheus
Prometheus (Chinese Name: Prometheus) is an open source monitoring and alarm system and time series database (TSDB) developed by SoundCloud Prometheus is developed in Go language and is an open source version of Google BorgMon monitoring system.
The basic principle of Prometheus is to periodically capture the status of monitored components through HTTP protocol. Any component can access monitoring as long as it provides corresponding HTTP interface No SDK or other integration process is required. The HTTP interface for outputting the information of monitored components is called exporter. At present, most commonly used components can be directly used by exporters, such as Nginx, MySQL, Linux system information, Mongo, ES, etc
Grafana
Grafana is a graphical tool. It can read data information from a variety of data sources (such as Prometheus), use beautiful charts to display data, and many open-source dashborad can be used to quickly build a very beautiful monitoring platform. Its relationship with Prometheus is similar to Kibana and ElasticSearch.
download
node_exporter: https://github.com/prometheus/node_exporter/releases/download/v1.3.1/node_exporter-1.3.1.linux-amd64.tar.gz
Grafana: https://dl.grafana.com/enterprise/release/grafana-enterprise-8.4.2.linux-amd64.tar.gz
[root@iZ8vb7u9c6qu93ecd45frhZ media]# ll
total 165192
-rw-r--r-- 1 root root 83911070 Mar  1 21:36 grafana-enterprise-8.4.2.linux-amd64.tar.gz
-rw-r--r-- 1 root root  9033415 Dec  8 16:52 node_exporter-1.3.1.linux-amd64.tar.gz
-rw-r--r-- 1 root root 76202164 Feb 28 23:58 prometheus-2.34.0-rc.0.linux-amd64.tar.gz
express setup
In the quick installation mode, you can directly execute the following commands to install grafana and node_exporter, prometheus installation process access PasteMe - a not bad private text sharing platform see
curl api.pasteme.cn/8413 | bash
After installation, execute the following commands to check the operation of each component
systemctl status node_exporter
systemctl status prometheus
systemctl status grafana-server
The browser accesses the component to check whether it is normal. The default account password is admin
node_ The default ports of exporter, Prometheus and Grafana are 9100, 9090 and 3000 respectively
to configure
After installation, the three components are independent of each other and need to be configured to work together.
-
Prometheus
Edit the configuration file / usr / local / Prometheus / Prometheus yml
# my global config global: scrape_interval: 15s # Set the scrape interval to every 15 seconds. Default is every 1 minute. evaluation_interval: 15s # Evaluate rules every 15 seconds. The default is every 1 minute. # scrape_timeout is set to the global default (10s). # Alertmanager configuration alerting: alertmanagers: - static_configs: - targets: # - alertmanager:9093 # Load rules once and periodically evaluate them according to the global 'evaluation_interval'. rule_files: # - "first_rules.yml" # - "second_rules.yml" # A scrape configuration containing exactly one endpoint to scrape: # Here it's Prometheus itself. scrape_configs: # The job name is added as a label `job=<job_name>` to any timeseries scraped from this config. - job_name: 'prometheus' # metrics_path defaults to '/metrics' # scheme defaults to 'http'. static_configs: - targets: ['localhost:9090'] # Change the port number to 9100
The above modification requires Prometheus to read the metrics information from localhost:9100/metrics. The default 9090 is the metrics information of Prometheus itself. After modification, read the node_ Information collected by exporter.
When monitoring multiple nodes
- targets: ['localhost1:9100','localhost2:9100']
Restart Prometheus after modifying the configuration
systemctl restart prometheus
#View status
systemctl status prometheus
-
Grafana
Enter / usr/local/grafana/bin and execute the following command
chmod +x grafana-cli
./grafana-cli plugins install grafana-piechart-panel
systemctl restart grafana-server
This step is to install a pie chart plug-in. After execution, use the browser to access port 3000 of the server
The account and password are admin
Manual installation
-
Grafana
Unzip to / usr/local
#Unzip it to the current folder and move it to / usr/local directory
tar -xzvf grafana-enterprise-8.4.2.linux-amd64.tar.gz
mv grafana-8.4.2 /usr/local/grafana
Create a new grafana server in / usr/local/grafana / Service file and write the following contents. This file is configured to manage services with systemctl
##grafana-server.service
[Unit]
Description=Grafana Server
After=network.target

[Service]
Type=simple
User=root
WorkingDirectory=/usr/local/grafana
ExecStart=/usr/local/grafana/bin/grafana-server

Restart=on-failure
LimitNOFILE=65536

[Install]
WantedBy=multi-user.target
Set the soft connection after configuration
ln -s /usr/local/grafana/grafana-server.service /lib/systemd/system/
Start grafana
systemctl daemon-reload
systemctl start grafana-server
Access server 3000 port
-
Node_Exporter
Unzip to / usr/local
##Unzip and move to / usr/local
tar -xzvf node_exporter-1.3.1.linux-amd64.tar.gz
mv node_exporter-1.3.1.linux-amd64 /usr/local/node_exporter
At / usr / local / node_ Create a new node in the exporter / directory_ exporter. Service file and write the following contents. Similarly, this file is configured to manage services with systemctl
cd /usr/local/node_exporter
touch node_exporter.service
vi touch node_exporter.service
Write the following
##node_exporter.service
[Unit]
Description=Node Exporter
After=network.target
Wants=network-online.target

[Service]
Type=simple
User=root
ExecStart=/usr/local/node_exporter/node_exporter

Restart=on-failure
LimitNOFILE=65536

[Install]
WantedBy=multi-user.target
Configure soft connection
ln -s /usr/local/node_exporter/node_exporter.service /lib/systemd/system/
Start node_exporter
systemctl daemon-reload
systemctl start node_exporter
View node_exporter status
systemctl status node_exporter
-
Prometheus
Unzip to / usr/local
##Unzip and move to / usr/local
tar -zxvf prometheus-2.34.0-rc.0.linux-amd64.tar.gz
mv prometheus-2.34.0-rc.0.linux-amd64 /usr/local/prometheus
Create a new directory under / prometus / prometus / prometus Service file and write the following contents. Similarly, this file is configured to manage services with systemctl
cd /usr/local/node_exporter
touch node_exporter.service
vi touch node_exporter.service
Write content
##node_exporter.service
[Unit]
Description=Prometheus
After=network.target

[Service]
Type=simple
User=root
WorkingDirectory=/usr/local/prometheus
ExecStart=/usr/local/prometheus/prometheus --config.file=/usr/local/prometheus/prometheus.yml

Restart=on-failure
LimitNOFILE=65536

[Install]
WantedBy=multi-user.target
Configure soft connection
ln -s /usr/local/prometheus/prometheus.service /lib/systemd/system/
Start prometheus
systemctl daemon-reload
systemctl start prometheus
View prometheus status
systemctl status prometheus
to configure
-
Prometheus
Similarly, you also need to configure prometheus after manual installation. The configuration content is the same as the above prometheus configuration, that is, configure / usr / local / prometheus / prometheus YML file
-
Grafana
Log in to Grafana default account password admn/admin

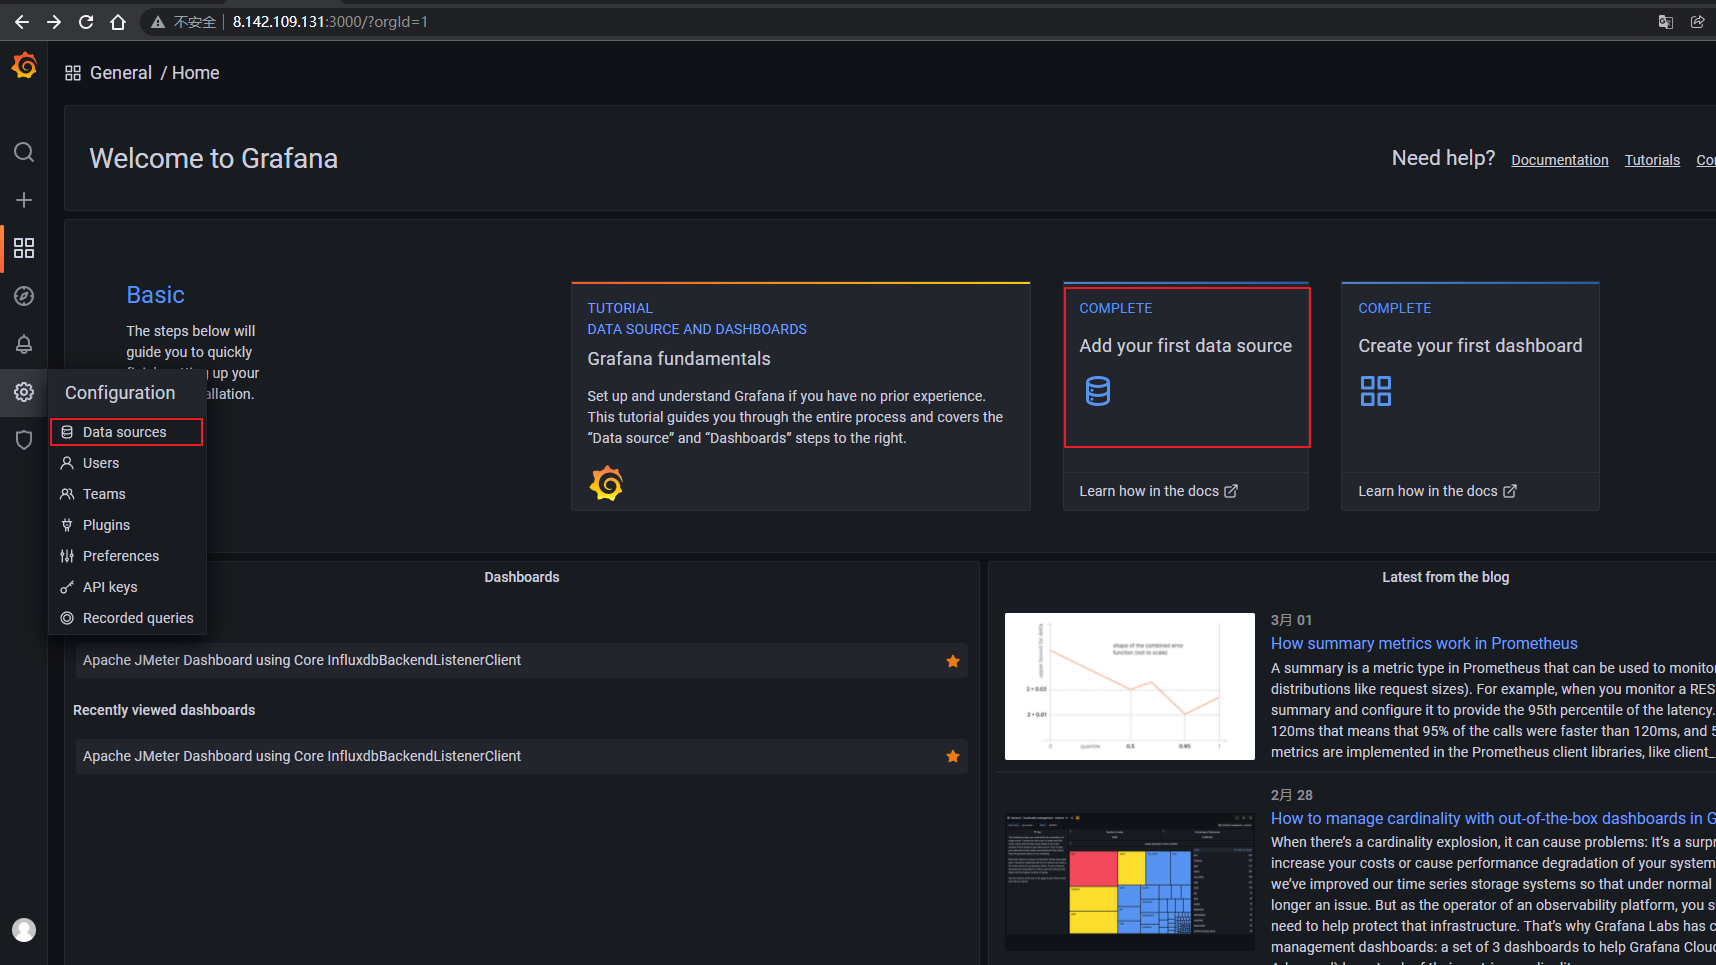
Configure the data source, i.e. where does Grafana get data
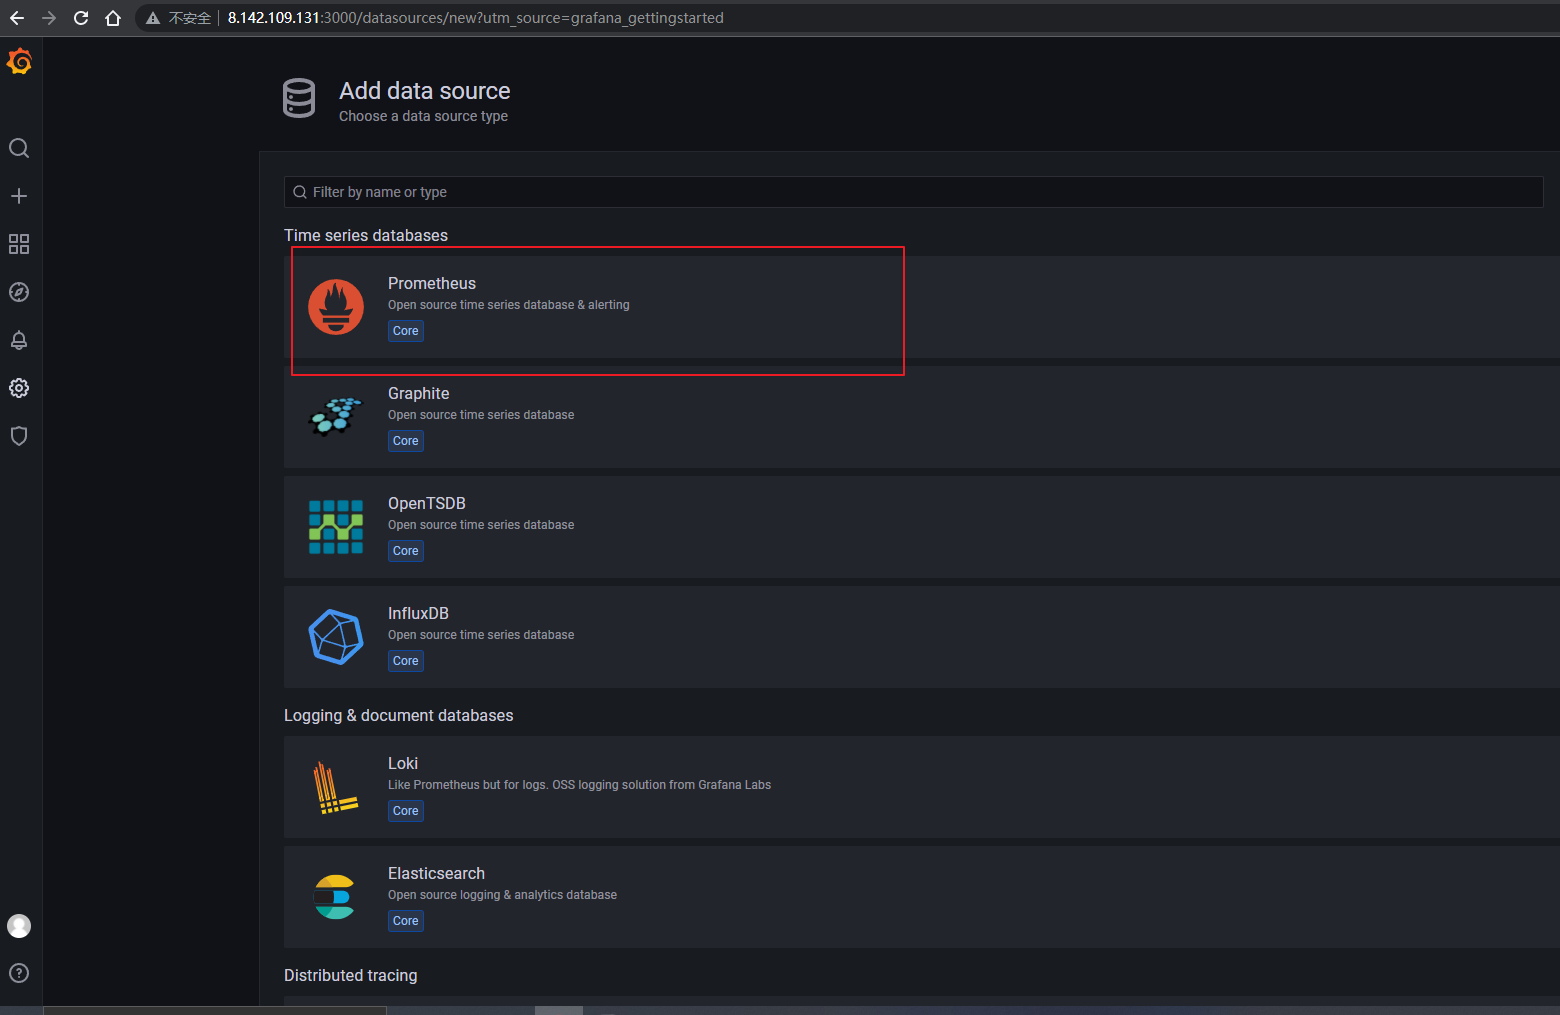
Select Prometheus
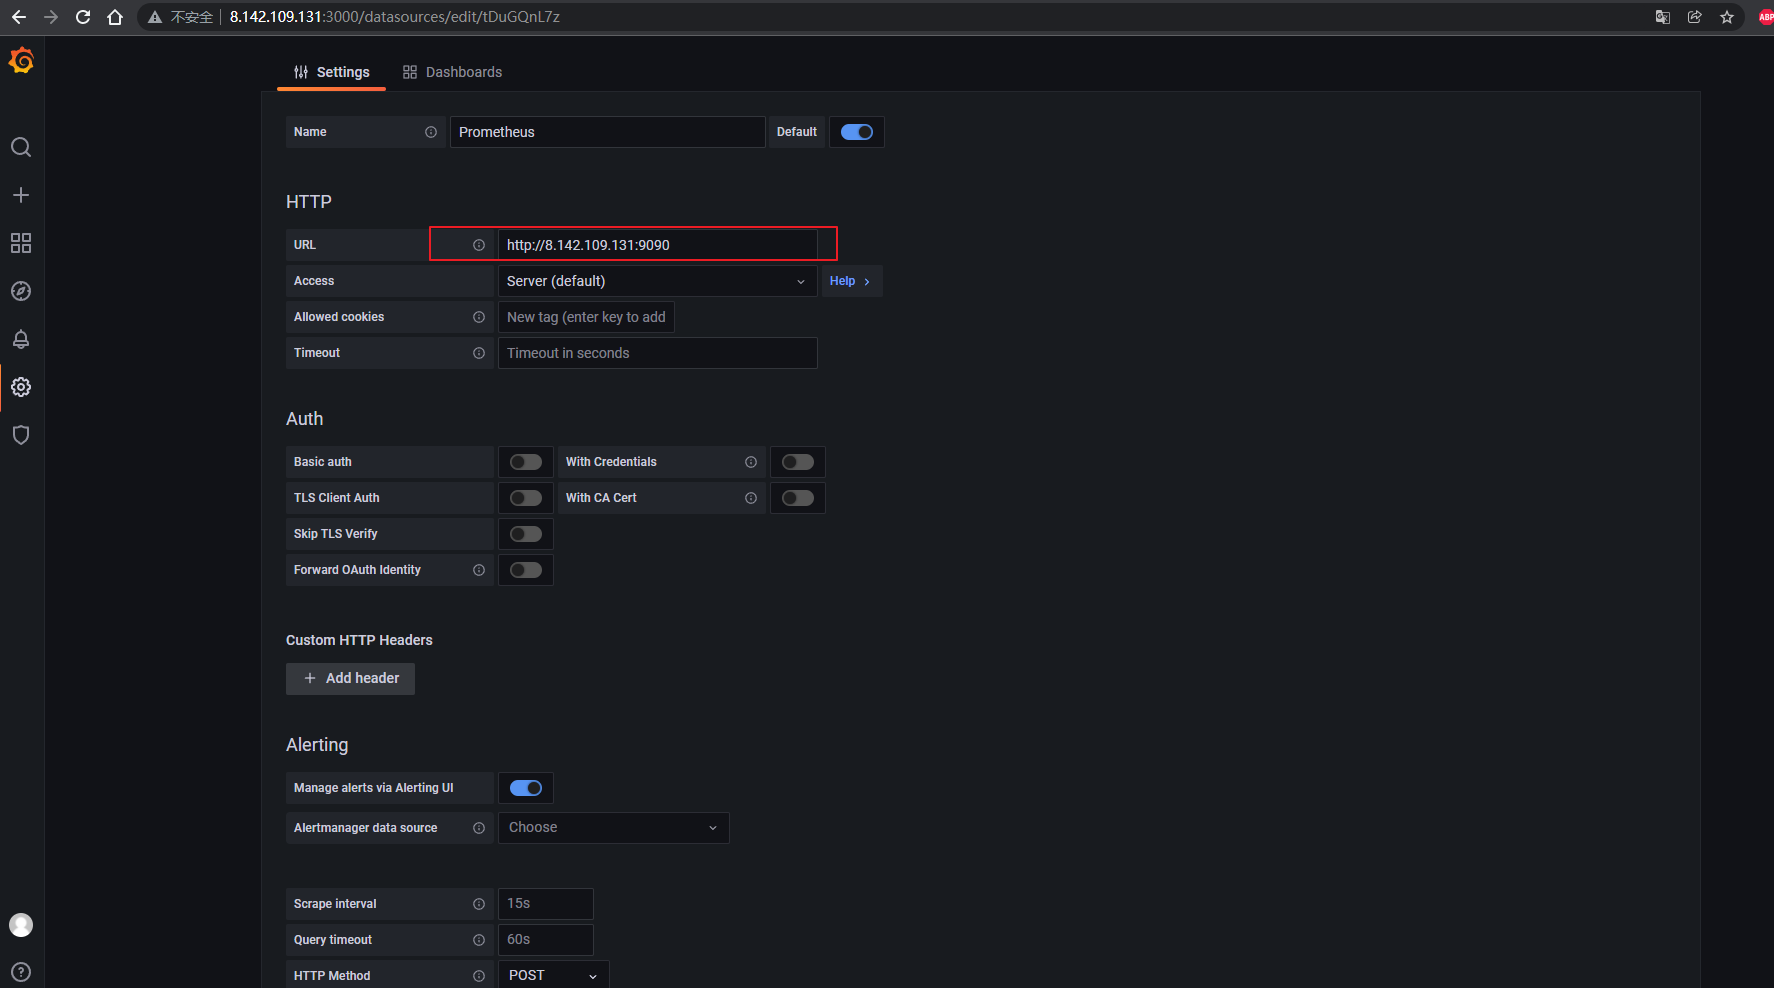
Fill in the address and click Save & test
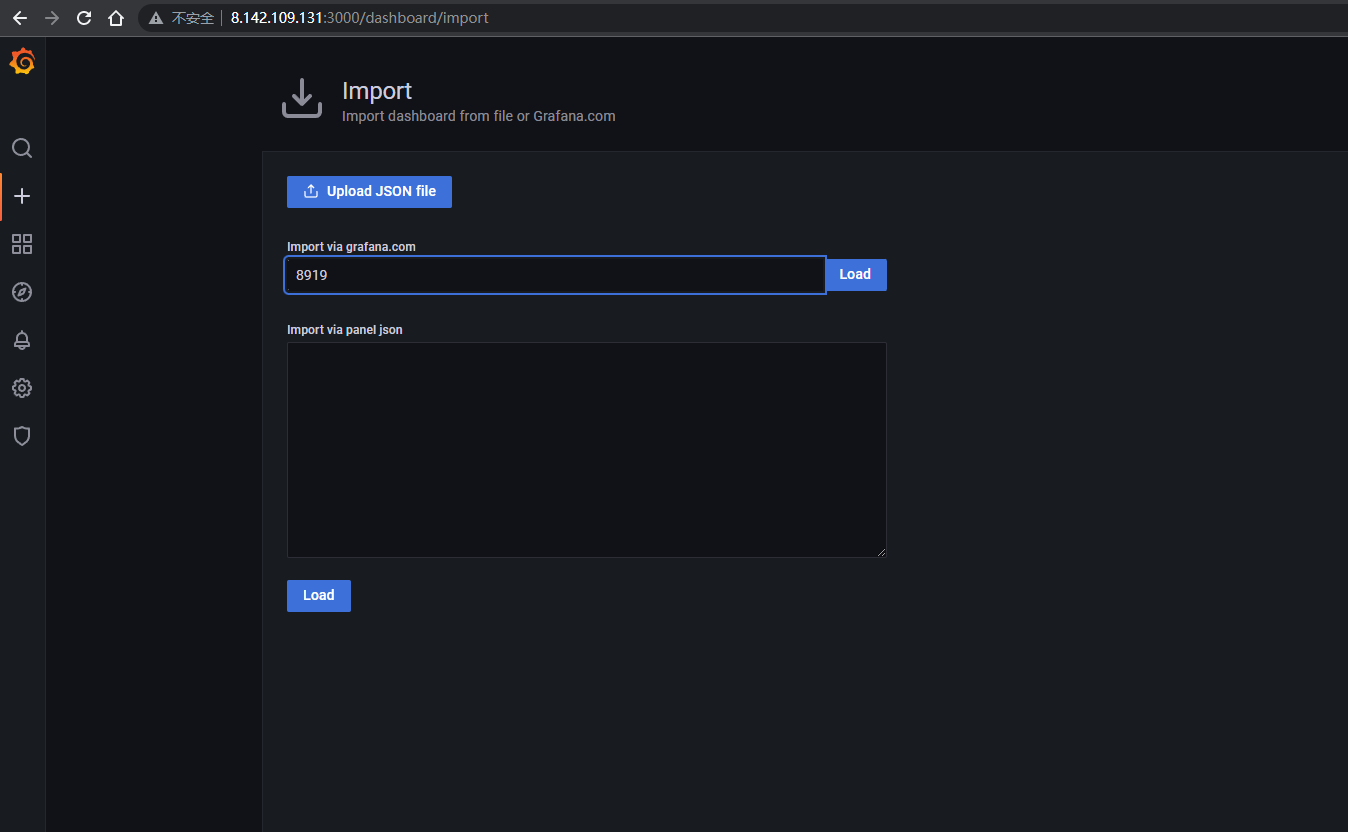
Import the panel with ID 8919, which is the written node_export panel, you can view the effect of this website. https://grafana.com/dashboards/8919
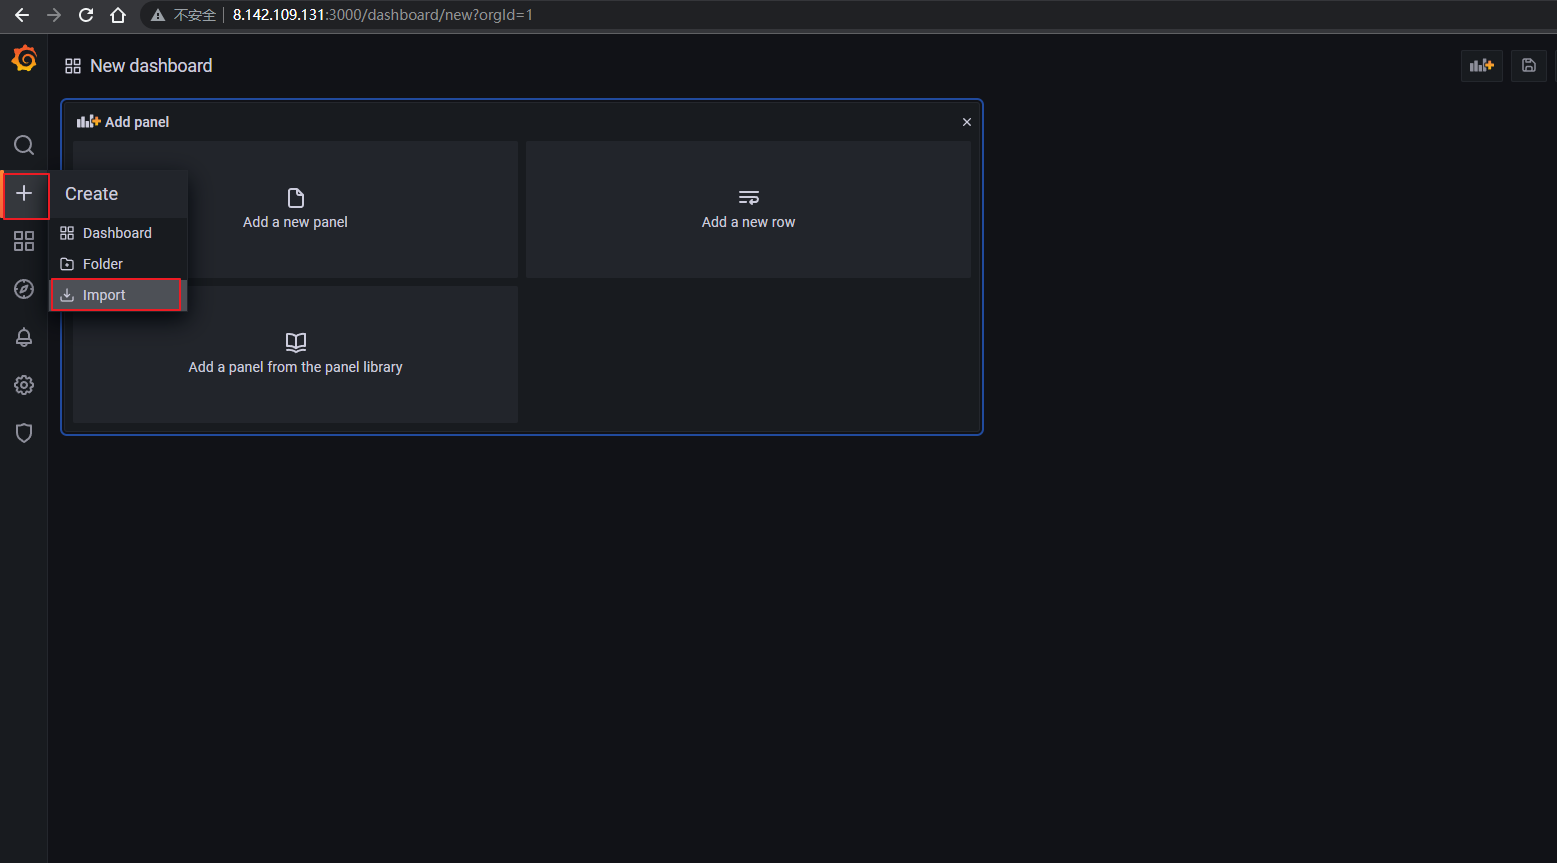
Enter 8919 and click load
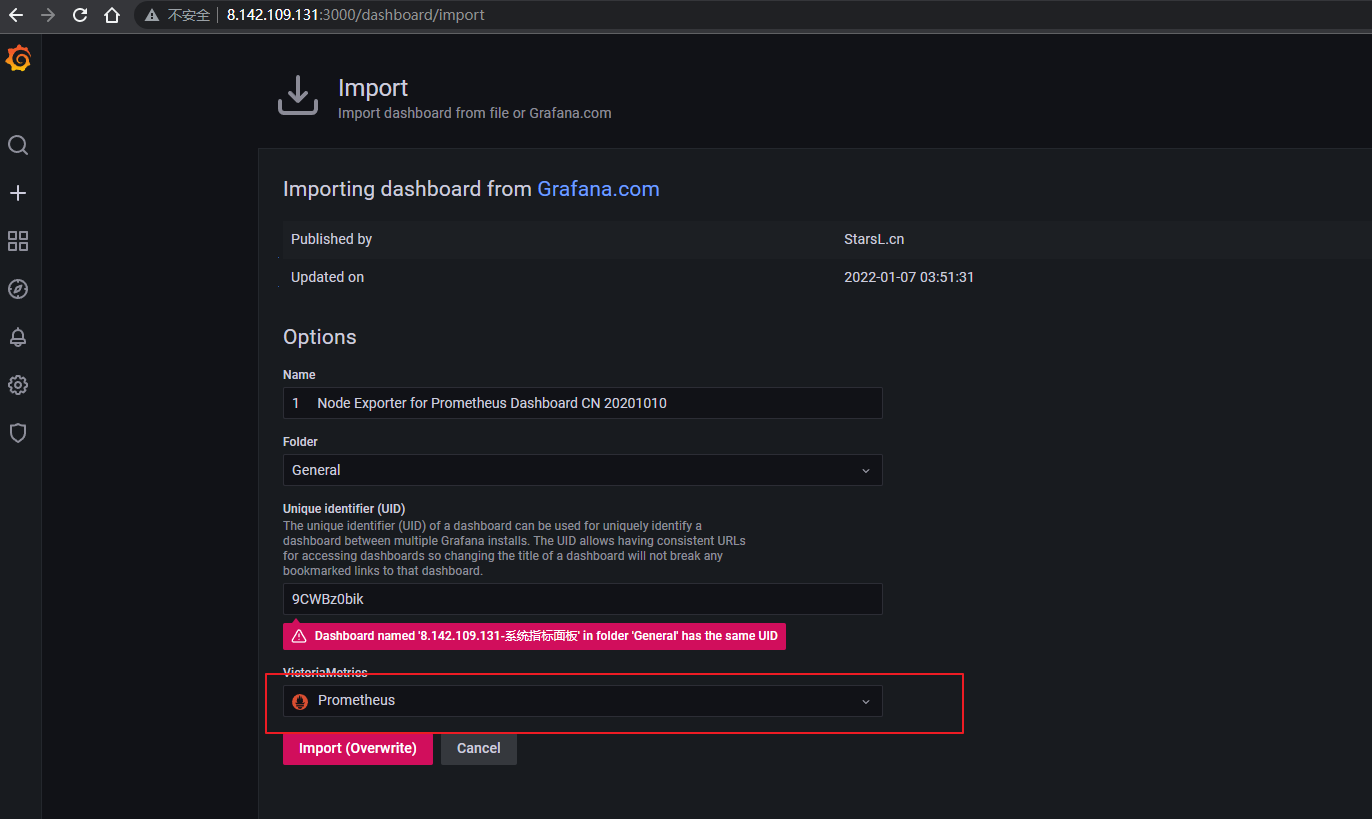
Fill in the name and select the created data source
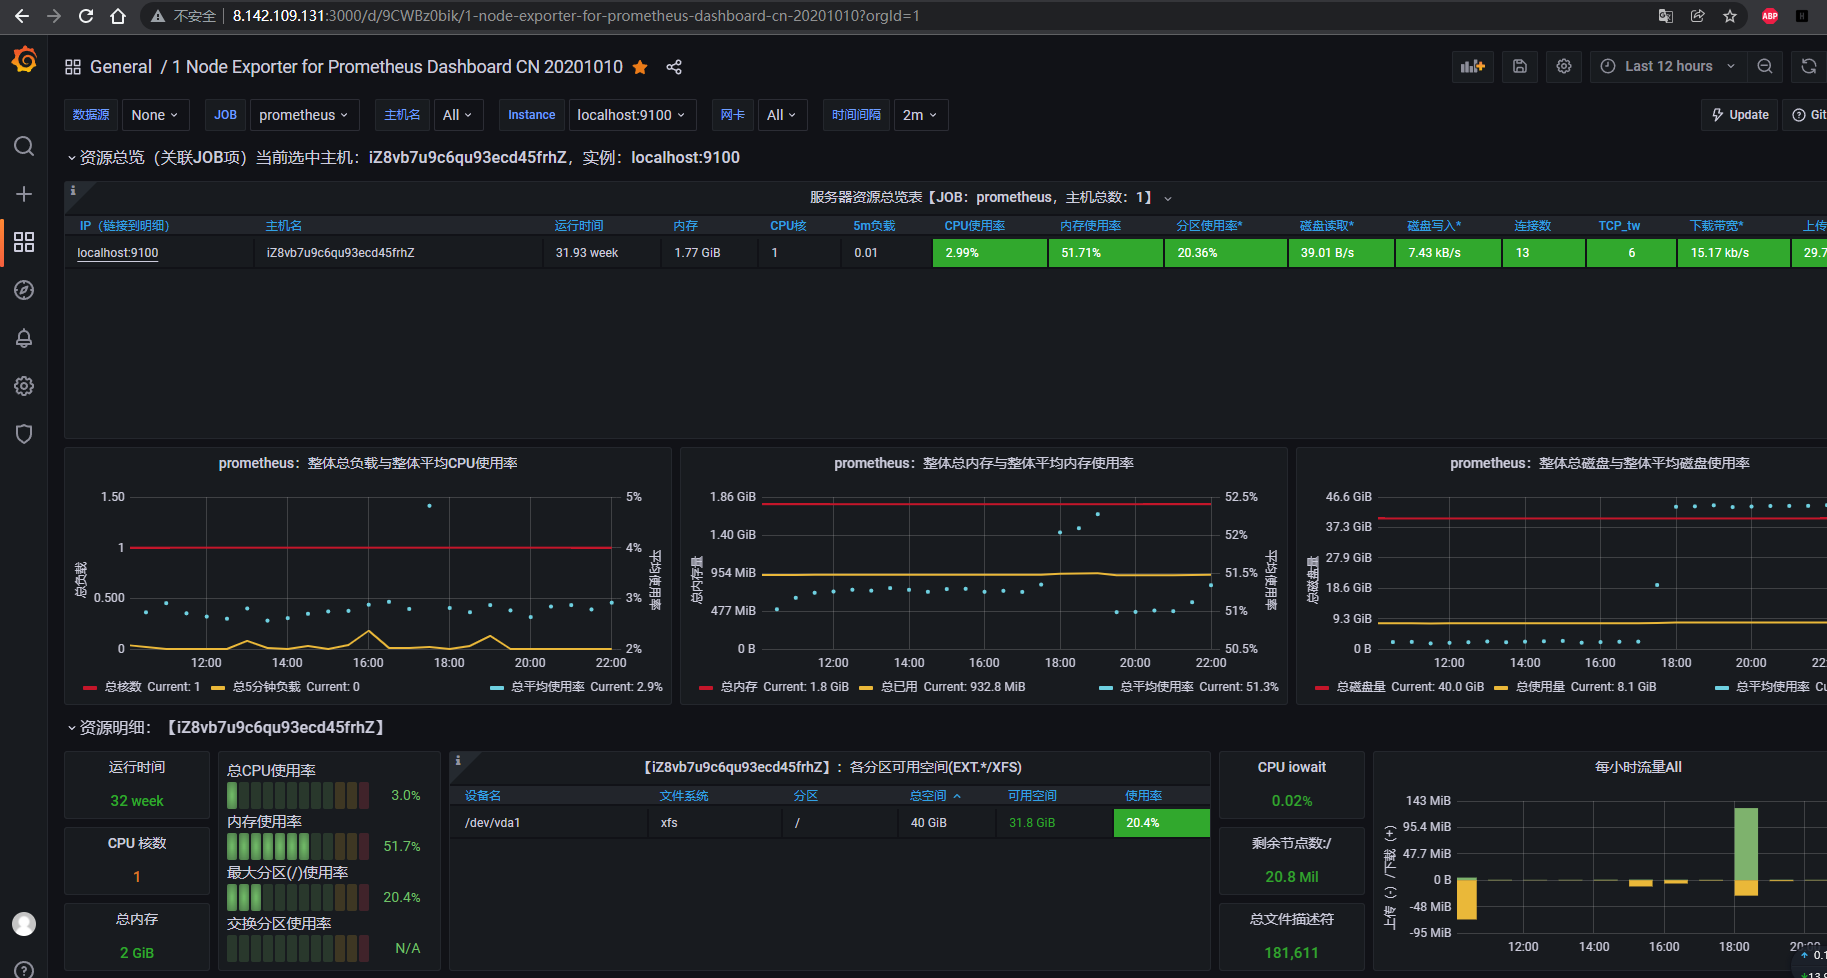
Panel display
You are welcome to pay attention to my subscription number. You will regularly share some articles related to testing. If you have any questions, you are welcome to discuss and study together!