This demand is so common that many fans have consulted me in various communication groups. I happened to see that the document "single cell sequencing of human midbrain requests glial activation and a Parkinson specific neural state" also deliberately describes this process:
The glia cell subsets were subdivided
The description is very clear. When taking subsets after subdivision of each single cell subgroup, the raw counts value of UMI is still required. From the perspective of code:
library(Seurat)
library(ggplot2)
library(clustree)
library(cowplot)
library(dplyr)

load('../3-cell/phe-by-markers.Rdata')
table(phe$celltype)
sce=readRDS('../2-int/sce.all_int.rds')


sce=sce[,phe$celltype %in% c( 'CD4' ,'CD8','neg' )]

sce
sce=CreateSeuratObject(counts = sce@assays$RNA@counts,
                       meta.data = sce@meta.data)
If you can see such a seurat object, you can continue to reduce the dimension and cluster. The standard code is as follows:
sce <- NormalizeData(sce, normalization.method =  "LogNormalize",
                     scale.factor = 1e4)
GetAssay(sce,assay = "RNA")
sce <- FindVariableFeatures(sce,
                            selection.method = "vst", nfeatures = 2000)
sce <- ScaleData(sce)
sce <- RunPCA(object = sce, pc.genes = VariableFeatures(sce))
DimHeatmap(sce, dims = 1:12, cells = 100, balanced = TRUE)
ElbowPlot(sce)

sce <- FindNeighbors(sce, dims = 1:15)
sce <- FindClusters(sce, resolution = 0.8)
table(sce@meta.data$RNA_snn_res.0.8)

set.seed(123)
sce <- RunTSNE(object = sce, dims = 1:15, do.fast = TRUE)
DimPlot(sce,reduction = "tsne",label=T)


sce <- RunUMAP(object = sce, dims = 1:15, do.fast = TRUE)
DimPlot(sce,reduction = "umap",label=T)
head(sce@meta.data)
DimPlot(sce,reduction = "umap",label=T,group.by = 'orig.ident')
It is worth noting that our single-cell subsets are subsets. This seurat object still comes from multiple single-cell samples, so it still needs to be reasonably integrated to some extent. The demonstration code we give you here is:
library(harmony)
seuratObj <- RunHarmony(sce, "orig.ident")
names(seuratObj@reductions)
seuratObj <- RunUMAP(seuratObj,  dims = 1:15,
                     reduction = "harmony")
DimPlot(seuratObj,reduction = "umap",label=T )


sce=seuratObj
sce <- FindNeighbors(sce, reduction = "harmony",
                     dims = 1:15)
sce <- FindClusters(sce, resolution = 0.1)
table(sce@meta.data$seurat_clusters)
DimPlot(sce,reduction = "umap",label=T)
ggsave(filename = 'harmony_umap_recluster_by_0.1.pdf')
DimPlot(sce,reduction = "umap",label=T,
        group.by = 'orig.ident')
ggsave(filename = 'harmony_umap_sce_recluster_by_orig.ident.pdf')
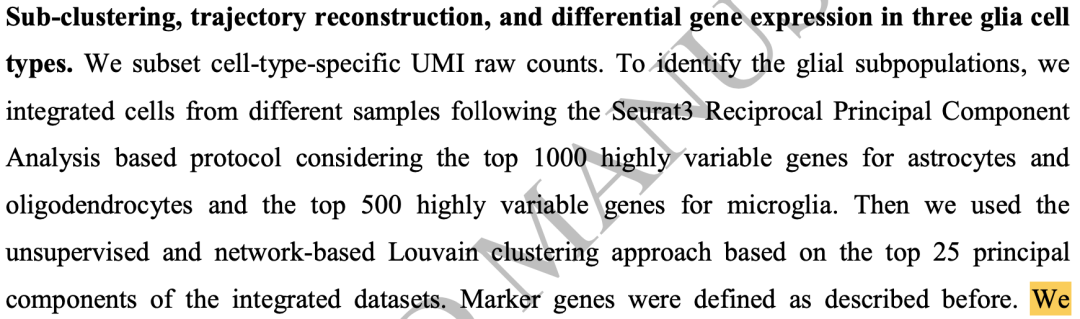
The document "single cell sequencing of human midbrain requests glial activation and a Parkinson specific neural state" subdivides the common cell subsets. Firstly, the first level is dimensionality reduction clustering;
The respective marker genes can be easily obtained by looking at the chart. There is also such a gene list in the single cell of Parkinson's disease we shared previously:
astrocytes = c("AQP4", "ADGRV1", "GPC5", "RYR3")
  endothelial = c("CLDN5", "ABCB1", "EBF1")
  excitatory = c("CAMK2A", "CBLN2", "LDB2")
  inhibitory = c("GAD1", "LHFPL3", "PCDH15")
  microglia = c("C3", "LRMDA", "DOCK8")
  oligodendrocytes = c("MBP", "PLP1", "ST18")
  OPC='Tnr,Igsf21,Neu4,Gpr17'
  Ependymal='Cfap126,Fam183b,Tmem212,pifo,Tekt1,Dnah12'
  pericyte=c(  'DCN', 'LUM',  'GSN' ,'FGF7','MME', 'ACTA2','RGS5')
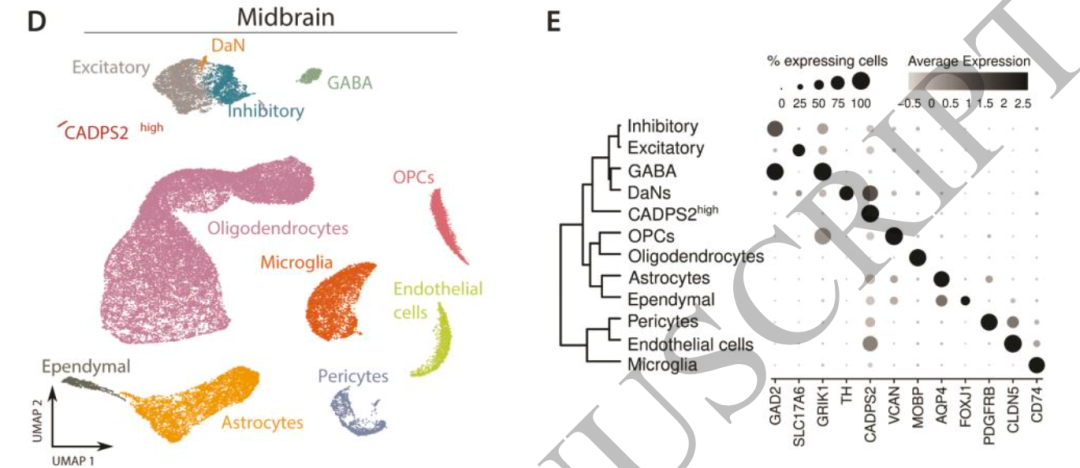
Here, the author shows the total number and proportion of cells in two groups of different cell subsets, which is not in line with my conventional practice, as shown below:
It can be seen that both microglia and Astrocytes are single-cell subsets with a number of about 4000. The author describes the subdivision of these two cell subsets in the text:

Breakdown of Astrocytes
Generally speaking, if there is no good accumulation in its own field, it is difficult to give each sub group a biological name. It can be marked by its high expression gene or activated transcription factor.
If you really think my tutorial is helpful to your scientific research project and makes you enlightened, or your project uses a lot of my skills, please add a short thank you when publishing your achievements in the future, as shown below:
We thank Dr.Jianming Zeng(University of Macau), and all the members of his bioinformatics team, biotrainee, for generously sharing their experience and codes.
If I have traveled around the world in universities and research institutes (including Chinese mainland) in ten years, I will give priority to seeing you if you have such a friendship.