catalogue
Question 1: Chinese display of matplotlib drawing
Question 2: the X-axis time of the graph always shows 1970
Question 3. Difference of synthetic square wave caused by one bracket
Question 4: attributeerror: module 'SciPy misc' has no attribute 'imread'
1. Problem Description: Matplotlib Pyplot # there are sub graphs that are not displayed
preface
Computer environment: macOS Monterey 12.2.1, python 3 ten point two
Tools: Sublime Text 4, pychar 2021.3
Learning video: Dane education Xu Ming's data analysis course in September 2019. The following artificial intelligence courses have not been learned.
Although it is a course in 2019, most of the codes are the same. Only a few of them can not be debugged in my environment.
Python data analysis full set of videos (from shallow to deep)_ Beep beep beep_ bilibili.
Courseware material: Download address Password: USTC (from B station up Master - Jiucai's message , the video is the same as the link above. The last three are missing, but it has no impact. I didn't understand the last three)
Question 1: Chinese display of matplotlib drawing
The matplotlib course on the second day may be different from the teacher's version. The settings of the displayed pictures are less, but it has no impact.
Later, when I began to want to display Chinese, I had a mouth problem. For the solution, refer to my previous records: Python learning process problem record (II): Matplotlib Chinese display problem
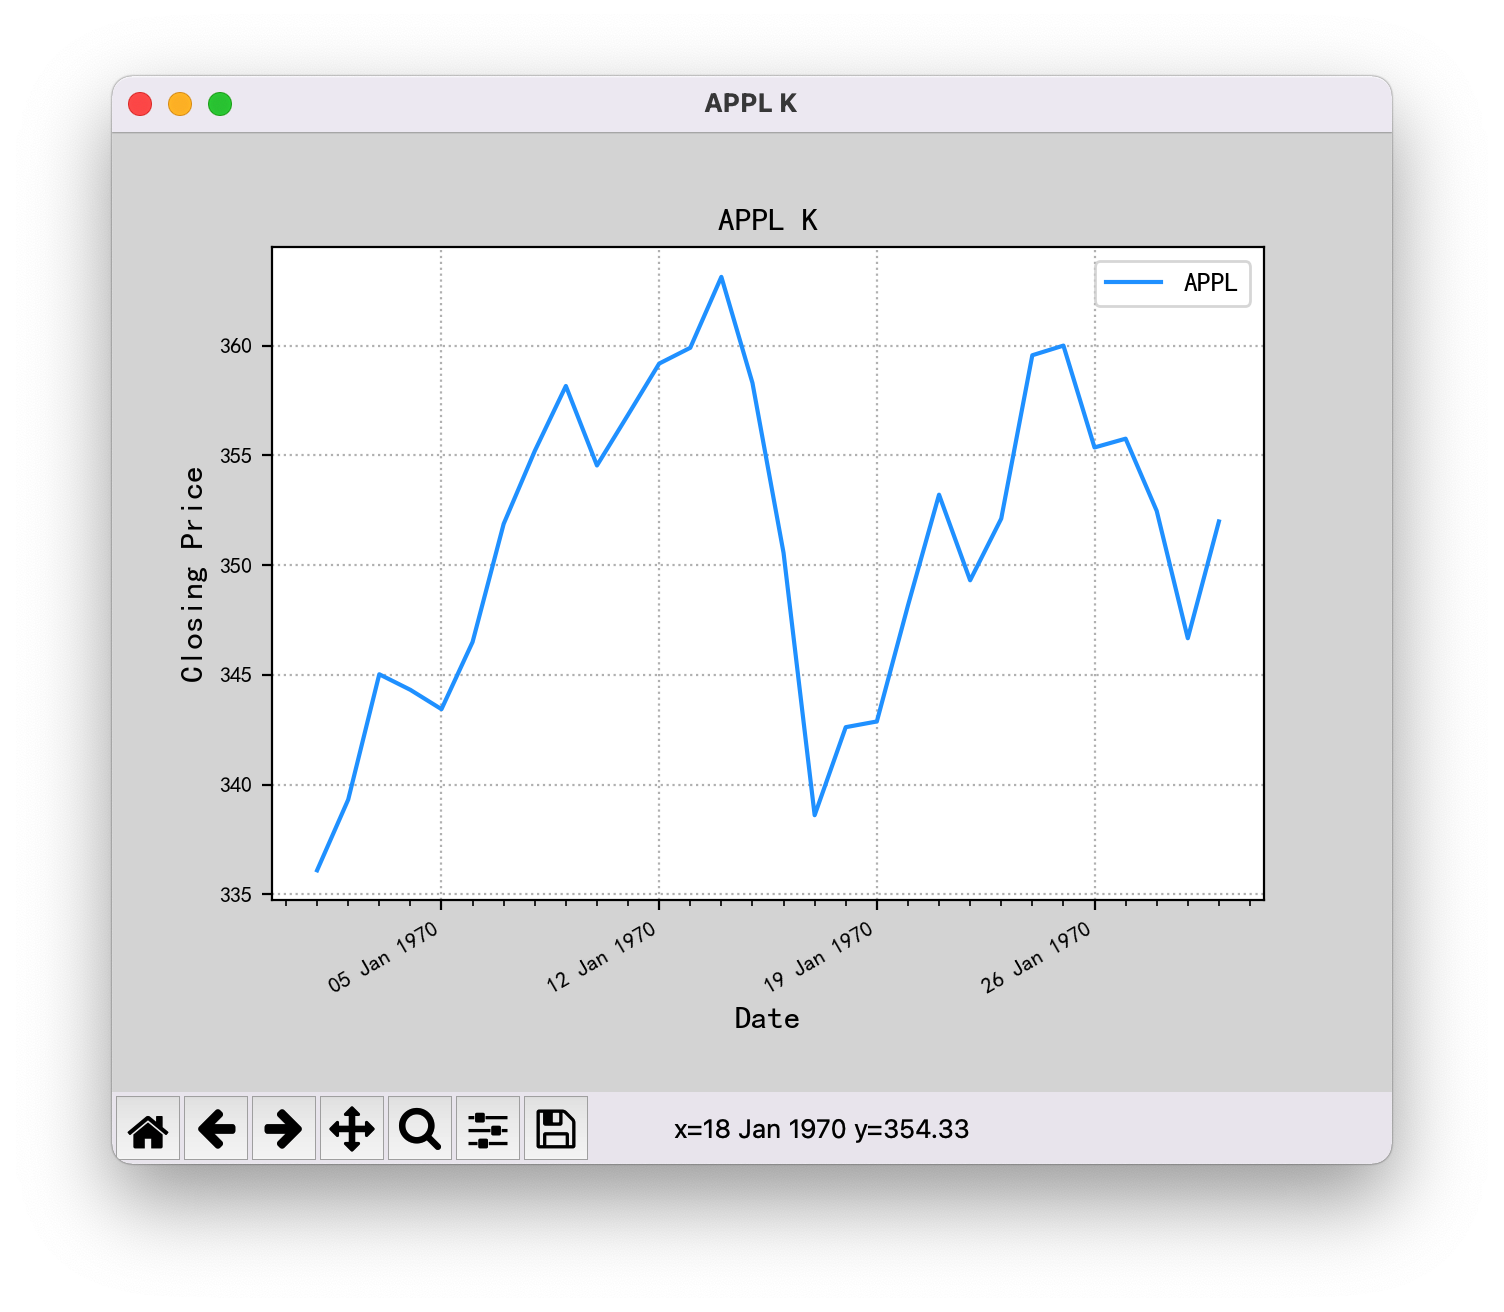
Question 2: the X-axis time of the graph always shows 1970
1. Problem description
On day 3, 3.13 and 3.14, numpy loads files 01 and 02 courses.
The code is as follows. After running, the X axis of the graph should show 2011, but it shows 1970.
import datetime as dt

import matplotlib.dates as md
import matplotlib.pyplot as mp
import numpy as np


# Date conversion function
def dmy2ymd(dmy):
    dmy = str(dmy, encoding='utf-8')
    time = dt.datetime.strptime(dmy, '%d-%m-%Y').date()
    t = time.strftime('%Y-%m-%d')
    return t


# Read data
dates, opening_prices, highest_prices, lowest_prices, closing_prices = np.loadtxt(
    '../da_data/aapl.csv',
    delimiter=',',
    usecols=(1, 3, 4, 5, 6),  # Read columns 1, 3, 4, 5 and 6 (subscript starts from 0)
    dtype='U10,f8,f8,f8,f8',  # Specifies the type of elements returned in each column array
    unpack=True,  # Unpacking by column
    converters={1: dmy2ymd}
)

# Draw a line chart of dates and closing price
mp.figure('APPL K', facecolor='lightgray')
mp.title('APPL K')
mp.xlabel('Date', fontsize=12)
mp.ylabel('Closing Price', fontsize=12)
mp.grid(linestyle=':')
# Get the axis
ax = mp.gca()
# Set the major scale locator as the week locator (display the major scale text every Monday)
ax.xaxis.set_major_locator(md.WeekdayLocator(byweekday=md.MO))
ax.xaxis.set_major_formatter(md.DateFormatter('%d %b %Y'))
# Set the minor scale locator as the daily locator
ax.xaxis.set_minor_locator(md.DayLocator())
mp.tick_params(labelsize=8)

dates = dates.astype(md.datetime.datetime)
print(dates)
mp.plot(dates, closing_prices, color='dodgerblue',
        linestyle='-', label='APPL')
mp.gcf().autofmt_xdate()
mp.legend(loc=1)
mp.show()
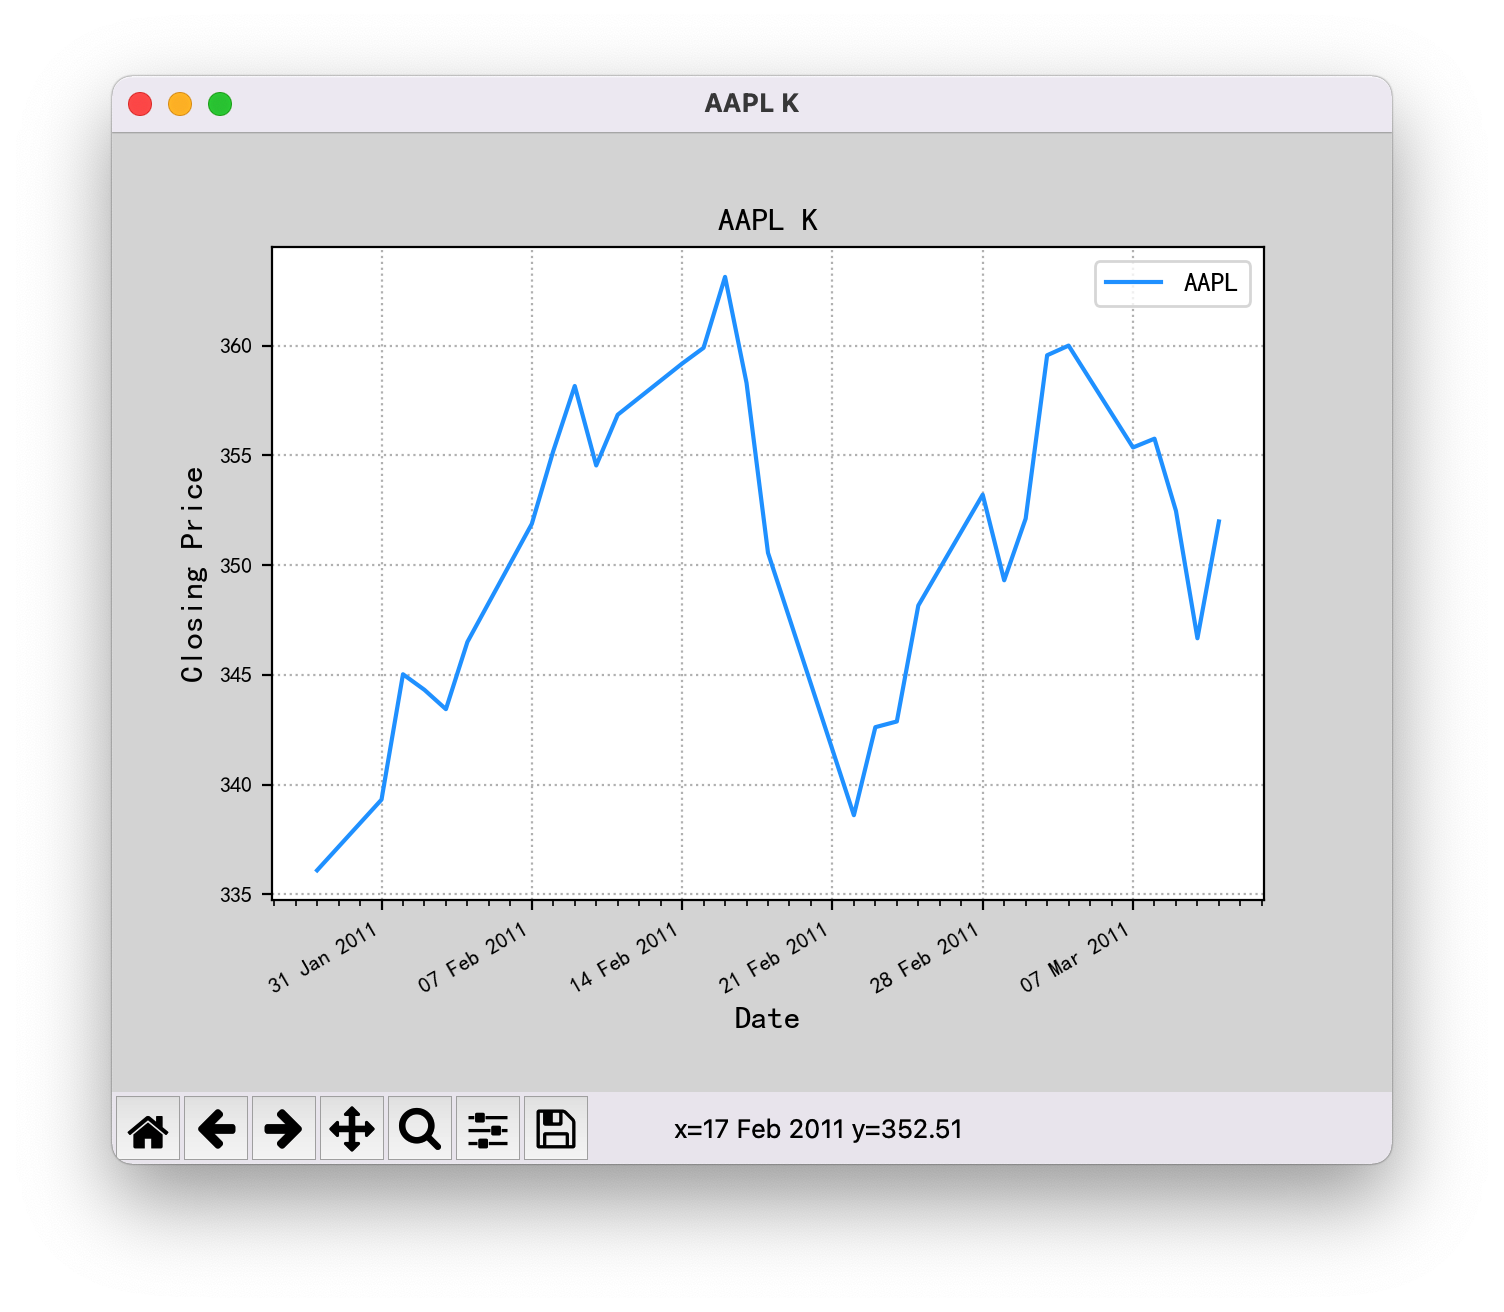
2. Causes of problems
By comparing with the code that runs the correct graphics, it is found that the problem is: when reading the file data, set the type of dates to U10, and the string format passes datetime Datetime conversion cannot display the date normally.
3. Solutions
- The first method: directly set the data type to date type M8[D] when reading the file.
# error setting
...
dtype='U10,f8,f8,f8,f8',
...

# Correct setting
...
dtype='M8[D],f8,f8,f8,f8',
...
- The second type: when reading the file, the dates type can be set to string U10, but the type can be converted to M8[D] later through astype().
...
dates = dates.astype('M8[D]') # Convert data type U10 to M8[D]
dates = dates.astype(md.datetime.datetime)
mp.plot(...)
...
After the two methods are modified, the X-axis date of the drawing can be displayed normally.
Question 3. Difference of synthetic square wave caused by one bracket
1. Problem description
6.10 trigonometric function and general function course on day 6.
The code is as follows. When drawing an image, although there is no error, the drawn image is different from that of the teacher.
import matplotlib.pyplot as mp
import numpy as np

x = np.linspace(-2 * np.pi, 2 * np.pi, 1000)
y1 = 4 * np.pi * np.sin(x)
y2 = 4 / 3 * np.pi * np.sin(3 * x)
y3 = 4 / 5 * np.pi * np.sin(5 * x)

# Superposition sine function, synthetic square wave
y = np.zeros(x.size)
print(x.size)
for i in range(1, 1000):
    y += 4 / ((2 * i - 1) * np.pi) * np.sin((2 * i - 1) * x)

mp.grid(linestyle=':')
mp.plot(x, y1, label='y1', alpha=0.2)
mp.plot(x, y2, label='y2', alpha=0.2)
mp.plot(x, y3, label='y3', alpha=0.2)
mp.plot(x, y, label='y')
mp.legend()
mp.show()
Images I draw: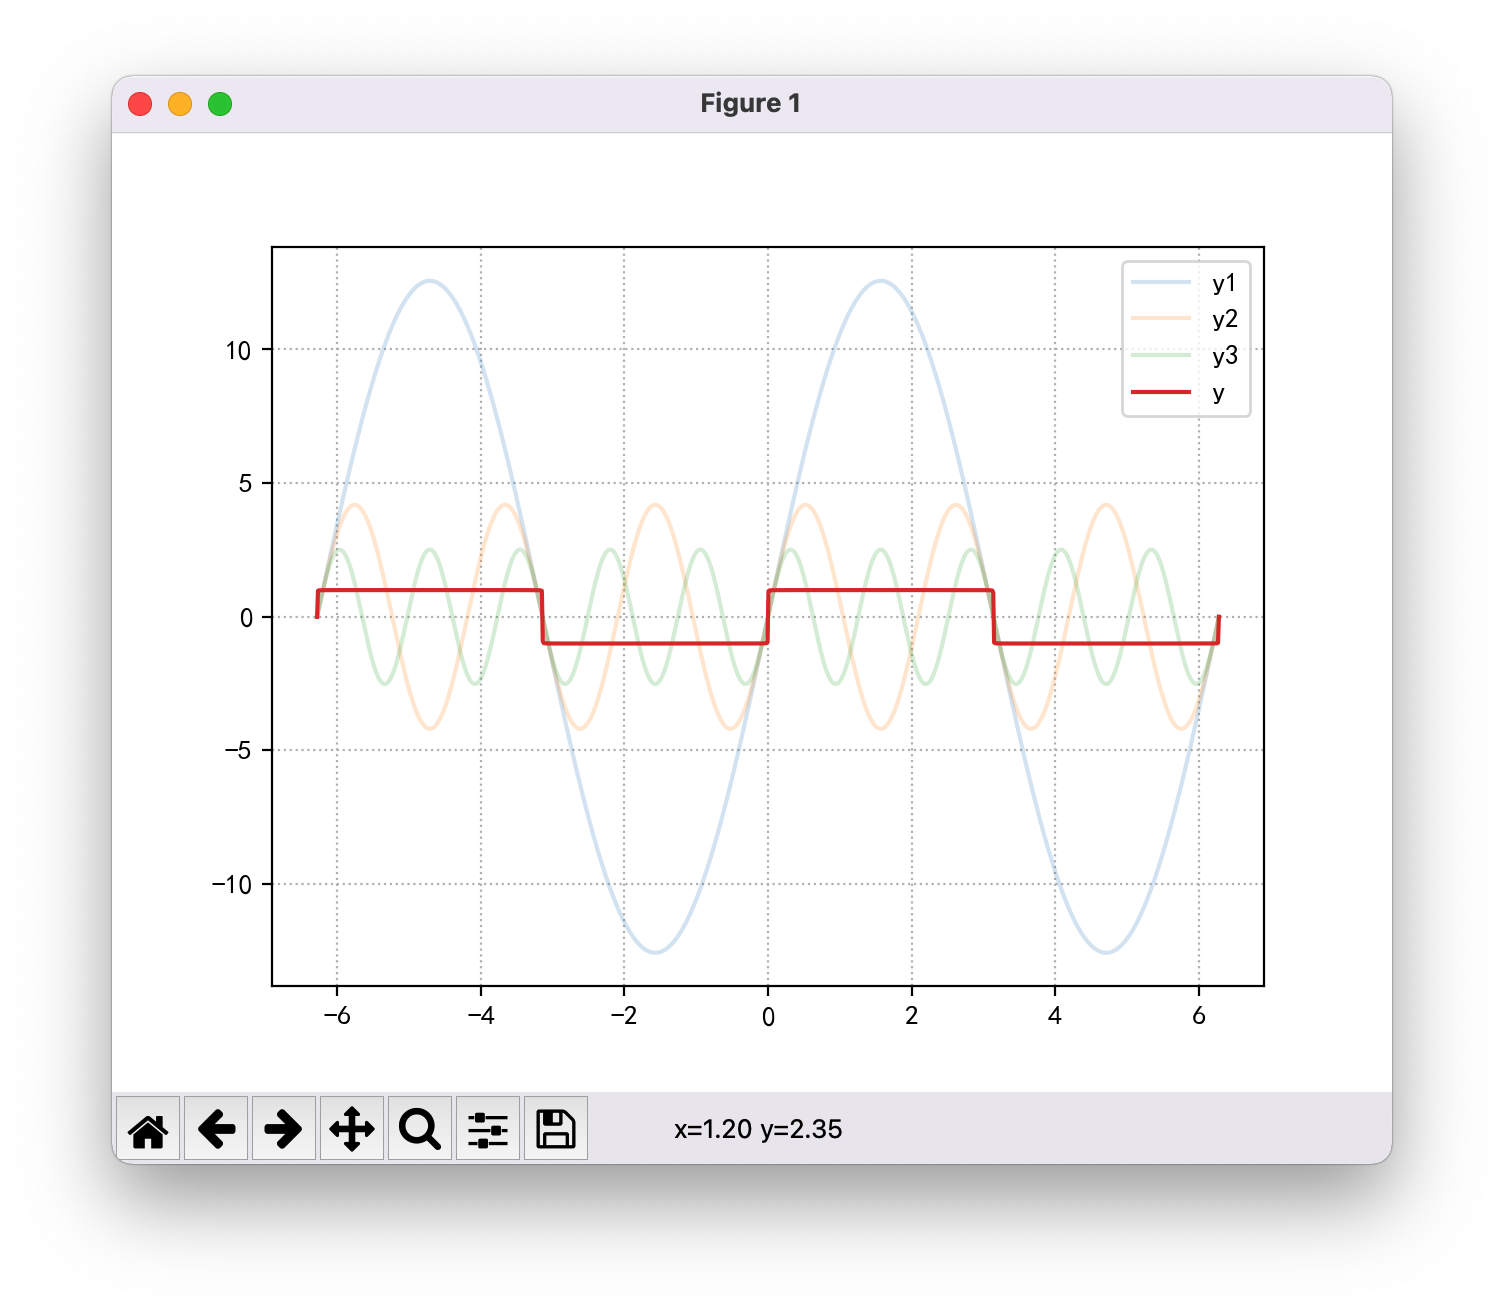
Images drawn by the teacher: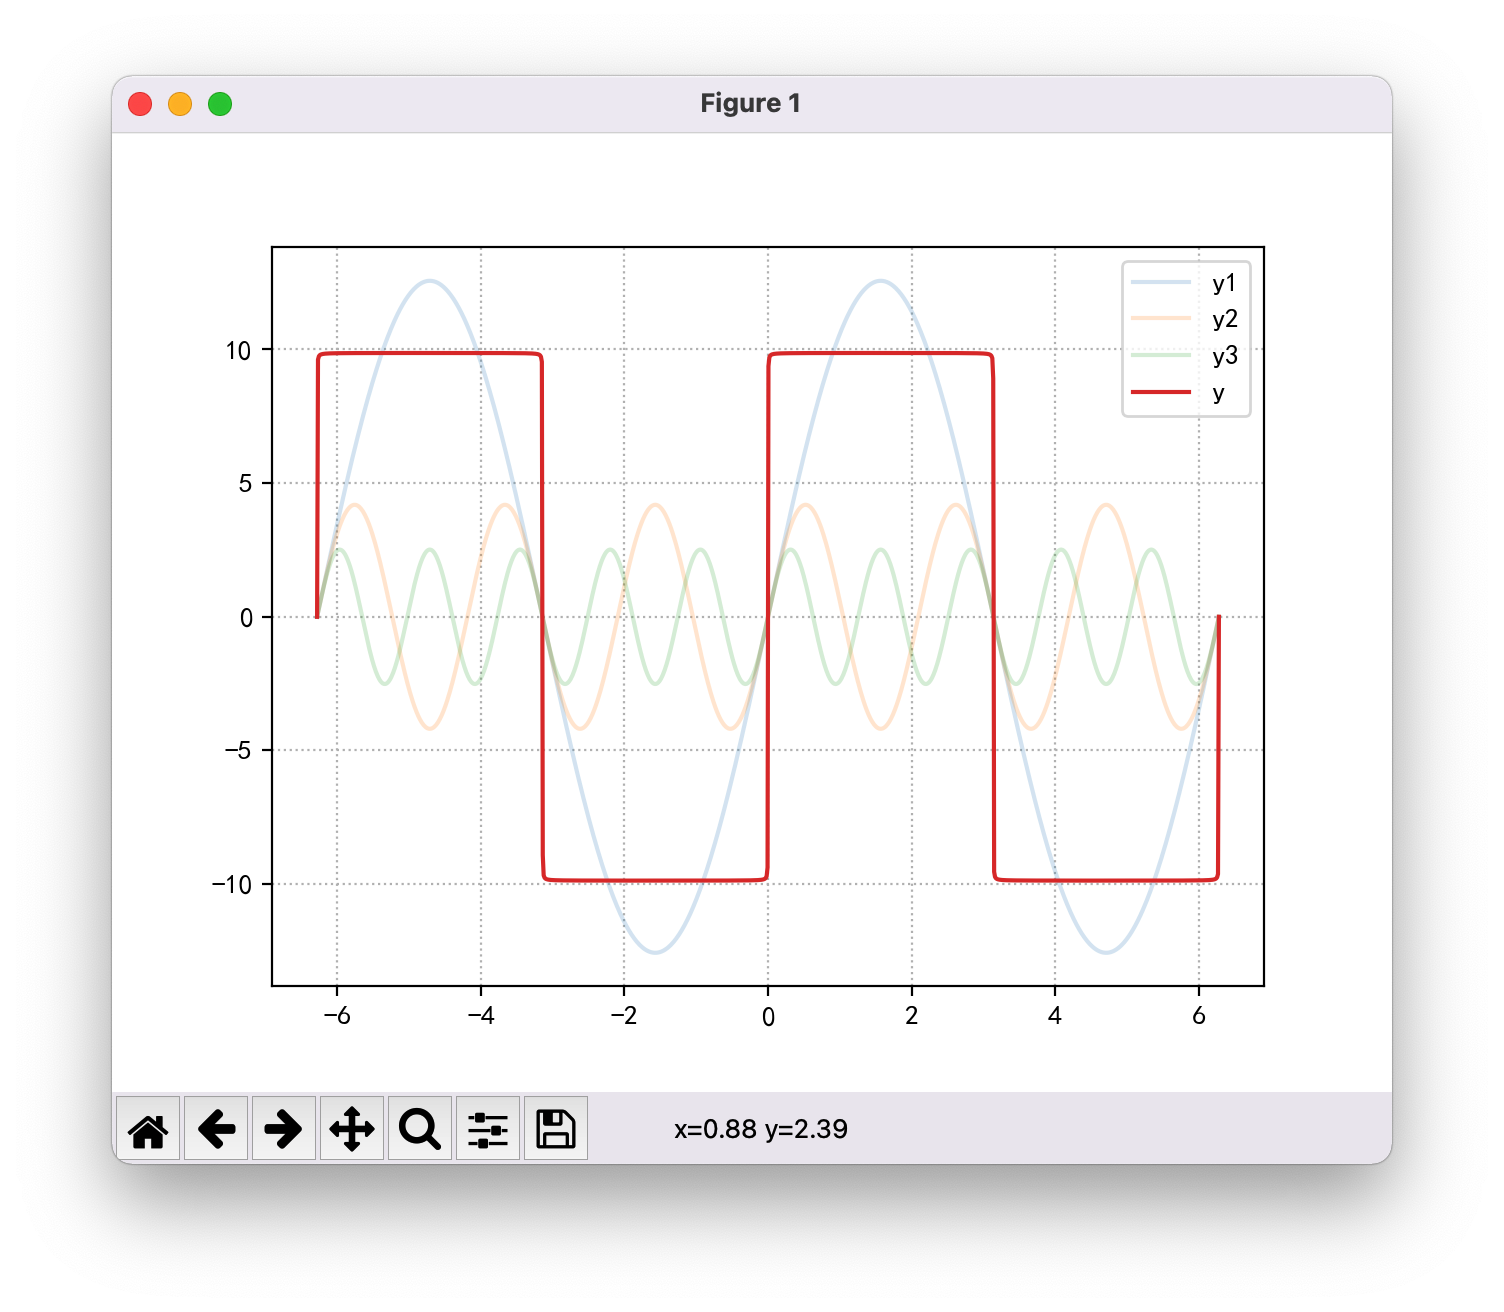
2. Causes of problems
Through code comparison, the only difference is that I have one more bracket:
- My: y + = 4 / ((2 * I - 1) * NP pi) * np. sin((2 * i - 1) * x)
- Teacher's: y + = 4 / (2 * I - 1) * NP pi * np.sin((2 * i - 1) * x)
3. Problem analysis
A bracket makes a pi in the denominator and a pi in the numerator, which is completely careless.
Question 4: attributeerror: module 'SciPy misc' has no attribute 'imread'
1. Problem description
6.11 eigenvalues and eigenvectors on day 6.
Part of the code is as follows: attributeerror: module 'SciPy misc' has no attribute 'imread'.
import numpy as np
import matplotlib.pyplot as mp
import scipy.misc as sm
...
# Read picture, RGB format
original = sm.imread('../da_data/lily.jpg',True)

# Extract eigenvalues
img = np.mat(original)
eigvals, eigvecs = np.linalg.eig(img)
2. Causes of problems
scipy discards some functions in the misc Library in the new version, including imread,imresize and imsave.
- You can reduce the version of SciPy and use a version that also supports imread, such as scipy1 Version 1.2
- Instead of using other modules, I use Matplotlib imread of pyplot module reads the image.
However, there is a problem in the operation. When extracting the feature quantity after reading, it displays: ValueError: shape too large to be a matrix. Because:
- Use original = SM Imread ('.. / da_data / lily. JPG', true) the image read is a grayscale image, original Shape is (512512).
- Use original = MP Imread ('.. / da_data / lily. JPG') reads RGB image, original Shape is (512512,3)
Therefore, it is necessary to convert the read RGB image into a gray image so that the shape of the image is (512512).
3. Solutions
Define a function to convert RGB image into gray image. The code is as follows.
- 0.299, 0.587 and 0.114 set the weighted average value in RGB as gray
- These three weighting values can be set by themselves, or the average value of RGB can be used. The method can be used for network search.
def rgb2gray(rgb):        # Convert RGB format to grayscale mode
    return np.dot(rgb[...,:3], [0.299, 0.587, 0.114])
original1 = rgb2gray(original)
After such conversion, extract the characteristic value again, and there will be no error.
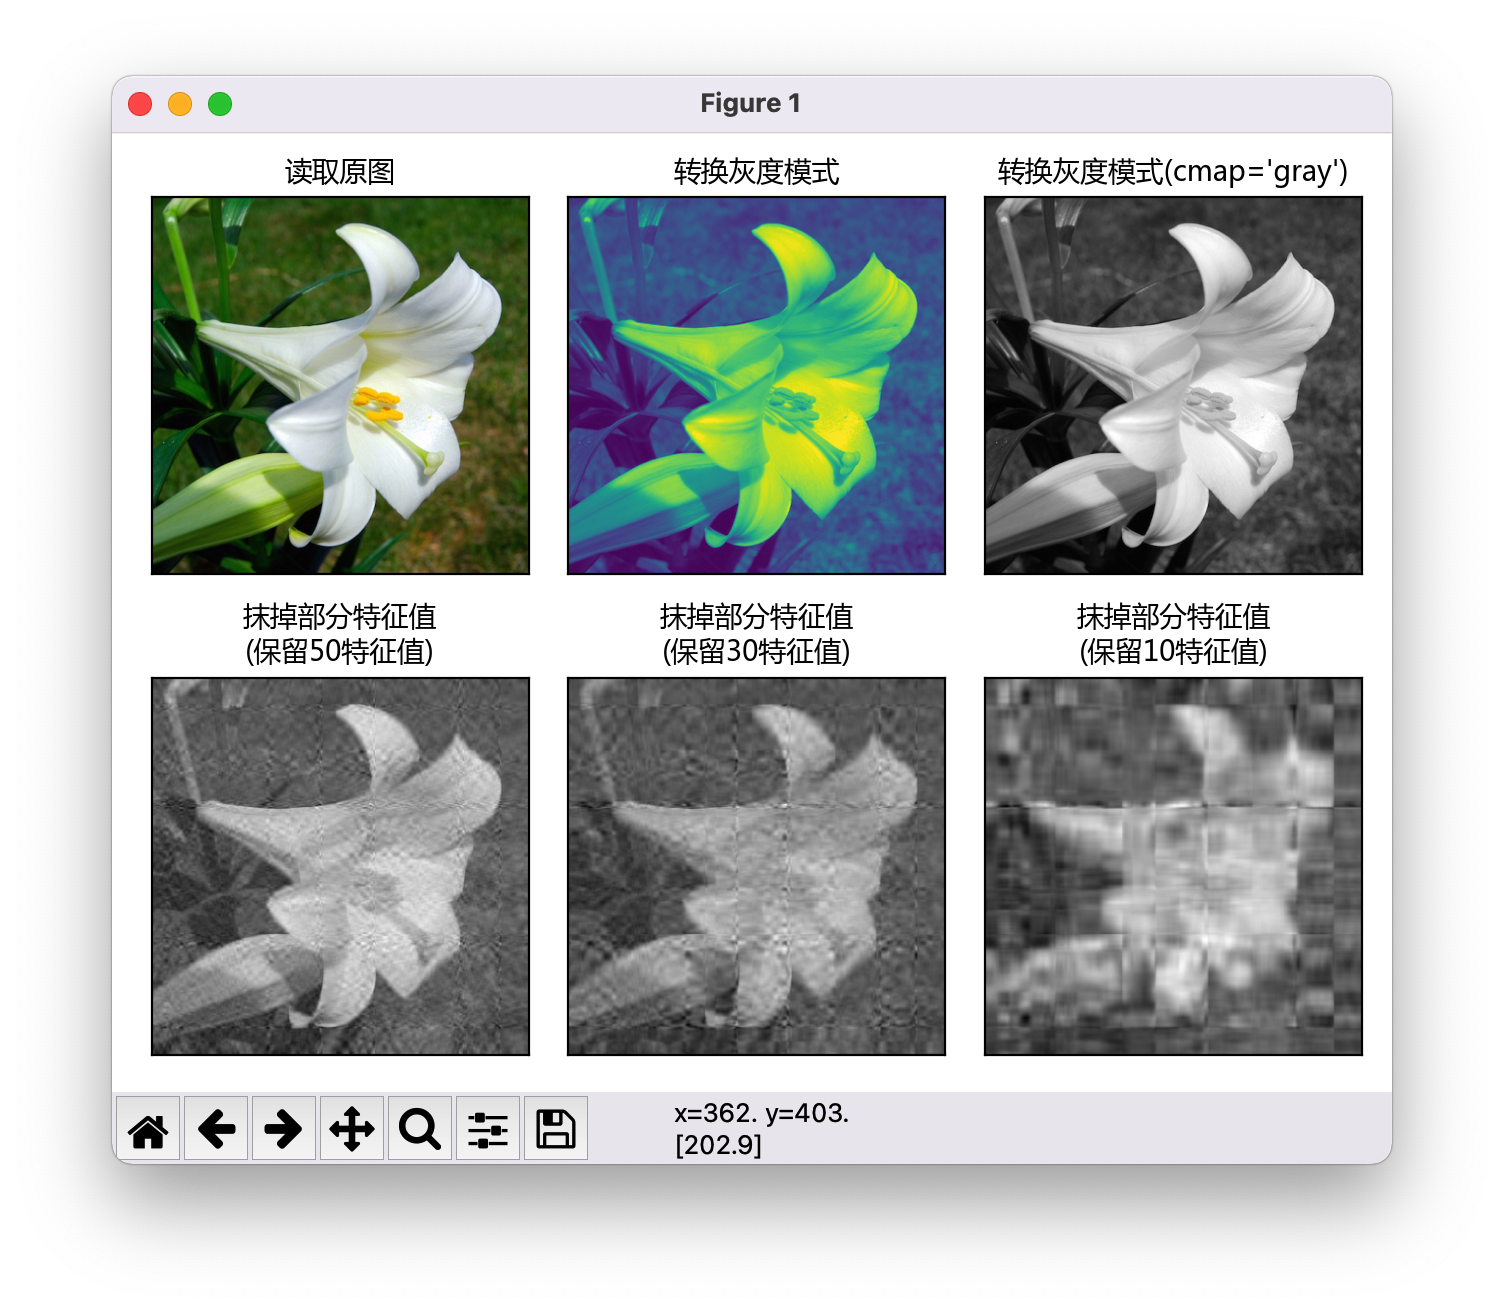
The complete code is as follows. Draw the picture as shown in the figure.
- You can see that the grayscale image converted by function directly uses MP The image drawn by imshow (original1) is not a gray-scale image, and the display color is strange. The CMAP parameter needs to be added to display the gray-scale image MP imshow(original1,cmap='gray')
import numpy as np
import matplotlib.pyplot as mp

mp.rcParams['font.sans-serif'] = 'Microsoft Yahei'  # Display Chinese characters SimHei bold, simsum song style, Microsoft Yahei, Microsoft Yahei
mp.rcParams['axes.unicode_minus'] = False
# Read picture, RGB format
original = mp.imread('../da_data/lily.jpg')
print(original.shape,type(original),original.dtype,original.size)

# Convert RGB format to grayscale mode
def rgb2gray(rgb):
    return np.dot(rgb[...,:3], [0.299, 0.587, 0.114])
original1 = rgb2gray(original)

# Extract eigenvalues
img = np.mat(original1)
print(original1.shape)
eigvals, eigvecs = np.linalg.eig(img)
# # Erase some eigenvalues and generate a new picture
eigvals[50:] = 0
dst1 = eigvecs * np.diag(eigvals) * eigvecs.I
eigvals[30:] = 0
dst2 = eigvecs * np.diag(eigvals) * eigvecs.I
eigvals[10:] = 0
dst3 = eigvecs * np.diag(eigvals) * eigvecs.I


mp.subplot(231)
mp.imshow(original)
mp.title('Read original image',fontsize=10)
mp.xticks([])
mp.yticks([])
mp.tight_layout()

mp.subplot(232)
mp.title('Convert grayscale mode',fontsize=10)
mp.xticks([])
mp.yticks([])
mp.imshow(original1)
mp.tight_layout()

mp.subplot(233)
mp.title("Convert grayscale mode(cmap='gray')",fontsize=10)
mp.xticks([])
mp.yticks([])
mp.imshow(original1,cmap='gray')
mp.tight_layout()

mp.subplot(234)
mp.title('Erase some eigenvalues\n(Retain 50 eigenvalues)',fontsize=10)
mp.xticks([])
mp.yticks([])
mp.imshow(dst1.real,cmap='gray') # It must be added real otherwise, an error is reported
mp.tight_layout()

mp.subplot(235)
mp.title('Erase some eigenvalues\n(Retain 30 eigenvalues)',fontsize=10)
mp.xticks([])
mp.yticks([])
mp.imshow(dst2.real,cmap='gray') # It must be added real otherwise, an error is reported
mp.tight_layout()

mp.subplot(236)
mp.title('Erase some eigenvalues\n(Retain 10 eigenvalues)',fontsize=10)
mp.xticks([])
mp.yticks([])
mp.imshow(dst3.real,cmap='gray') # It must be added real otherwise, an error is reported
mp.tight_layout()
mp.show()
Question 5
1. Problem Description: Matplotlib Pyplot # there are sub graphs that are not displayed
7.11 miscellaneous image course on day 7.
The code is as follows, but the sub image of the drawn image is not displayed.
import numpy as np
import matplotlib.pyplot as mp
import scipy.ndimage as sn

mp.rcParams['font.sans-serif'] = 'Microsoft Yahei'  # Display Chinese characters
mp.rcParams['axes.unicode_minus'] = False

#read file
original = mp.imread('../da_data/lily.jpg', True)

# Convert RGB format to grayscale mode
def rgb2gray(rgb):
    return np.dot(rgb[...,:3], [0.299, 0.587, 0.114])
img = rgb2gray(original)
#Gaussian blur
median = sn.median_filter(img, 21)
#The angle rotates 45 degrees counterclockwise
rotate = sn.rotate(img, 45)
#Edge recognition
prewitt = sn.prewitt(img)

mp.figure('image',facecolor='lightgray')
mp.subplot(221)
mp.imshow(img, cmap='gray')
mp.title('Original grayscale image',fontsize=10)
mp.xticks([])
mp.yticks([])
mp.tight_layout()

mp.subplot(222)
mp.imshow(median, cmap='gray')
mp.title('Gaussian blur',fontsize=10)
mp.xticks([])
mp.yticks([])
mp.tight_layout()

mp.subplot(223)
mp.imshow(rotate, cmap='gray')
mp.title('Angular rotation',fontsize=10)
mp.xticks([])
mp.yticks([])
mp.tight_layout()

mp.subplot(224)
mp.imshow(prewitt, cmap='gray')
mp.title('Edge recognition',fontsize=10)
mp.xticks([])
mp.yticks([])
mp.tight_layout()

mp.show()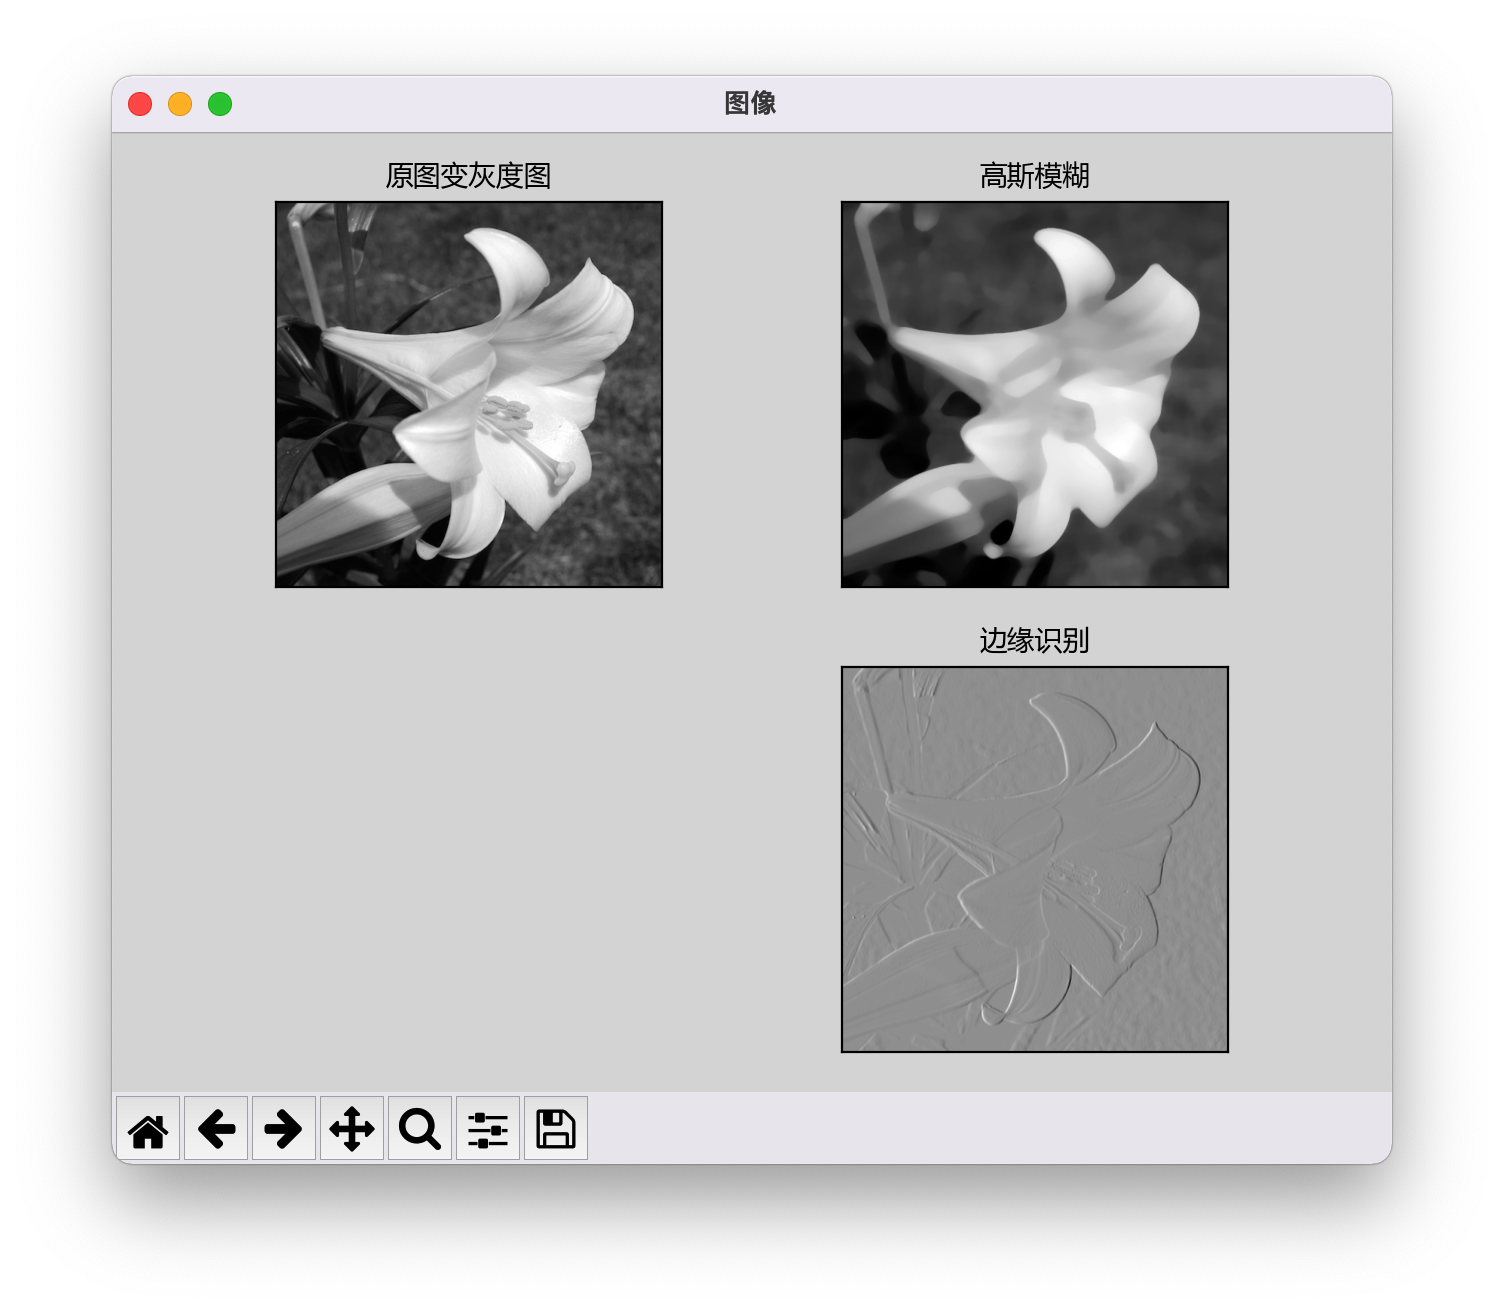
2. Causes of problems
All I know is that I used MP tight_ The reason and specific principle of layout () have not been clarified yet!
3. Solutions
The subgraph that will not be displayed MP Compact layout code MP of subplot (223) tight_ Layout () is commented out and modified as follows:
...
mp.subplot(223)
mp.imshow(rotate, cmap='gray')
mp.title('Angular rotation',fontsize=10)
mp.xticks([])
mp.yticks([])
# mp.tight_layout()    # Comment out this code, and the subgraph can be displayed normally
The drawn image is displayed normally: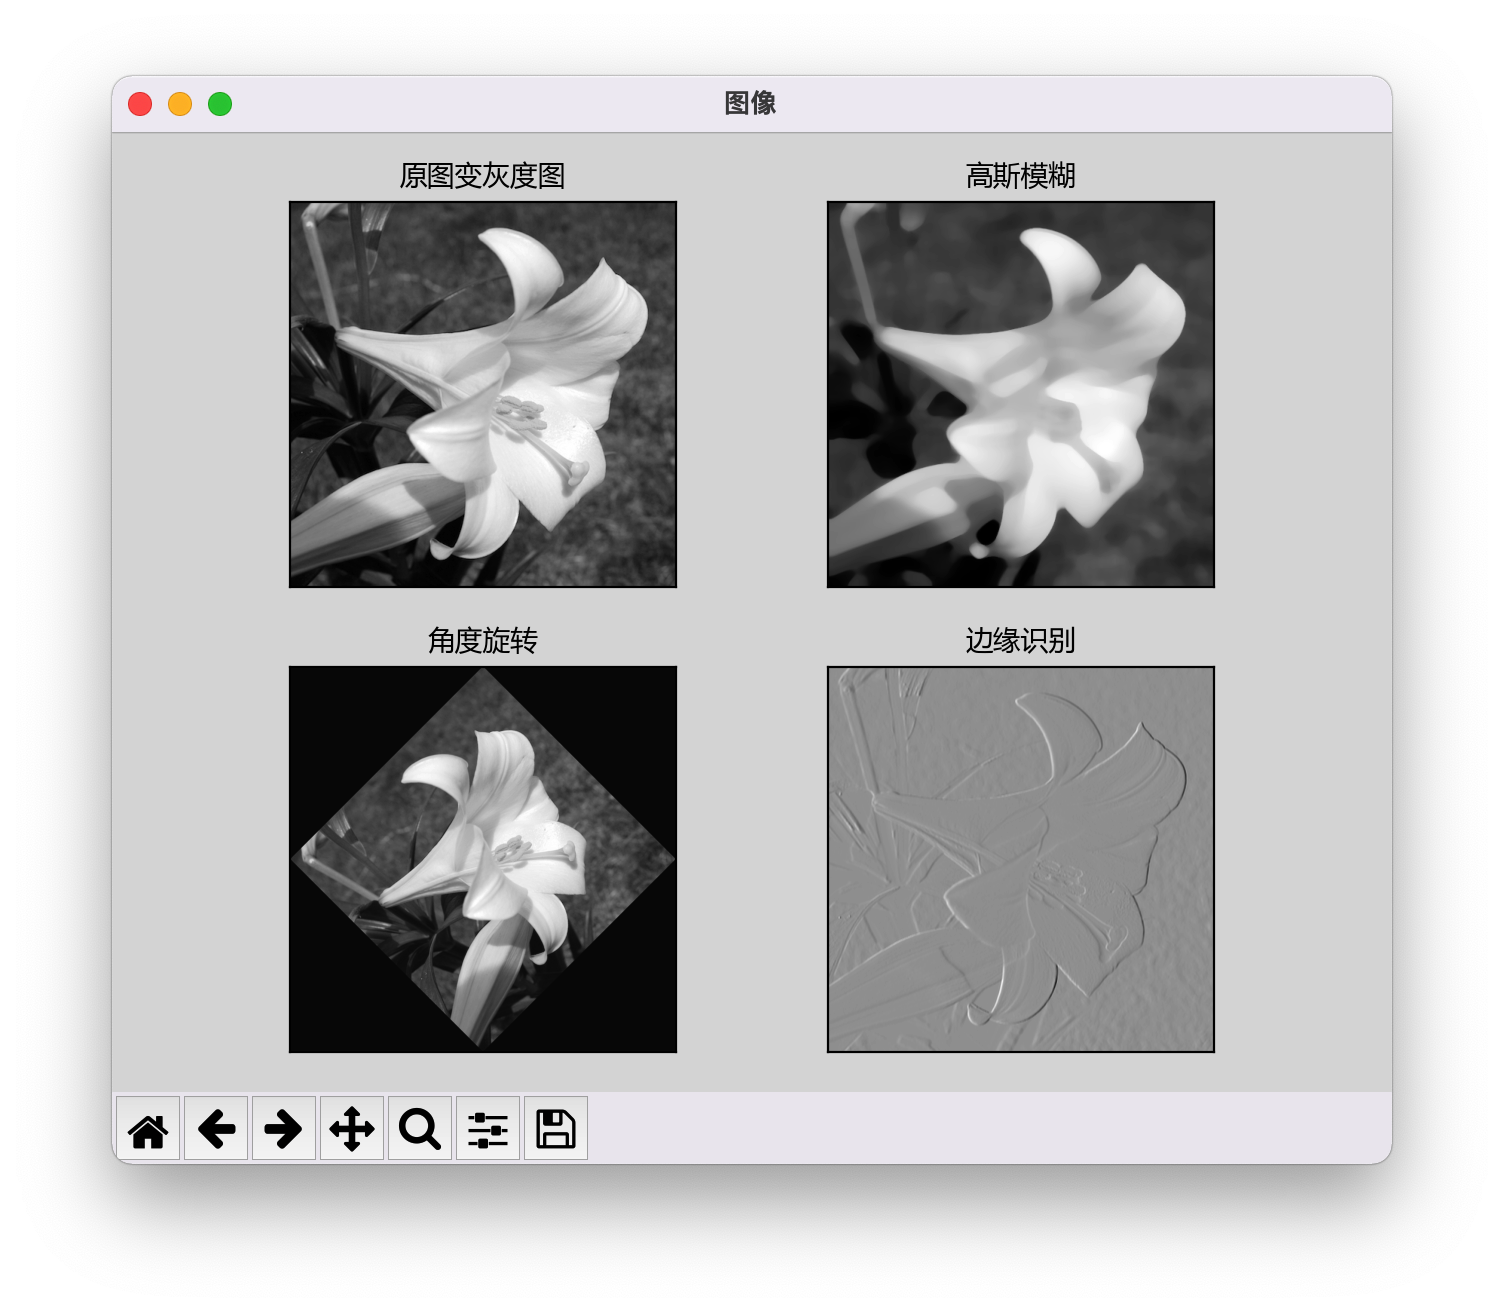
summary
The above are the problems encountered in the 8-day learning process of data analysis.
Project practice of 2.2, 2.3 and 2.4 in videos 99 ~ 101: project environment configuration and other courses, because there is no Ubuntu environment, there is no learning.