Project introduction
Building block report, a free Visual Web Report tool, online drag and drop design like building blocks! Functions include data report, print design, chart report, large screen design, etc!
Adhering to the product concept of "simple, easy-to-use and professional", it greatly reduces the difficulty of report development, shortens the development cycle, saves costs and solves all kinds of report problems. It is completely free!
Current version: v1.0 4.3 | 2022-03-07
Integration dependency
<dependency>
  <groupId>org.jeecgframework.jimureport</groupId>
  <artifactId>jimureport-spring-boot-starter</artifactId>
  <version>1.4.32</version>
</dependency>
Upgrade log
Key new functions and problem repair
- Handling of serious security vulnerabilities
- pdf export supports line feed
- Support custom expressions
- Paging is selected by default for the dataset
- New building block report processing extJson parameter configuration constant class and name modification
- Upgrade minidao version to solve the sql paging problem with limit
- The map refreshes irregularly. Refresh the chart when initializing the preview page
- The number of decimal places is not set by default for numeric formatting
- Null pointer exception handling
- Invalid decimal places for amount setting
- mongodb and redis data source configuration problems
- Columns with no subtotal set for vertical grouping support adding conditional color expressions
- http request link error exception output format optimization, default timeout changed to 5000
- Percentage problem handling / percentage support decimal places setting
- db connection error for more than 3 times. Access to database connection is prohibited
- Solve the problem of uploading cover
- list to uppercase. If it is empty, it will report a null pointer
- Stored procedure problem repair
Issues processing
- Abnormal display of exported excel percentage #I4L9Y6
- Drill through jump carry token #I4JM0I
- Allow reflective objects to modify access modifier, comment out #689
- When adding JAVABean dataset, there was an error in code verification and cannot be added #I4KT5R
- The map display data does not match the actual data #I4JHCR
- Replace the default value and expression, click the drop-down box, and the options to be selected are not displayed #685
- The chart is not displayed in the add chart pop-up window #I4GI3Q
- Exporting excel supports percentage, RMB, USD, euro and decimal settings #I4K798
- There is no data in the cell. When it is empty, click the cell without jumping #I4LLPY
- The report query list is not sorted correctly #I4LMXK
- Export pdf, print and transfer two more parameters #I4L9FY
- Setting of new minimum value for x-axis and y-axis #I4LZ63
- Dynamic column replacement) - > '' changed to)} - >} #I4MJSL
- Use tool classes to judge without apache, which is prone to version conflict #I4MPJP
- There is a problem with the use of system variables. If the token is empty, the system variable is assigned a null value, otherwise freemark will report an error issues/720
- For the finished building block report, the generated access address is previewed, and token=null is added by default issues/I4SOSH
- The customPrePath value is configured, but there is no / test in the sharing link issues/I4RQSO
- sum statistics are being used in the sub combination calculation, and the statistical results are doubled issues/I4QD7P
- The drop-down box fuzzy query display problem. When searching the same Chinese character twice in a row, it will not be displayed after the second time issues/766
- After adding the data source, the test connection prompt is successful, and click OK to report an error issues/I4PBBS
- After ApiDataConvertAdapter is converted, the field with null value is cleared issues/783
- Error in data preview in SQL dataset issues/I4OXTC
- SQL Server table name keyword query failed issues/I4STNJ
- There will be one more blank line in the preview issues/I4RJK7
- The parameter rendered to the report value has not been translated issues/I4OJXM
- Stored procedures cannot be translated into dictionaries issues/I4NZP4
- Invalid addition, subtraction, multiplication and division issues/I4T4JS,issues/I4PWJL
- Icon linkage failed. tomcat higher version does not support special format. You can use post request issues/I4R92U,issues/I4OAUS
- Error in exporting EXCEL #I4H0MZ
- Failed to upload cover in template case #I4HLR2
- Pure static template export takes up a lot of memory and is optimized #I45T0E
- Tripping problem #I4IZ64
- One of the [parameter settings] of adding hyperlinks is parameters that cannot be obtained #I4HX60
- When Java beans are selected as the data source, the parsed field names are all lowercase #I4HK1I
- Group summary questions #673
- Display the total number of data in the data query toolbar #672
- Report export excel or PDF time data is missing #663
- Report drilling cell value transfer and table value transfer #658
- The new SQL data source of graphical report cannot be displayed in the report #I4FNJC
- When the chart is bound to the javaBean data source, an error is reported, and the error problem is reported to attach the solution #I4I2X8
- The background picture is uploaded successfully and will not be displayed #I4NJ9I
Code download
Technical documentation
- Experience official website: http://jimureport.com
- Quickly integrate documents: http://report.jeecg.com/2078875
- Technical documentation: http://report.jeecg.com
- QQ group: 212391162
Why choose JimuReport?
Permanent free, support various complex reports, and fool online design, very intelligent, low code era, this is your first choice!
- Scaffolding projects using SpringBoot can be quickly integrated
- Web designer, similar to excel operation style, completes report design by dragging
- Bind the data source to the template through SQL, API, etc. At the same time, it supports functions such as expression and automatic calculation of total, so as to reduce the calculation workload
- Development efficiency is very high, fool online report design, one report per minute, simple and powerful
- It supports ECharts. Currently, it supports 28 kinds of charts, online drag and drop design, and supports two data sources: SQL and API
- Support grouping, cross, total, expression and other complex reports
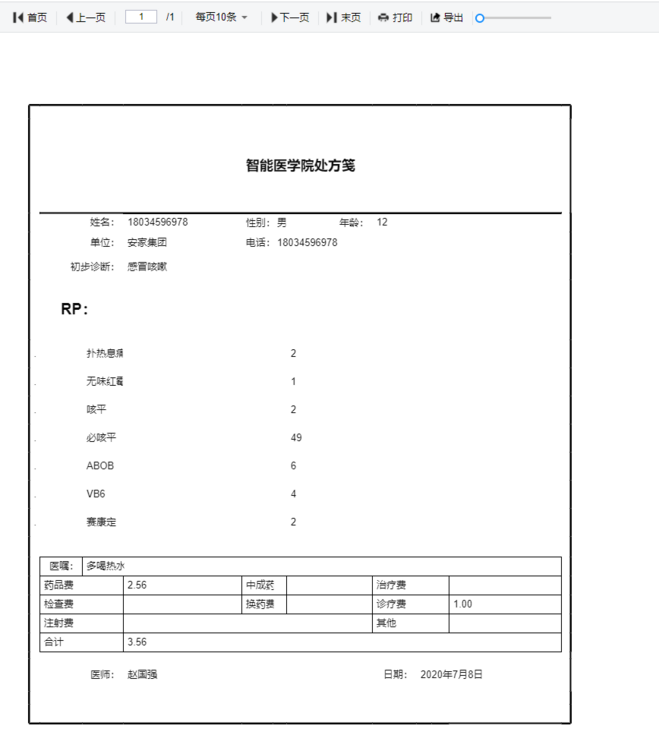
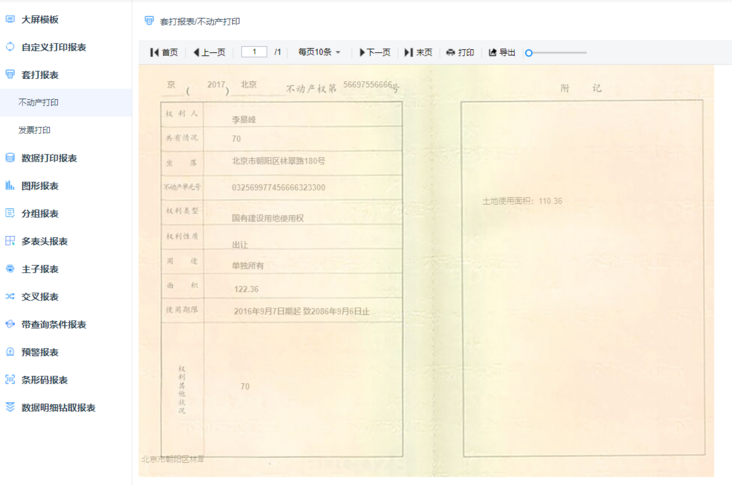
- Support printing design (support template printing, background printing, etc.) can set parameters such as printing margin, direction, header and footer, and print quickly with one key. At the same time, it can realize template printing, real estate certificate and other accurate and seamless printing
- The large screen designer supports dozens of chart styles, which can be spliced and combined freely to design Cool large screens
- Various types of documents and large screens can be designed, such as stock in and stock out documents, sales documents, financial statements, contracts, monitoring screens, tourism data screens, etc
System screenshot
- Report designer (professional first-class data visualization to solve various report problems)

- Report designer (fully online design, easy to use)
- Printing and background printing (support)
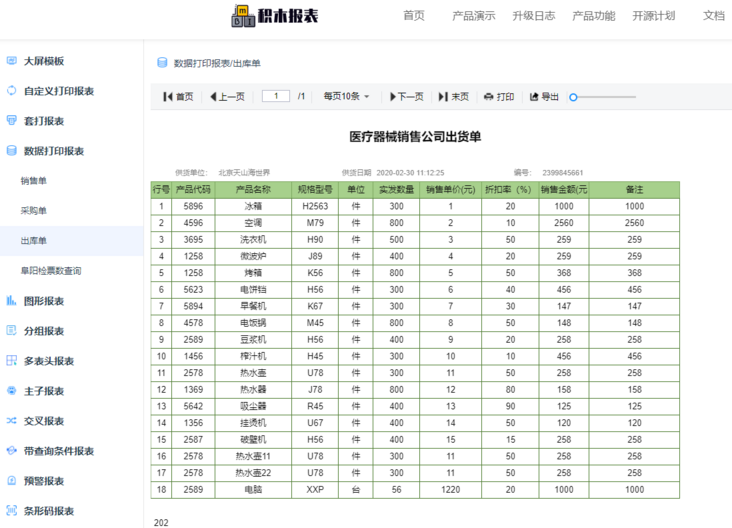
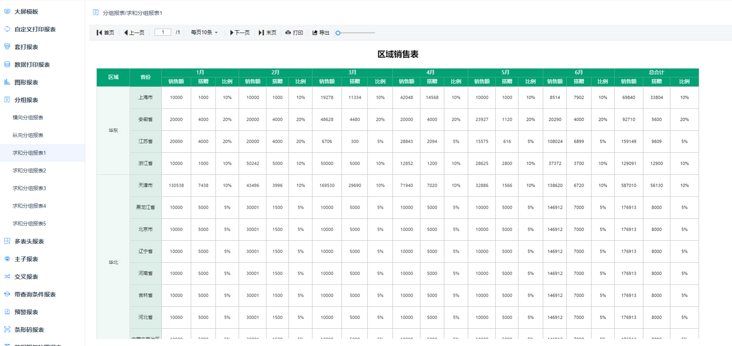
- Data report (supporting complex reports such as grouping, cross and total)
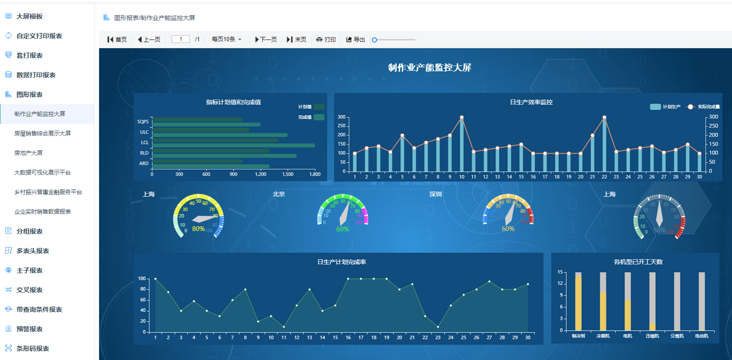
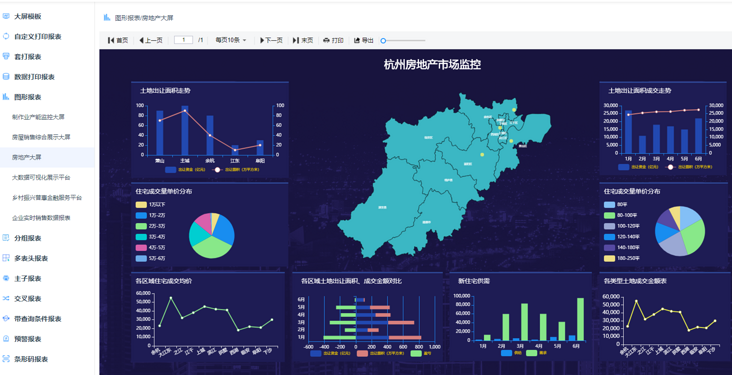
- Graphical report (currently supports 28 kinds of charts)
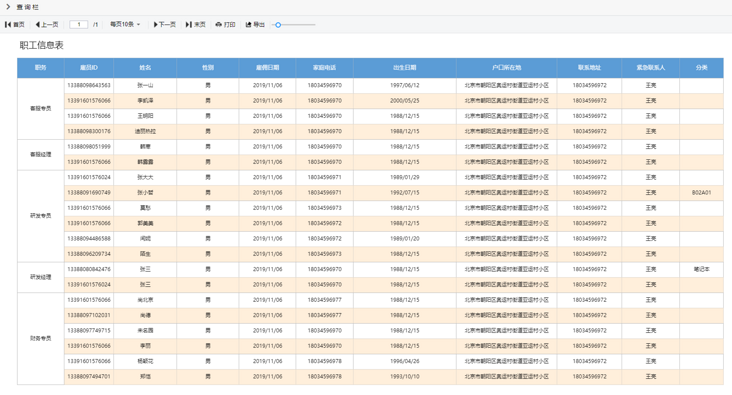
- Data report zebra crossing
Function list
├─Report Designer
│  ├─data source
│  │  ├─Support multiple data sources, such as Oracle,MySQL,SQLServer,PostgreSQL And other mainstream databases
│  │  ├─support SQL Write the page intelligently, and you can see the table list and field list under the data source
│  │  ├─Parameter support
│  │  ├─Single data source and most data source settings are supported
│  │  ├─support Nosql data source Redis,MongoDB
│  │  ├─Support stored procedures
│  ├─Format cells
│  │  ├─frame
│  │  ├─font size
│  │  ├─Font color
│  │  ├─Background color
│  │  ├─Bold font
│  │  ├─Support horizontal and vertical scattered alignment
│  │  ├─Support word wrap settings
│  │  ├─Set picture as picture background
│  │  ├─Supports wireless rows and unlimited columns
│  │  ├─Supports freezing windows in the designer
│  │  ├─Supports functions such as copying, pasting and deleting cell contents or formats
│  │  ├─wait
│  ├─Report element
│  │  ├─Text type: write text directly; Supports setting decimal places for numeric text
│  │  ├─Picture type: supports uploading a chart; Support dynamic image generation
│  │  ├─Chart type
│  │  ├─Function type
│  │  └─Support summation
│  │  └─average value
│  │  └─Maximum
│  │  └─minimum value
│  ├─background
│  │  ├─Background color settings
│  │  ├─Background picture settings
│  │  ├─Background transparency settings
│  │  ├─Background size setting
│  ├─data dictionary
│  ├─Report printing
│  │  ├─Custom printing
│  │  └─Custom style design and printing of medical notes, arrest warrants, letters of introduction, etc
│  │  ├─Simple data printing
│  │  └─Print receipt / issue document and sales table
│  │  └─Print with parameters
│  │  └─page printing
│  │  ├─Set beating
│  │  └─Printing of real estate certificate
│  │  └─Print
│  ├─Data report
│  │  ├─Group data report
│  │  └─Horizontal data grouping
│  │  └─Vertical data grouping
│  │  └─Multi level cycle header grouping
│  │  └─Subtotal, horizontal grouping
│  │  └─Subtotal, vertical grouping
│  │  └─Partition
│  │  └─Column
│  │  └─Dynamic merge lattice
│  │  └─Number of custom pages
│  │  └─total
│  │  ├─Cross Report
│  │  ├─Schedule
│  │  ├─Conditional query report
│  │  ├─Expression Report
│  │  ├─With QR code/Barcode Report
│  │  ├─Multi header Complex Report
│  │  ├─Master sub report
│  │  ├─Early warning report
│  │  ├─Data drilling Report
│  ├─Graphical report
│  │  ├─Column chart
│  │  ├─Stacked column chart
│  │  ├─Line chart
│  │  ├─Pie chart
│  │  ├─Dynamic rotation chart
│  │  ├─Column folding diagram
│  │  ├─Scatter diagram
│  │  ├─Funnel diagram
│  │  ├─Radar chart
│  │  ├─Pictogram
│  │  ├─Map
│  │  ├─Instrument panel table
│  │  ├─Relation diagram
│  │  ├─Chart background
│  │  ├─Chart dynamic refresh
│  │  ├─Chart data dictionary
│  ├─parameter
│  │  ├─Parameter configuration
│  │  ├─Parameter management
│  ├─Import and export
│  │  ├─Support import Excel
│  │  ├─Support export Excel,pdf;Support export excel,pdf With parameters
│  ├─Print settings
│  │  ├─Print locale
│  │  ├─Printer settings
│  │  ├─preview
│  │  ├─Print page number setting
├─Large screen Designer
│  ├─system function
│  │  ├─Static and dynamic data source settings
│  │  ├─Basic functions
│  │  └─Support drag and drop design
│  │  └─It supports adding, deleting, modifying and checking the large screen
│  │  └─Supports copying large screen data and styles
│  │  └─Support large screen preview and sharing
│  │  └─Support the system to save data automatically and recover data manually
│  │  └─Support setting large screen password
│  │  └─Support the deletion, combination, up, down, top and bottom of component layers
│  │  ├─Background settings
│  │  └─Width and height setting of large screen
│  │  └─Large screen introduction settings
│  │  └─Background color and background picture settings
│  │  └─Cover map settings
│  │  └─Scale settings
│  │  └─Environment address setting
│  │  └─Watermark settings
│  │  ├─Map settings
│  │  └─Add map
│  │  └─Map data isolation
│  ├─Chart
│  │  ├─Column chart
│  │  ├─Line chart
│  │  ├─Column folding diagram
│  │  ├─Pie chart
│  │  ├─Pictogram
│  │  ├─Radar chart
│  │  ├─Scatter diagram
│  │  ├─Funnel diagram
│  │  ├─Text box
│  │  ├─horse race lamp
│  │  ├─Hyperlinks
│  │  ├─Real time
│  │  ├─Map
│  │  ├─National logistics map
│  │  ├─Geographic coordinate map
│  │  ├─City dispatch map
│  │  ├─picture
│  │  ├─Picture box
│  │  ├─Rotation map
│  │  ├─Slide assembly
│  │  ├─iframe
│  │  ├─video
│  │  ├─Flop
│  │  ├─Ring diagram
│  │  ├─progress bar
│  │  ├─Instrument panel table
│  │  ├─Word floating cloud
│  │  ├─form
│  │  ├─tab
│  │  ├─Universal component
└─Other modules
   └─More functions are under development..