ELK introduction
ELK is the abbreviation of Elasticsearch+Logstash+Kibana
Elasticsearch is a distributed search and analysis engine, which can be used for full-text retrieval, structured retrieval and analysis, and can combine the three. Elasticsearch is based on Lucene and is now one of the most widely used open source search engines.
Logstash is simply a pipeline with real-time data transmission capability, which is responsible for transmitting data information from the input end of the pipeline to the output end of the pipeline. At the same time, this pipeline can also allow you to add filters in the middle according to your own needs. Logstash provides many powerful filters to meet your various application scenarios.
Kibana is an open source analysis and visualization platform designed for use with Elasticsearch. You can use kibana to search, view and interact with the data stored in the Elasticsearch index, and use various icons, tables, maps, etc. kibana can easily display advanced data analysis and visualization.
Software version
- CentOS-7-x86_64
- JAVA8
- elasticsearch-7.7.0-x86_64
- logstash-7.7.0
- kibana-7.7.0-x86_64
preparation
Turn off security policy
This must be closed. Say the important things three times. As for why I don't know, I didn't install it successfully if I didn't close it anyway.....
View Selinux status
[root@lijl ~]# sestatus
SELinux status:                 enabled
SELinuxfs mount:                /sys/fs/selinux
SELinux root directory:         /etc/selinux
Loaded policy name:             targeted
Current mode:                   enforcing
Mode from config file:          enforcing
Policy MLS status:              enabled
Policy deny_unknown status:     allowed
Max kernel policy version:      28
Close Selinux
This is very simple. Change the value corresponding to SELinux in the config file to disabled, save and restart.
[root@lijl etc]# cd /etc/selinux/
[root@lijl selinux]# vim config


# This file controls the state of SELinux on the system.
# SELINUX= can take one of these three values:
#     enforcing - SELinux security policy is enforced.
#     permissive - SELinux prints warnings instead of enforcing.
#     disabled - No SELinux policy is loaded.
SELINUX=disabled
# SELINUXTYPE= can take one of three two values:
#     targeted - Targeted processes are protected,
#     minimum - Modification of targeted policy. Only selected processes are protected.
#     mls - Multi Level Security protection.
SELINUXTYPE=targeted
Download the RPM installation package for ELK
If wget can't be downloaded, you can copy the link and download it through a downloader such as Xunlei. Anyway, I can't download it through wget
https://artifacts.elastic.co/downloads/elasticsearch/elasticsearch-7.7.0-x86_64.rpm
https://artifacts.elastic.co/downloads/kibana/kibana-7.7.0-x86_64.rpm
https://artifacts.elastic.co/downloads/logstash/logstash-7.7.0.rpm
After downloading, you can create a folder and put the three installation packages together to facilitate later search and installation
Install Elasticsearch
install
[root@lijl elk]# rpm --install elasticsearch-7.7.0-x86_64.rpm
The following instructions appear to indicate that the installation was successful
warning: elasticsearch-7.7.0-x86_64.rpm: Header V4 RSA/SHA512 Signature, key ID d88e42b4: NOKEY
Creating elasticsearch group... OK
Creating elasticsearch user... OK
### NOT starting on installation, please execute the following statements to configure elasticsearch service to start automatically using systemd
 sudo systemctl daemon-reload
 sudo systemctl enable elasticsearch.service
### You can start elasticsearch service by executing
 sudo systemctl start elasticsearch.service
future versions of Elasticsearch will require Java 11; your Java version from [/var/jdk1.8.0_281/jre] does not meet this requirement
Created elasticsearch keystore in /etc/elasticsearch/elasticsearch.keystore
start-up
Follow the prompts in the installation log
Set on start
[root@lijl elk]# systemctl daemon-reload
[root@lijl elk]# systemctl enable elasticsearch
Start Elasticsearch
[root@lijl elk]# systemctl start elasticsearch
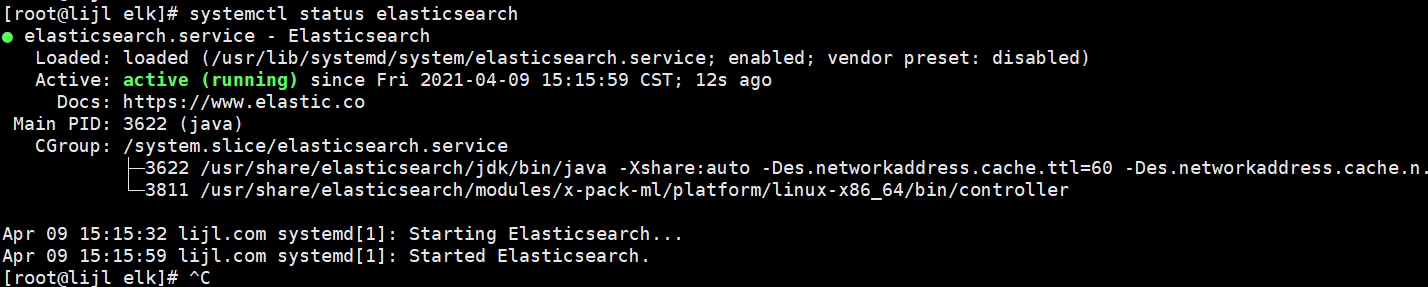
View Elasticsearch running status
[root@lijl elk]# systemctl status elasticsearch
View the configuration file of Elasticsearch
[root@lijl elk]# rpm -qc elasticsearch
/etc/elasticsearch/elasticsearch.yml
/etc/elasticsearch/jvm.options
/etc/elasticsearch/log4j2.properties
/etc/elasticsearch/role_mapping.yml
/etc/elasticsearch/roles.yml
/etc/elasticsearch/users
/etc/elasticsearch/users_roles
/etc/init.d/elasticsearch
/etc/sysconfig/elasticsearch
/usr/lib/sysctl.d/elasticsearch.conf
/usr/lib/systemd/system/elasticsearch.service
This step is optional. It is mainly for the first installation. This operation can know the files and their locations for subsequent modification
View port usage
[root@lijl elk]# netstat -nltp
Active Internet connections (only servers)
Proto Recv-Q Send-Q Local Address           Foreign Address         State       PID/Program name
tcp        0      0 0.0.0.0:111             0.0.0.0:*               LISTEN      1/systemd
tcp        0      0 192.168.122.1:53        0.0.0.0:*               LISTEN      1507/dnsmasq
tcp        0      0 0.0.0.0:22              0.0.0.0:*               LISTEN      1144/sshd
tcp        0      0 127.0.0.1:631           0.0.0.0:*               LISTEN      1141/cupsd
tcp        0      0 127.0.0.1:25            0.0.0.0:*               LISTEN      1387/master
tcp        0      0 127.0.0.1:6010          0.0.0.0:*               LISTEN      2951/sshd: root@pts
tcp        0      0 127.0.0.1:6011          0.0.0.0:*               LISTEN      3900/sshd: root@pts
tcp6       0      0 :::111                  :::*                    LISTEN      1/systemd
tcp6       0      0 127.0.0.1:9200          :::*                    LISTEN      3622/java
tcp6       0      0 ::1:9200                :::*                    LISTEN      3622/java
tcp6       0      0 127.0.0.1:9300          :::*                    LISTEN      3622/java
tcp6       0      0 ::1:9300                :::*                    LISTEN      3622/java
tcp6       0      0 :::22                   :::*                    LISTEN      1144/sshd
tcp6       0      0 ::1:631                 :::*                    LISTEN      1141/cupsd
tcp6       0      0 ::1:25                  :::*                    LISTEN      1387/master
tcp6       0      0 ::1:6010                :::*                    LISTEN      2951/sshd: root@pts
tcp6       0      0 ::1:6011                :::*                    LISTEN      3900/sshd: root@pts
Why check it? Because I don't want to turn off the firewall. This step is convenient for me to know which ports should be opened
Open 9200 and 9300 ports
[root@lijl elk]# firewall-cmd --permanent --add-port={9200/tcp,9300/tcp}
success
[root@lijl elk]# firewall-cmd --reload
success
[root@lijl elk]# firewall-cmd --list-all
public (active)
  target: default
  icmp-block-inversion: no
  interfaces: ens32
  sources:
  services: ssh dhcpv6-client
  ports: 9200/tcp 9300/tcp
  protocols:
  masquerade: no
  forward-ports:
  source-ports:
  icmp-blocks:
  rich rules:

[root@lijl elk]#
After all the above is done, you can access it through CURL
[root@lijl selinux]# curl http://127.0.0.1:9200
{
  "name" : "lijl.com",
  "cluster_name" : "elasticsearch",
  "cluster_uuid" : "2F64hc_lRPGcX9-qGqIfWw",
  "version" : {
    "number" : "7.7.0",
    "build_flavor" : "default",
    "build_type" : "rpm",
    "build_hash" : "81a1e9eda8e6183f5237786246f6dced26a10eaf",
    "build_date" : "2020-05-12T02:01:37.602180Z",
    "build_snapshot" : false,
    "lucene_version" : "8.5.1",
    "minimum_wire_compatibility_version" : "6.8.0",
    "minimum_index_compatibility_version" : "6.0.0-beta1"
  },
  "tagline" : "You Know, for Search"
}
[root@lijl selinux]#
Install Kibana
install
[root@lijl elk]# rpm --install kibana-7.7.0-x86_64.rpm
warning: kibana-7.7.0-x86_64.rpm: Header V4 RSA/SHA512 Signature, key ID d88e42b4: NOKEY
[root@lijl elk]#
Set startup and self startup
[root@lijl elk]#
[root@lijl elk]# systemctl daemon-reload
[root@lijl elk]# systemctl enable kibana
Created symlink from /etc/systemd/system/multi-user.target.wants/kibana.service to /etc/systemd/system/kibana.service.
Modify profile
[root@lijl elk]# rpm -qc kibana
/etc/kibana/kibana.yml
[root@lijl elk]# vim /etc/kibana/kibana.yml
The configuration is as follows. If you open yml and don't want to find the corresponding properties, you can empty the contents in yml, Copy the following lines in, save and exit
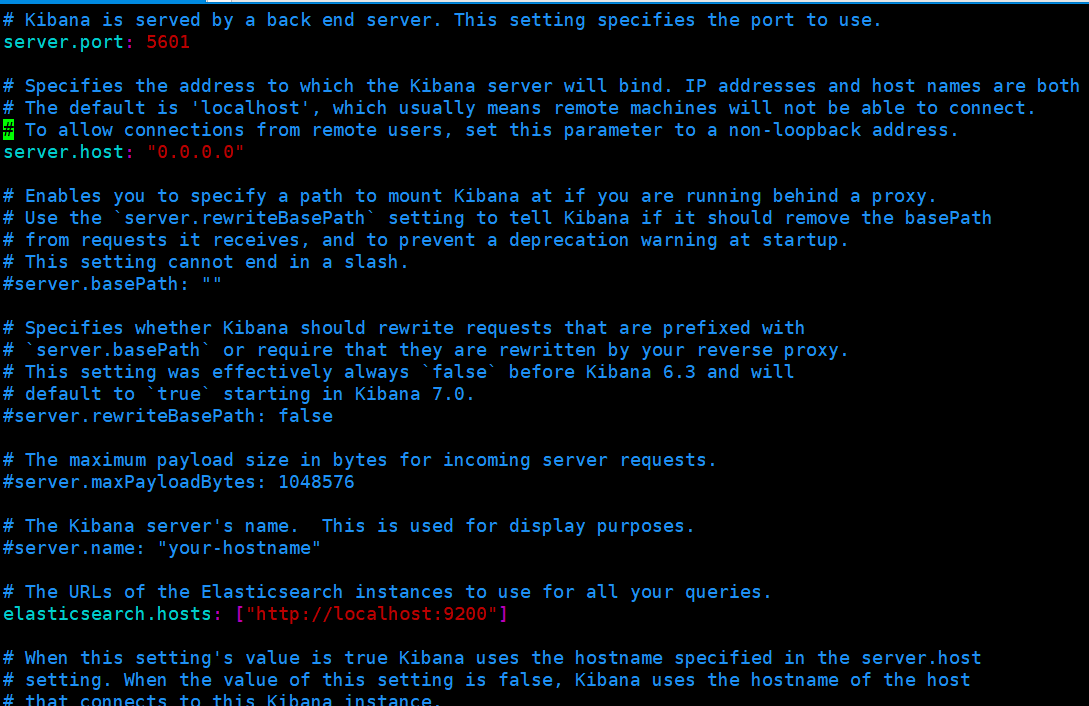
server.port: 5601
server.host: "0.0.0.0"
elasticsearch.hosts: ["http://localhost:9200"]
i18n.locale: "zh-CN"
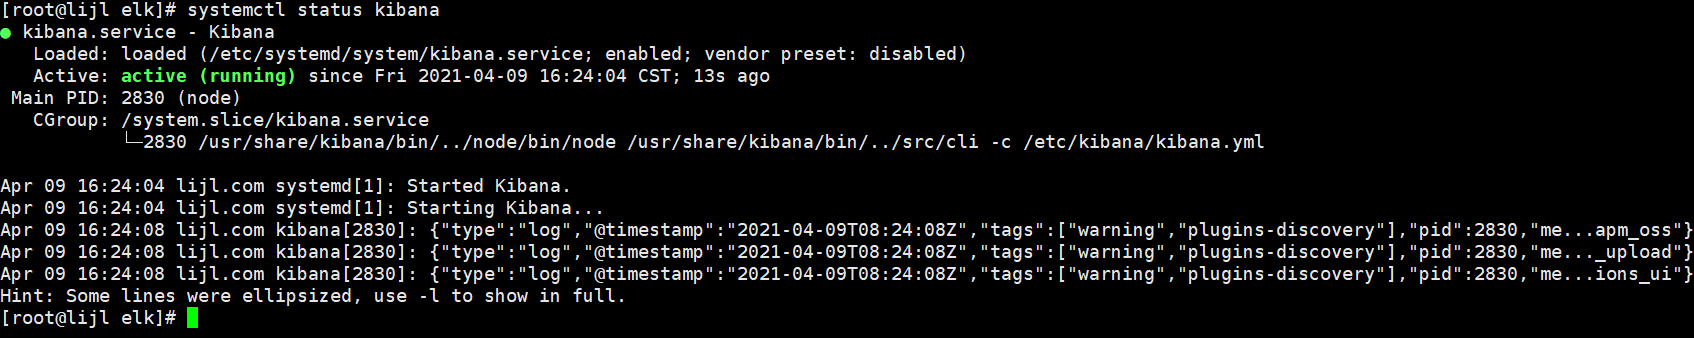
Start Kibana
[root@lijl elk]# systemctl start kibana
[root@lijl elk]#
[root@lijl elk]# systemctl status kibana
Open 5601 port
If your firewall has been turned off, opening the port can be ignored
[root@lijl elk]# firewall-cmd --zone=public --permanent --add-port=5601/tcp
success
[root@lijl elk]# firewall-cmd --reload
success
[root@lijl elk]# firewall-cmd --list-all
public (active)
  target: default
  icmp-block-inversion: no
  interfaces: ens32
  sources:
  services: ssh dhcpv6-client
  ports: 9200/tcp 9300/tcp 5601/tcp
  protocols:
  masquerade: no
  forward-ports:
  source-ports:
  icmp-blocks:
  rich rules:

[root@lijl elk]#
After the above steps are completed, you can visit Kibana through the browser
Install Logstash
install
[root@lijl elk]# rpm -ivh logstash-7.7.0.rpm
Preparing...                          ################################# [100%]
Updating / installing...
   1:logstash-1:7.7.0-1               ################################# [100%]
Using provided startup.options file: /etc/logstash/startup.options
/usr/share/logstash/vendor/bundle/jruby/2.5.0/gems/pleaserun-0.0.31/lib/pleaserun/platform/base.rb:112: warning: constant ::Fixnum is deprecated
Successfully created system startup script for Logstash
[root@lijl elk]#
Set Logstash startup self startup
[root@lijl elk]# systemctl daemon-reload
[root@lijl elk]# systemctl enable logstash
Created symlink from /etc/systemd/system/multi-user.target.wants/logstash.service to /etc/systemd/system/logstash.service.
Start Logstash
[root@lijl elk]#
[root@lijl elk]# systemctl start logstash
[root@lijl elk]#
View running status
[root@lijl logstash]# systemctl status logstash.service
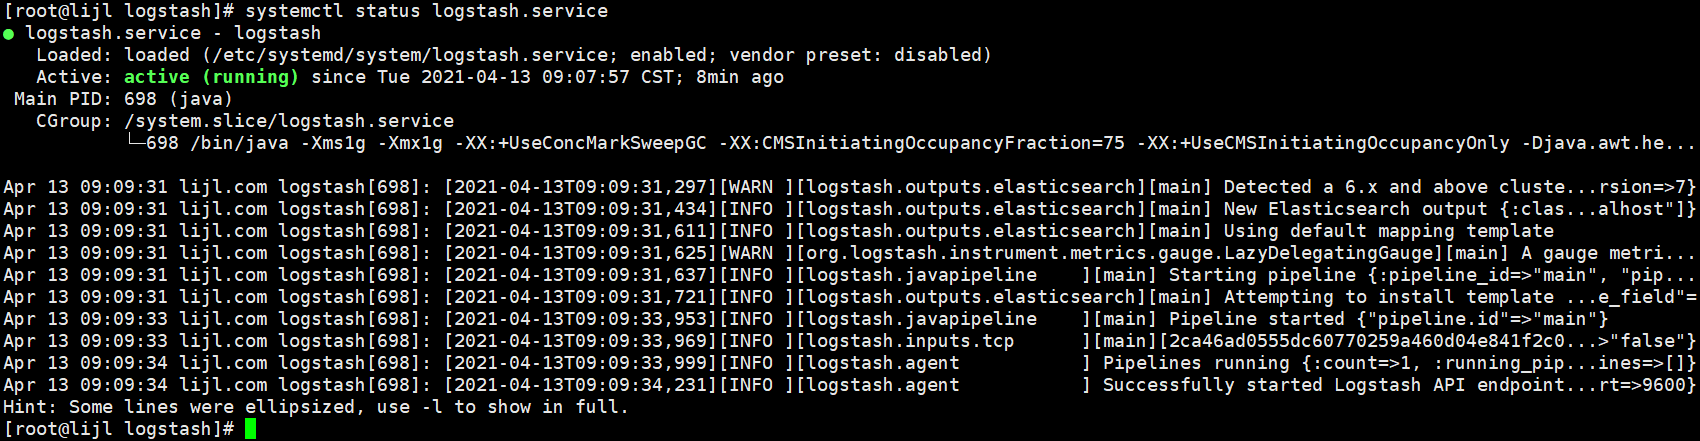
It can be seen that it has been successfully started, and ELK has been basically built here. Next, combined with a simple web program, collect the running log into ELK for analysis
Integrate SpringBoot
Create collection configuration
For ease of understanding, I will directly create a logstash springboot. In the / etc/logstash/conf.d directory Conf configuration file
[root@lijl conf.d]# vim logstash-springboot.conf

input {
  tcp {
    port => 4560
    codec => json_lines
  }
}
output {
  elasticsearch {
    hosts => localhost
    index => "springboot-logstash-%{+YYYY.MM.dd}"
  }
stdout{codec => rubydebug}
}
Briefly explain the configuration
- The port is 4560 by default and can be customized. The port re integration program needs to correspond to logback destination in appender in XML log configuration file
- Codec data format json_lines is a json parsing plug-in. Some versions of logstash need to be installed separately. At present, it has been installed in this version. I won't explain how to install it. Please install logstash codec json on Baidu_ Lines plug-in tutorial
- output configures the basic information and log file index of ES
- stdout console printing, this can be ignored. In order to cover up, add it for convenience to see the effect
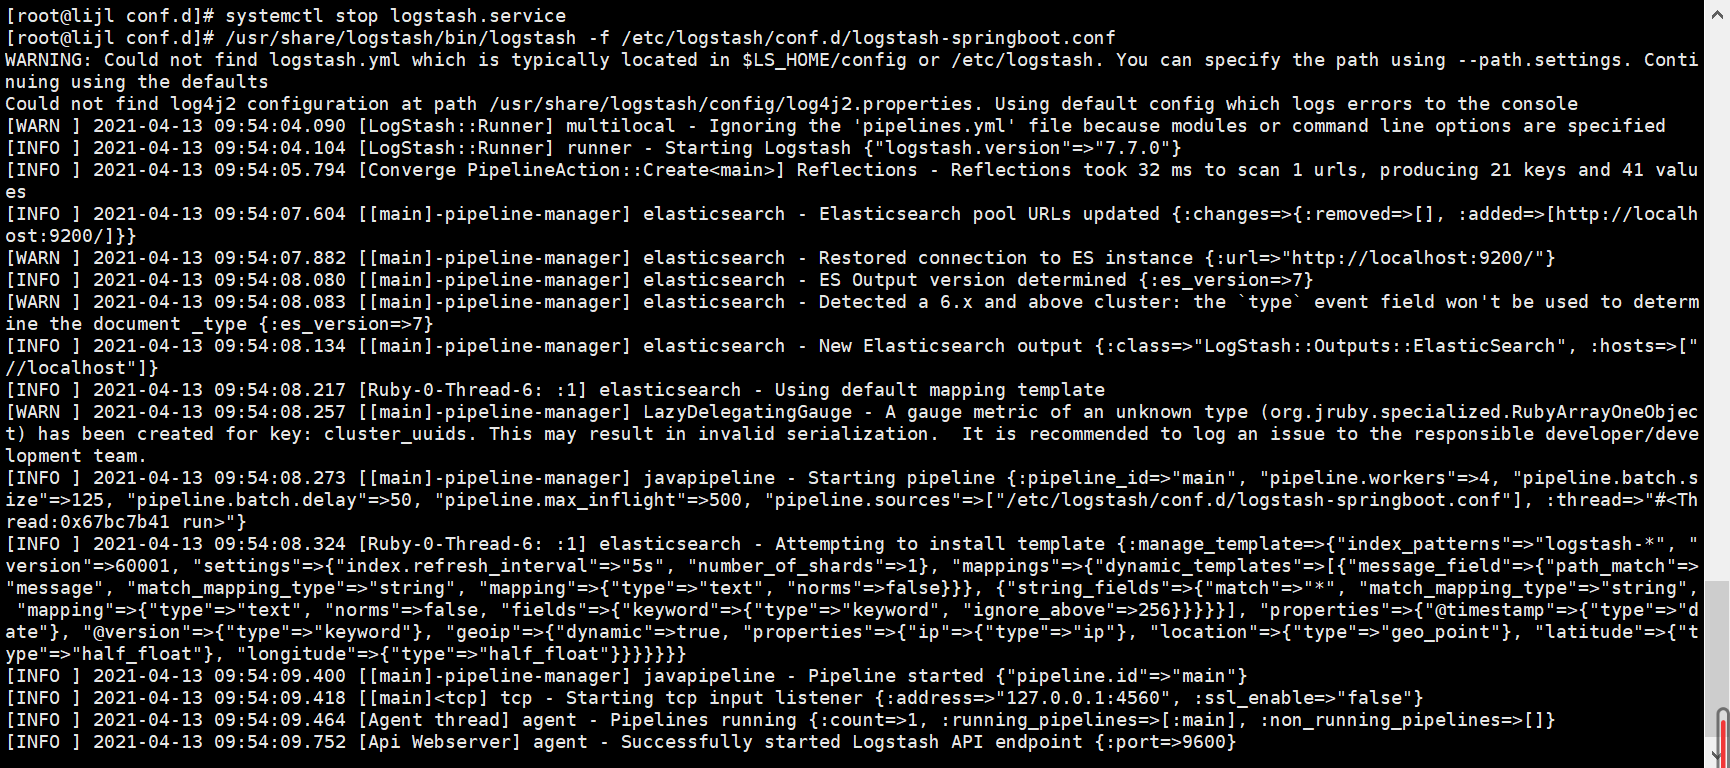
After the configuration is completed, we first close the logstash service, manually start logstash and specify to load the configuration. We must stop the logstash service first... Or else....
Create a SpringBoot project
The creation process is not cut off. It is just an ordinary spring boot project. Because it needs to push the log to the logstash service, it needs to add a logstash dependency
<!--integrate logstash-->
        <dependency>
            <groupId>net.logstash.logback</groupId>
            <artifactId>logstash-logback-encoder</artifactId>
            <version>4.11</version>
        </dependency>
Create a logback log configuration file. The configuration file is the same as that created normally. The only difference is that a LogstashTcpSocketAppender is added to connect Logstash and push logs to Logstash
<?xml version="1.0" encoding="UTF-8"?>
<!DOCTYPE configuration>
<configuration>
    <include resource="org/springframework/boot/logging/logback/defaults.xml"/>
    <include resource="org/springframework/boot/logging/logback/console-appender.xml"/>
    <!--apply name-->
    <property name="APP_NAME" value="springboot-logstash-examples"/>
    <!--Log file save path-->
    <property name="LOG_FILE_PATH" value="${LOG_FILE:-${LOG_PATH:-${LOG_TEMP:-${java.io.tmpdir:-/tmp}}}/logs}"/>
    <contextName>${APP_NAME}</contextName>
    <!--Log to file every day appender-->
    <appender name="FILE" class="ch.qos.logback.core.rolling.RollingFileAppender">
        <rollingPolicy class="ch.qos.logback.core.rolling.TimeBasedRollingPolicy">
            <fileNamePattern>${LOG_FILE_PATH}/${APP_NAME}-%d{yyyy-MM-dd}.log</fileNamePattern>
            <maxHistory>30</maxHistory>
        </rollingPolicy>
        <encoder>
            <pattern>${FILE_LOG_PATTERN}</pattern>
        </encoder>
    </appender>
    <!--Output to logstash of appender-->
    <appender name="LOGSTASH" class="net.logstash.logback.appender.LogstashTcpSocketAppender">
        <!--Accessible logstash Log collection port-->
        <destination>192.168.78.128:4560</destination>
        <encoder charset="UTF-8" class="net.logstash.logback.encoder.LogstashEncoder"/>
    </appender>
    <root level="INFO">
        <appender-ref ref="CONSOLE"/>
        <appender-ref ref="FILE"/>
        <appender-ref ref="LOGSTASH"/>
    </root>
</configuration>
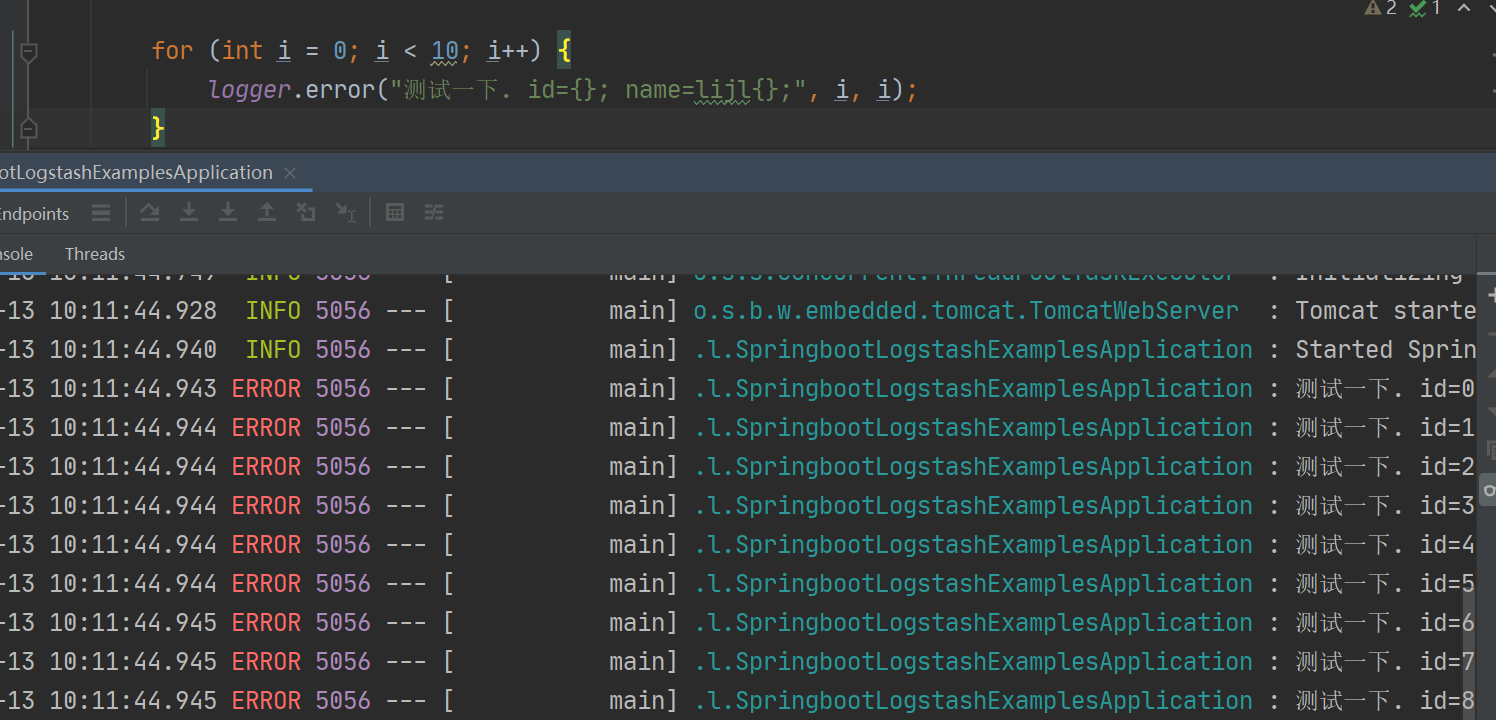
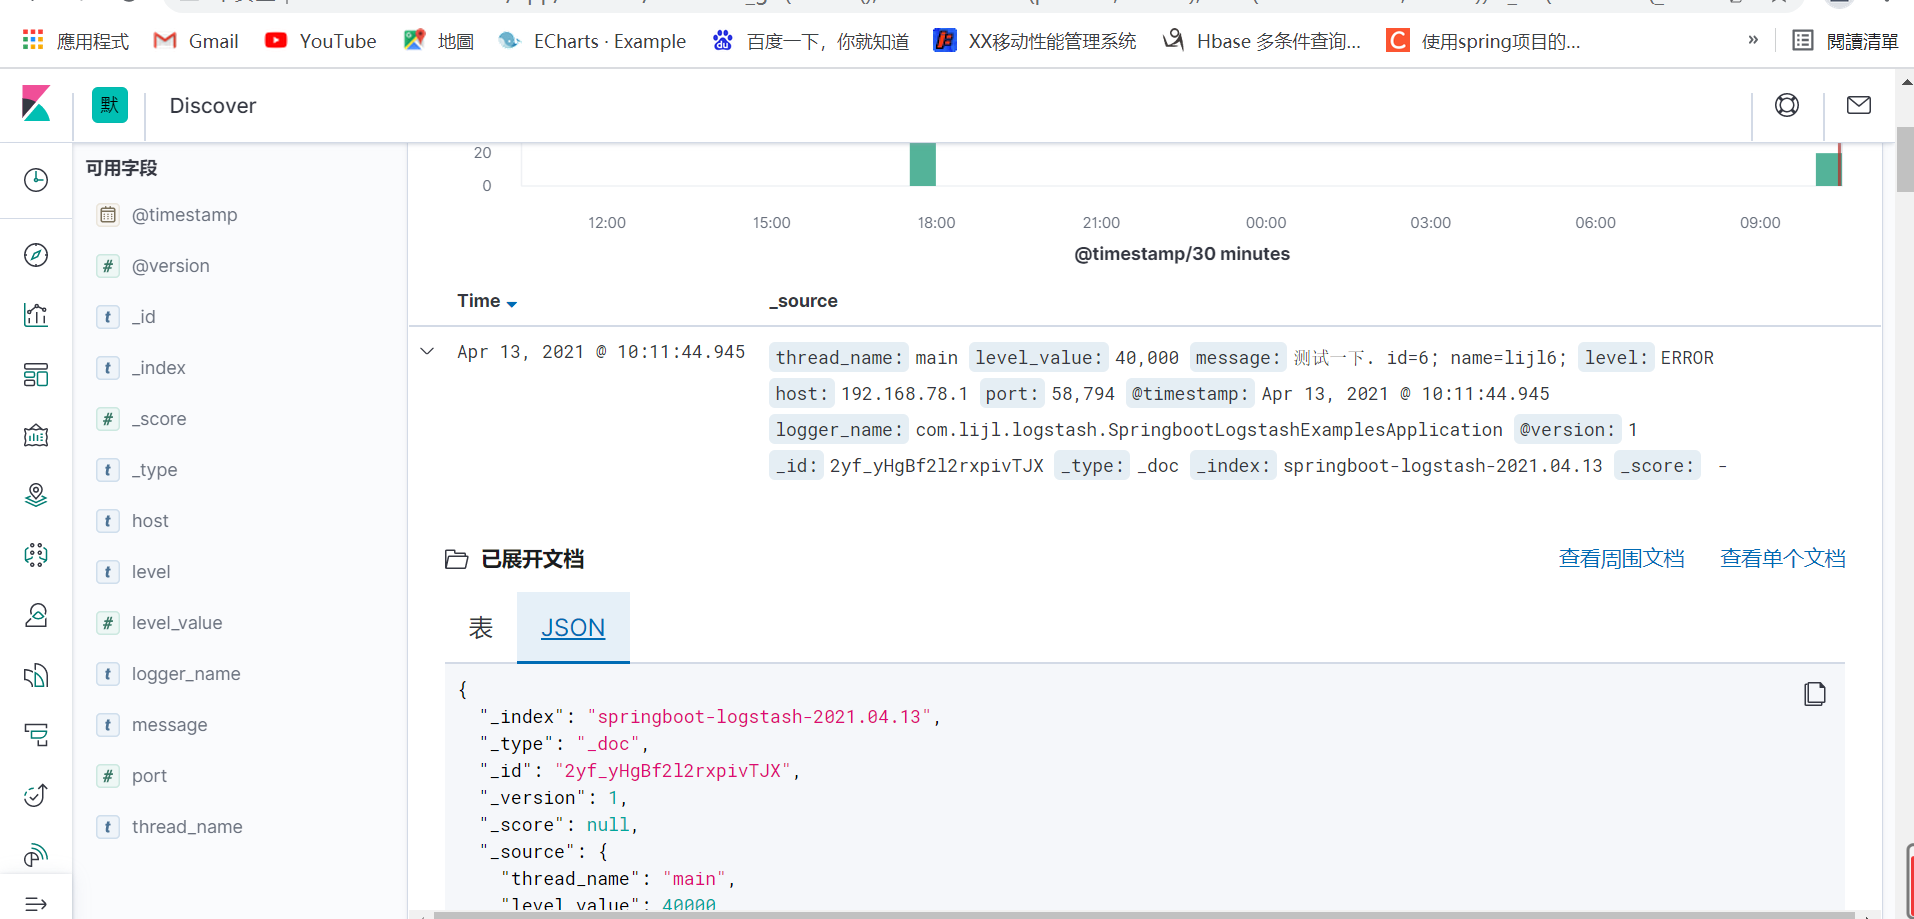
Go back to the server and see the printing of logstash console
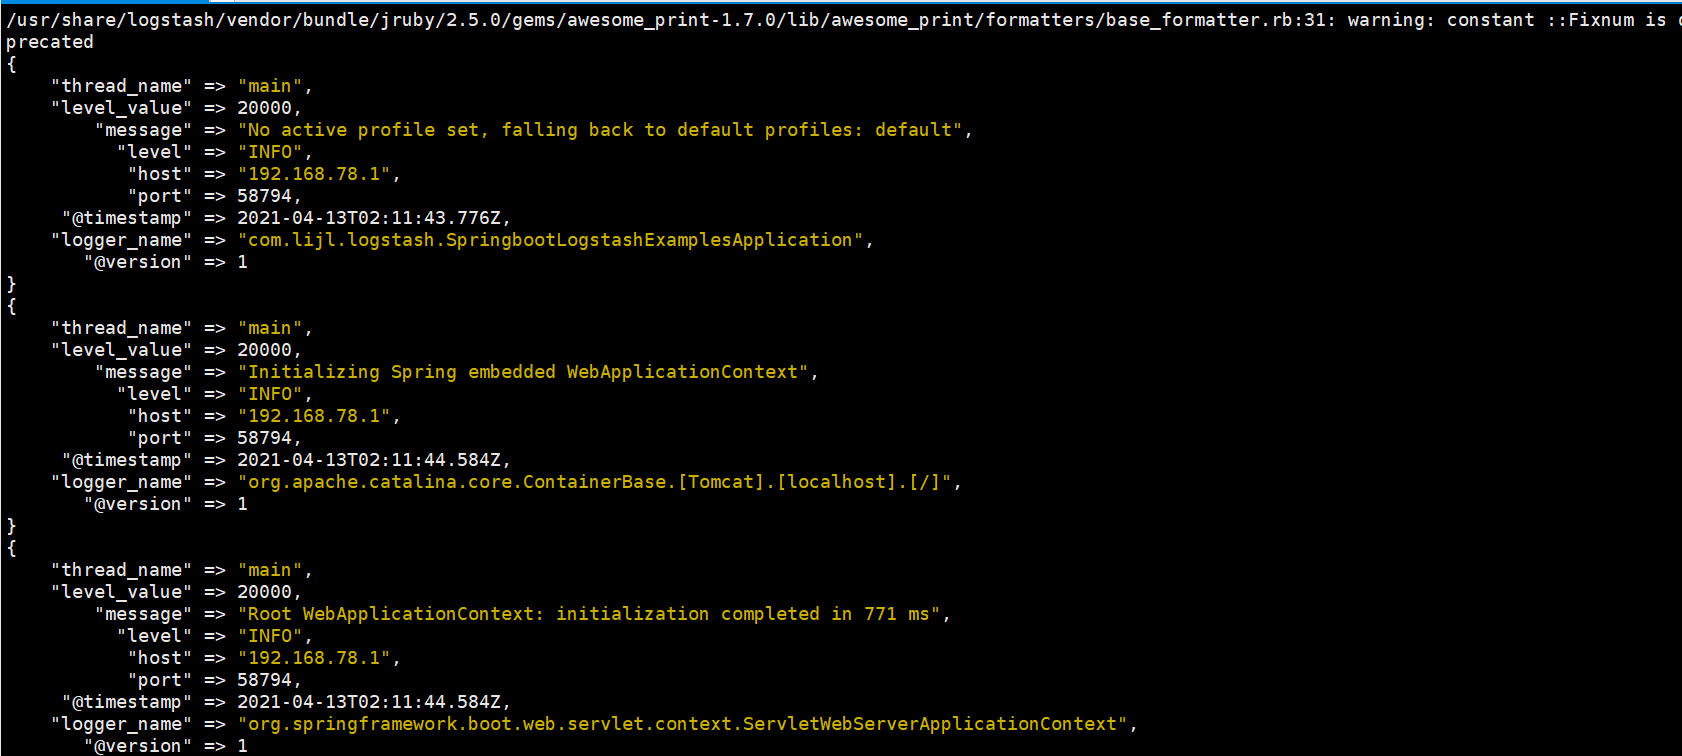
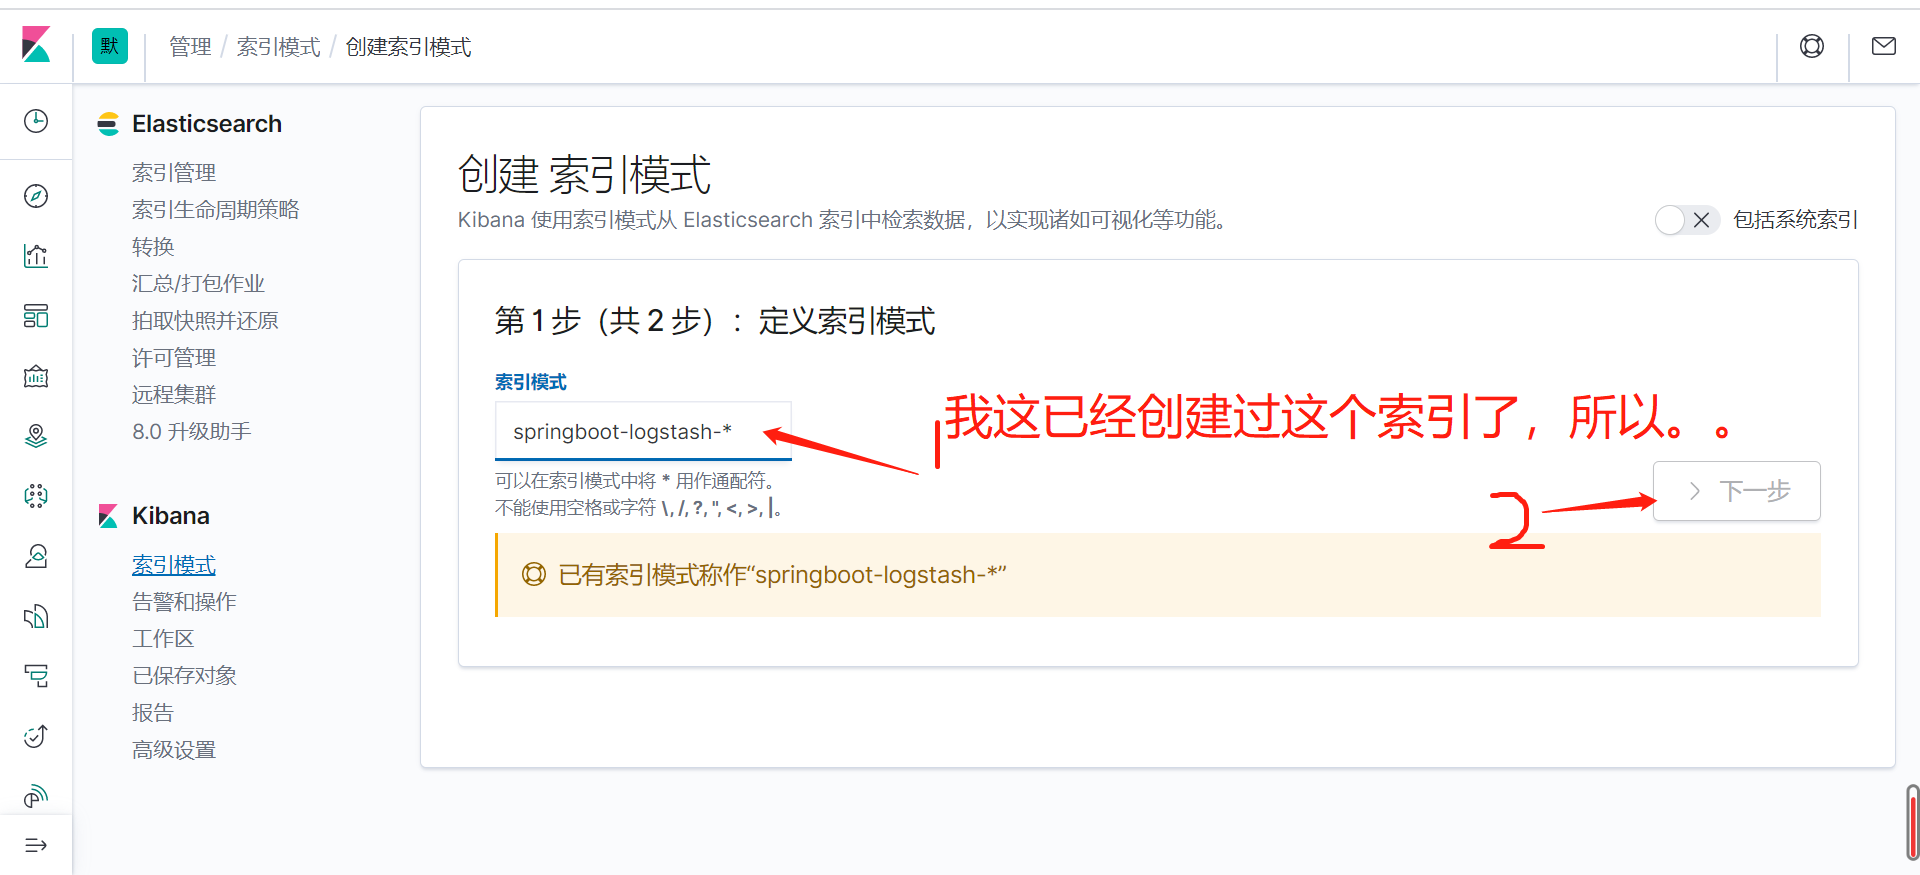
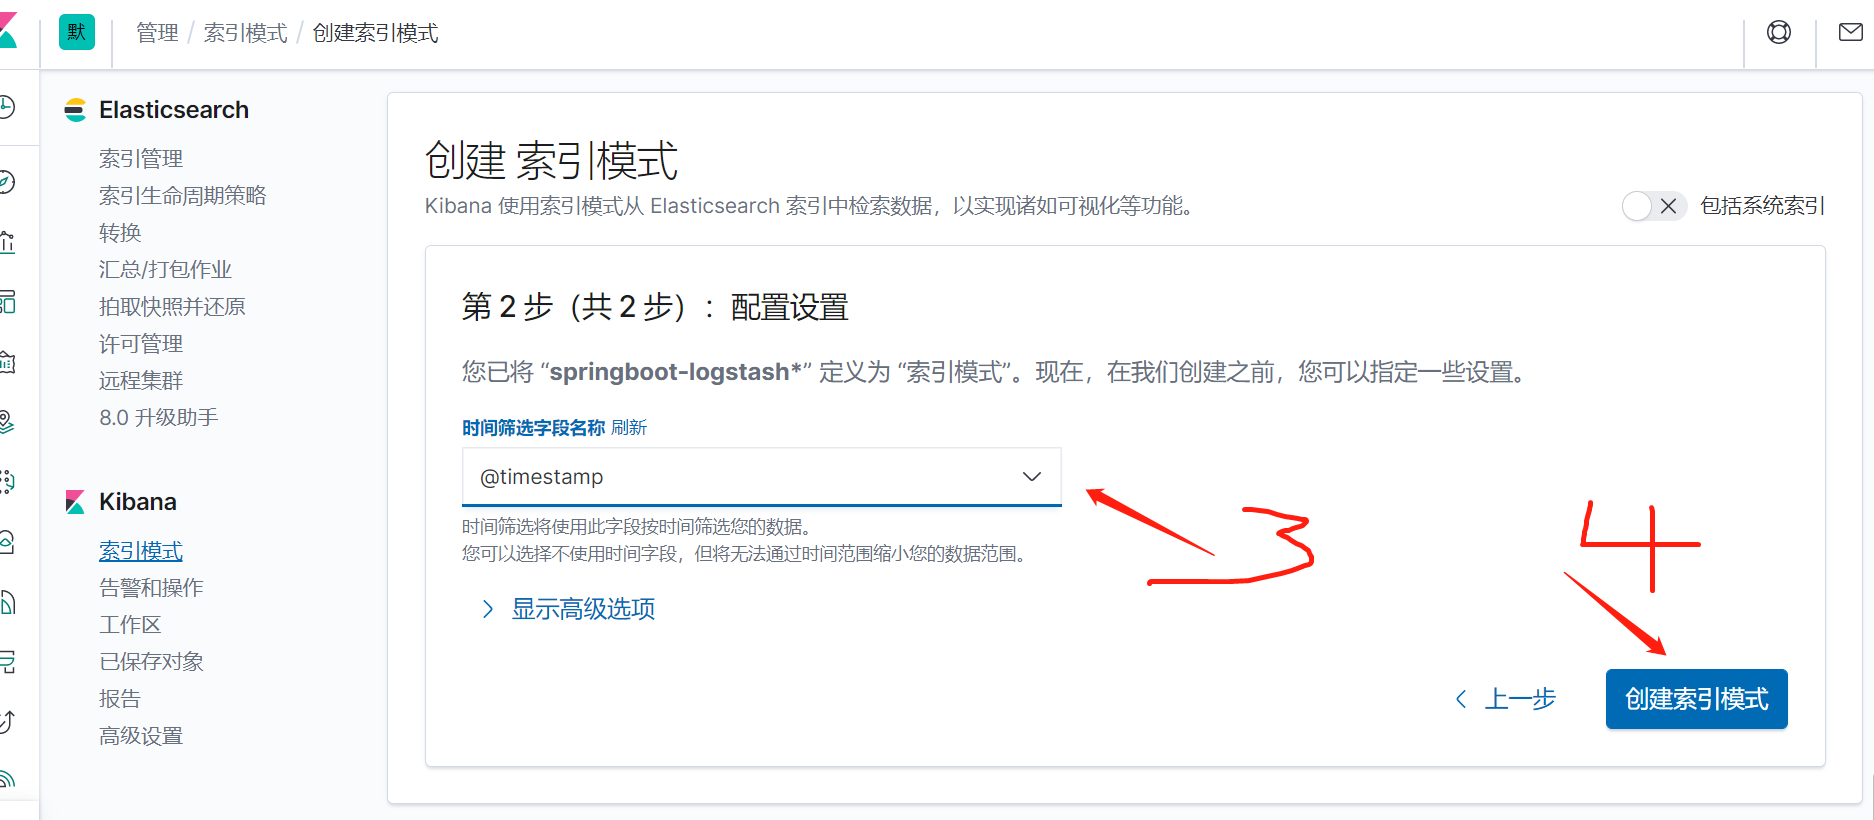
As you can see, it has been printed out and passed through json_ The lines plug-in has formatted the data into json. At this time, it can be seen in Kibana. Come back to Kibana, manage the interface and create the index