preface
In the development of large-scale projects, we often encounter such a scenario. QA throws you a link with problems, but you don't know the file location corresponding to this page & component at all.
At this time, if you can click the component on the page, automatically jump to the corresponding file in VSCode and locate the corresponding line number, wouldn't it be beautiful?
react-dev-inspector Is born in response to this demand.
It is very simple and convenient to use. After reading this dynamic diagram, you will understand:
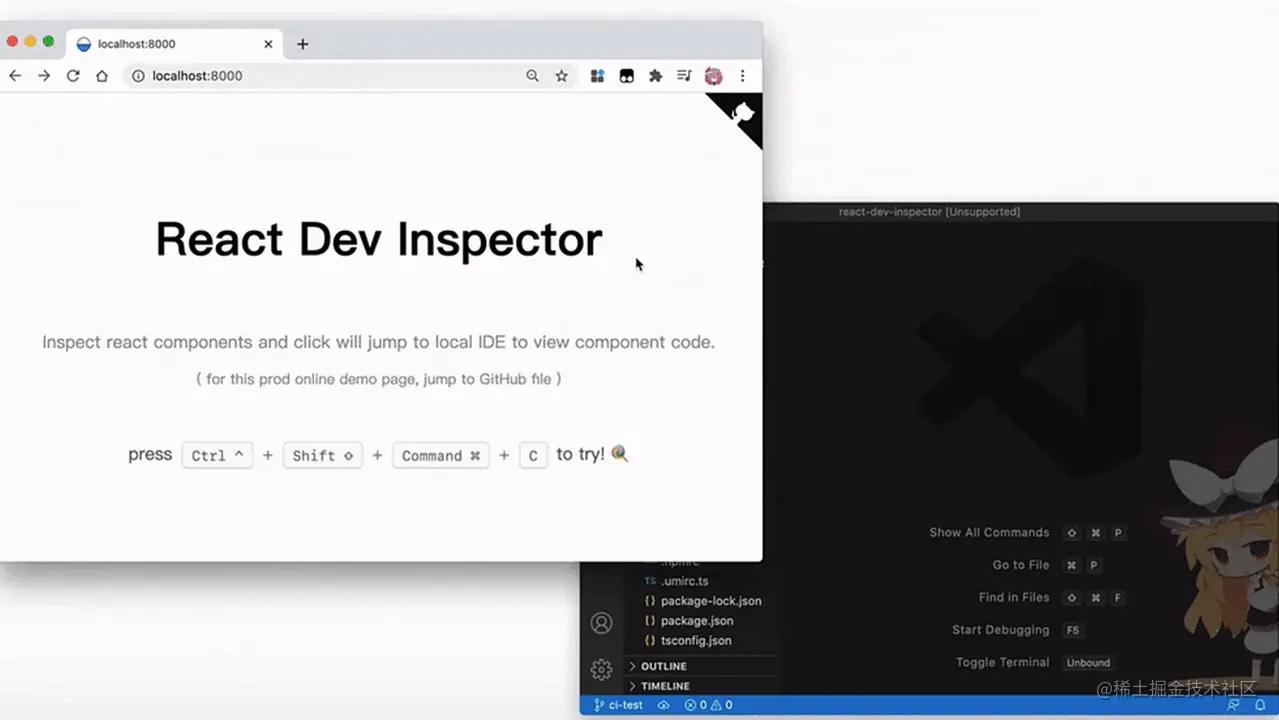
Can be in Preview site Experience it.
Mode of use
To put it simply, there are three steps:
- At build time:
- You need to add a webpack loader to traverse the AST node before compilation, and add file path, name and other related information to the DOM node.
- You need to inject the root path of the project runtime with DefinePlugin. Later, you need to splice the file path and open the corresponding file of VSCode.
- Runtime: the Inspector component needs to be wrapped in the outermost layer of the React component to listen for shortcut keys on the browser side and pop up the debug mask layer. When clicking the mask layer, use fetch to send a request to open VSCode to the local service.
- Local service: you need to start a middleware in react dev utils, listen to a specific path, and execute the instruction to open VSCode on the local server.
Let's briefly analyze what these steps have done.
Principle simplification
Build time
First, if the browser wants to know which file this component belongs to, it is inevitable to traverse the code file during construction, generate AST according to the structure of the code, and then hang the corresponding file location and line number of the current component on the DOM element of each component. Therefore, the DOM element finally generated in the development environment is as follows:
<div
  data-inspector-line="11"
  data-inspector-column="4"
  data-inspector-relative-path="src/components/Slogan/Slogan.tsx"
  class="css-1f15bld-Description e1vquvfb0"
>
  <p
    data-inspector-line="44"
    data-inspector-column="10"
    data-inspector-relative-path="src/layouts/index.tsx"
  >
    Inspect react components and click will jump to local IDE to view component
    code.
  </p>
</div>
;
When you open the DOM shortcut mode, you can add a mask to display the corresponding information when you open the DOM shortcut mode:
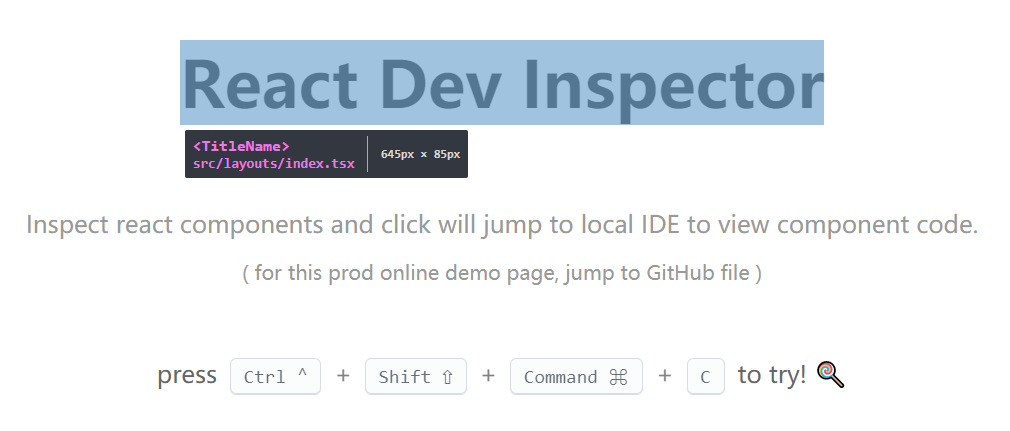
This step can be completed by getting the uncompiled JSX source code through the webpack loader and cooperating with the processing of AST.
Runtime
Since it is necessary to add hover events and mask box elements on the browser side, it is inevitable to invade the runtime code. Here, wrap an Inspector on the outermost layer of the whole application to reduce the intrusion as much as possible.
import React from 'react'
import { Inspector } from 'react-dev-inspector'

const InspectorWrapper = process.env.NODE_ENV === 'development'
  ? Inspector
  : React.Fragment

export const Layout = () => {
  // ...

  return (
    <InspectorWrapper
      keys={['control', 'shift', 'command', 'c']} // default keys
      ...  // Props see below
    >
     <Page />
    </InspectorWrapper>
  )
}
Here you can also customize your favorite shortcut keys to start the debug mode.
After the debug mode is enabled, hover the mouse over the component you want to debug, and a mask box will be displayed. Click again, and the corresponding component file will be automatically opened in VSCode, and jump to the corresponding row and column.
The key is that this jump actually sends a request to the local server through fetch, and uses the server to execute script commands, such as code Src / Inspector / index TS command to open VSCode, which requires starting local services and introducing middleware with the help of the third step I said.
Local service
Remember that the front-end project started by create react app or Vue cli will pop up a global mask and corresponding stack information in case of error. After clicking, it will jump to the file corresponding to VSCode? Yes, the react dev inspector is implemented directly with the help of the create react app toolkit react dev utils. (yes, the project created by create react app comes with this service, so you don't need to load it manually.)
React dev utils encapsulates a middleware for this function: errorOverlayMiddleware
In fact, the code is also very simple, that is, it listens to a special URL:
// launchEditorEndpoint.js
module.exports = "/__open-stack-frame-in-editor";
// errorOverlayMiddleware.js
const launchEditor = require("./launchEditor");
const launchEditorEndpoint = require("./launchEditorEndpoint");

module.exports = function createLaunchEditorMiddleware() {
  return function launchEditorMiddleware(req, res, next) {
    if (req.url.startsWith(launchEditorEndpoint)) {
      const lineNumber = parseInt(req.query.lineNumber, 10) || 1;
      const colNumber = parseInt(req.query.colNumber, 10) || 1;
      launchEditor(req.query.fileName, lineNumber, colNumber);
      res.end();
    } else {
      next();
    }
  };
};
launchEditor is the core method of opening the editor. We will analyze it in detail later. Now we can skip it first, as long as we know that we need to start this service.
This is a middleware designed for express. The before provided in the devServer option of webpack can also easily access this middleware. If your project does not use express, you just need to refer to this middleware to rewrite one. You only need to listen to the interface, get the information related to the file, and call the core method launchEditor.
As long as these steps are completed, the plug-in will be connected successfully. You can test whether the service of react dev utils is started successfully by executing fetch ('/ _openstack frame in editor? Filename = / users / admin / APP / SRC / title. TSX') on the browser console.
Injection absolute path
Note that in the previous request, the prefix after fileName = is an absolute path, while only Src / title. Is saved on the DOM node For relative paths such as TSX, the source code will get process when clicking the mask layer env. The PWD variable is spliced with the relative path on the component to obtain the complete path, so that the VSCode can be opened smoothly.
You need to write the startup path into the browser environment with the help of DefinePlugin:
new DefinePlugin({
  "process.env.PWD": JSON.stringfy(process.env.PWD),
});
So far, the integration of the whole set of plug-ins is completed, and the principle analysis of the simplified version is over.
Source code focus
After reading the above simplified principle analysis, in fact, you can almost write a similar plug-in, but the implementation details may be different. Here we won't analyze the complete source code one by one. Let's take a look at some details in the source code that deserve attention.
How to bury points on elements
The key to finding the corresponding path of the node in VSCode on the browser side lies in the embedding point during compilation. The webpack loader accepts the code string and returns the string you processed for adding new attributes to the element. However, we only need to use the whole set of AST capabilities in babel to do this:
export default function inspectorLoader(
  this: webpack.loader.LoaderContext,
  source: string
) {
  const { rootContext: rootPath, resourcePath: filePath } = this;

  const ast: Node = parse(source);

  traverse(ast, {
    enter(path: NodePath<Node>) {
      if (path.type === "JSXOpeningElement") {
        doJSXOpeningElement(path.node as JSXOpeningElement, { relativePath });
      }
    },
  });

  const { code } = generate(ast);

  return code
}
This is the simplified code. The standard parse - > traverse - > generate process handles the node type JSXOpeningElement in the traversal process, and puts the file related information on the node:
const doJSXOpeningElement: NodeHandler<
  JSXOpeningElement,
  { relativePath: string }
> = (node, option) => {
  const { stop } = doJSXPathName(node.name)
  if (stop) return { stop }

  const { relativePath } = option

  // Write line number
  const lineAttr = jsxAttribute(
    jsxIdentifier('data-inspector-line'),
    stringLiteral(node.loc.start.line.toString()),
  )

  // Write in column number
  const columnAttr = jsxAttribute(
    jsxIdentifier('data-inspector-column'),
    stringLiteral(node.loc.start.column.toString()),
  )

  // Write the relative path where the component is located
  const relativePathAttr = jsxAttribute(
    jsxIdentifier('data-inspector-relative-path'),
    stringLiteral(relativePath),
  )

  // Add these attributes to the element
  node.attributes.push(lineAttr, columnAttr, relativePathAttr)

  return { result: node }
}
Get component name
When the mouse hover s over the DOM node at runtime, all you get at this time is the DOM element. How do you get the name of the component? In fact, React will inversely hang the reference of its corresponding fiber node on the DOM, which is marked with__ reactInternalInstance is named at the beginning, which can be obtained as follows:
/**
 * https://stackoverflow.com/questions/29321742/react-getting-a-component-from-a-dom-element-for-debugging
 */
export const getElementFiber = (element: HTMLElement): Fiber | null => {
  const fiberKey = Object.keys(element).find(
    key => key.startsWith('__reactInternalInstance$'),
  )

  if (fiberKey) {
    return element[fiberKey] as Fiber
  }

  return null
}
Since the obtained fiber may correspond to an ordinary DOM element, such as div, rather than a component fiber, we certainly expect to look up the nearest component node and display its name (here we use the displayName or name attribute). Since the fiber is a linked list structure, we can recursively look up the return attribute, Until the first node that meets the expectation is found.
Recursively looking for the return of fiber here is similar to recursively looking up the parentNode attribute in the DOM node and constantly recursively looking up the parent node.
// Here, some component names are masked by regularization, and the group price names matched by regularization will not be detected
export const debugToolNameRegex = /^(.*?\.Provider|.*?\.Consumer|Anonymous|Trigger|Tooltip|_.*|[a-z].*)$/;

export const getSuitableFiber = (baseFiber?: Fiber): Fiber | null => {
  let fiber = baseFiber

  while (fiber) {
    // The while loop recursively looks up the components that match the displayName
    const name = fiber.type?.displayName ?? fiber.type?.name
    if (name && !debugToolNameRegex.test(name)) {
      return fiber
    }
    // If you can't find it, continue to find the return node
    fiber = fiber.return
  }

  return null
}
The attribute type on fiber corresponds to the function you write in the case of functional components, and corresponds to that class in the case of class components. Just take the displayName or name attribute above:
export const getFiberName = (fiber?: Fiber): string | undefined => {
  const fiberType = getSuitableFiber(fiber)?.type
  let displayName: string | undefined

  // The displayName property is not guaranteed to be a string.
  // It's only safe to use for our purposes if it's a string.
  // github.com/facebook/react-devtools/issues/803
  //
  // https://github.com/facebook/react/blob/v17.0.0/packages/react-devtools-shared/src/utils.js#L90-L112
  if (typeof fiberType?.displayName === 'string') {
    displayName = fiberType.displayName
  } else if (typeof fiberType?.name === 'string') {
    displayName = fiberType.name
  }

  return displayName
}
Principle of server side jump VSCode
Although simply speaking, react dev utils actually opens an interface to help you execute the code filepath instruction when you fetch, its bottom layer is actually very clever to realize the compatibility of a variety of editors.
How to "guess" which editor the user is using? In fact, it implements the mapping table of a set of process names corresponding to opening instructions:
const COMMON_EDITORS_OSX = {
  '/Applications/Atom.app/Contents/MacOS/Atom': 'atom',
  '/Applications/Visual Studio Code.app/Contents/MacOS/Electron': 'code',
  ...
}
Then, under macOS and Linux, the process name is listed by executing the ps x command, and the corresponding instruction to open the editor is mapped through the process name. For example, your process has / applications / visual studio code App / contents / macOS / electron, which means you use VSCode and get the code instruction.
After that, call child_. The process module executes the command:
child_process.spawn("code", pathInfo, { stdio: "inherit" });Detailed access tutorial
During construction, you only need to make some changes to the webpack configuration, add a global variable and introduce a loader.
const { DefinePlugin } = require('webpack');

{
  module: {
    rules: [
      {
        test: /\.(jsx|js)$/,
        use: [
          {
            loader: 'babel-loader',
            options: {
              presets: ['es2015', 'react'],
            },
          },
          // Note that this loader is executed before the Babel is compiled
          {
            loader: 'react-dev-inspector/plugins/webpack/inspector-loader',
            options: { exclude: [resolve(__dirname, 'Directory to exclude')] },
          },
        ],
      }
    ],
  },
  plugins: [
    new DefinePlugin({
      'process.env.PWD': JSON.stringify(process.env.PWD),
    }),
  ]
}
If your project is built by yourself rather than cra, it is possible that the service provided by errorowlaymiddleware middleware is not enabled in your project. You can start it in devServer of webpack:
import createErrorOverlayMiddleware from 'react-dev-utils/errorOverlayMiddleware'

{
  devServer: {
    before(app) {
      app.use(createErrorOverlayMiddleware())
    }
  }
}
In addition, you need to ensure that your command line can open the VSCode editor through the code command. If this is not configured, you can refer to the following steps:
1. First open VSCode.
2. Use command + shift + p (note that Ctrl + Shift + P is used in the window), then search for code and select install 'code' command in path.
Finally, access at the outermost layer of React project:
import React from 'react'
import { Inspector } from 'react-dev-inspector'

const InspectorWrapper = process.env.NODE_ENV === 'development'
  ? Inspector
  : React.Fragment

export const Layout = () => {
  // ...

  return (
    <InspectorWrapper
      keys={['control', 'shift', 'command', 'c']} // default keys
      ...  // Props see below
    >
     <Page />
    </InspectorWrapper>
  )
}
summary
In the development and maintenance of large projects, it is really important to have such a debugging artifact. No matter how good your memory is, you can't cope with the increasing number of components... After connecting this plug-in, you can refer to which component jumps which component, which greatly saves our time.
In the process of interpreting the source code of this plug-in, we can also see that if we want to do something to improve the overall efficiency of the project, we often need to comprehensively understand a lot of knowledge of runtime, construction time and Node side, and there is no end to learning.