catalogue
Simulation environment preparation
summary
Performance optimization has always been the focus of back-end service optimization, but online performance failure problems do not often occur, or due to business products, there is no way to have performance problems at all, including the performance problems encountered by the author himself. Therefore, in order to reserve knowledge in advance, we will not rush when problems occur, In this article, we will simulate several common Java performance faults to learn how to analyze and locate them.
Hello, everyone, let me introduce myself first. I'm the code on the code. You can call me brother code. I'm also the most ordinary student who graduated from an ordinary undergraduate course. I believe that most programmers or those who want to engage in the programmer industry are children of ordinary families, so I also rely on my own efforts, from graduation to entry into a traditional enterprise to job hopping, Now I work in an Internet industry giant company. I hope I can help you through my own sharing
I have prepared 16 technical columns for you to lead you to study together
"100 million traffic distributed system practice"
"BAT factory interview must ask series"
Zero foundation takes you to learn java tutorial column
Take you to the springCloud column
Take you to learn spring cloud source code column
Column on taking you to distributed systems
Take you to learn cloud native column
Take you to learn the source code of springboot
"Take you to learn netty principle and actual combat column"
Take you to Elasticsearch column
Take you to learn mysql column
Take you to learn JVM principles column
Take you to learn Redis principles column
Take you to learn advanced java column
Preparatory knowledge
Since it's a positioning problem, we definitely need tools. Let's first understand what tools we need to help locate the problem.
top command
top command is one of the most commonly used Linux commands. It can display the CPU utilization, memory utilization and other system information of the currently executing process in real time. top -Hp pid , you can view the system resource usage of threads.
vmstat command
vmstat is a virtual memory detection tool that specifies the cycle and collection times. It can count the usage of memory, CPU and swap. It also has an important common function to observe the context switching of processes. The field description is as follows:
-
r: Number of processes in the run queue (when the number is greater than the number of CPU cores, it indicates that there are blocked threads)
-
b: Number of processes waiting for IO
-
swpd: use virtual memory size
-
Free: free physical memory size
-
buff: size of memory used as buffer (buffer of memory and hard disk)
-
Cache: size of memory used as cache (buffer between CPU and memory)
-
si: the size written to memory from the swap area per second, which is transferred from disk to memory
-
so: the amount of memory written to the swap area per second, which is transferred from memory to disk
-
bi: number of blocks read per second
-
bo: number of blocks written per second
-
in: number of interrupts per second, including clock interrupts.
-
cs: number of context switches per second.
-
us: percentage of user process execution time (user time)
-
sy: percentage of kernel system process execution time (system time)
-
wa: IO waiting time percentage
-
id: idle time percentage
pidstat command
Pidstat is a component of Sysstat and a powerful performance monitoring tool. The top and vmstat commands are used to monitor the memory, CPU and I/O usage of the process, while the pidstat command can detect the thread level. The thread switching field of pidstat command is described as follows:
-
UID: the real user ID of the monitored task.
-
TGID: thread group ID.
-
TID: thread ID.
-
cswch/s: the number of active context switching. This is the number of thread switching due to resource blocking, such as lock waiting.
-
nvcswch/s: the number of passive context switching, which refers to the number of threads switched by CPU scheduling.
jstack command
Jstack is a JDK tool command. It is a thread stack analysis tool. The most commonly used function is to use the {jstack pid} command to view the stack information of threads. It is also often used to eliminate deadlocks.
jstat command
It can detect the real-time operation of Java programs, including heap memory information and garbage collection information. We often use it to check the garbage collection of programs. The common command is jstat -gc pid. The information fields are described as follows:
-
S0C: capacity of To Survivor in young generation (unit: KB);
-
S1C: capacity of From Survivor in young generation (unit: KB);
-
S0U: space used by To Survivor in the younger generation (unit: KB);
-
S1U: space used by From Survivor in the younger generation (unit: KB);
-
EC: capacity of Eden in the young generation (unit: KB);
-
EU: space used by Eden in the younger generation (unit: KB);
-
OC: capacity in old age (unit: KB);
-
OU: space used by the elderly (unit: KB);
-
MC: capacity of meta space (unit: KB);
-
MU: currently used space of meta space (unit: KB);
-
YGC: the number of gc in the younger generation from application startup to sampling;
-
Y gc t: time from application startup to sampling in the younger generation (s);
-
FGC: gc times from application startup to Full Gc when sampling;
-
FGCT: time from application startup to Full Gc GC at sampling (s);
-
GCT: total time from application startup to gc sampling (s).
jmap command
Jmap is also a JDK tool command. It can view the initialization information of heap memory and the usage of heap memory. It can also generate dump files for detailed analysis. View heap memory command jmap -heap pid.
mat memory tool
MAT(Memory Analyzer Tool) is a plug-in of eclipse (MAT can also be used alone). When analyzing dump files with large memory, it can intuitively see the memory size occupied by each object in the heap space, the number of class instances, the object reference relationship, the use of OQL object query, and the relevant information of object GC Roots.
There is also such a plug-in in idea, jpprofiler.
Related reading: Performance diagnostic tool jpprofiler quick start and best practices
Simulation environment preparation
Basic environment jdk1 8. Use the SpringBoot framework to write several interfaces to trigger the simulation scenario. First, simulate the full CPU
CPU full
It is still relatively simple to simulate the full CPU. You can directly write an dead cycle to calculate the CPU consumption.
     /**
     * Analog CPU full
     */
    @GetMapping("/cpu/loop")
    public void testCPULoop() throws InterruptedException {
        System.out.println("request cpu Dead cycle");
        Thread.currentThread().setName("loop-thread-cpu");
        int num = 0;
        while (true) {
            num++;
            if (num == Integer.MAX_VALUE) {
                System.out.println("reset");
            }
            num = 0;
        }

    }Copy to clipboardErrorCopied
Request the interface address to test curl localhost:8080/cpu/loop. It is found that the CPU soars to 100% immediately
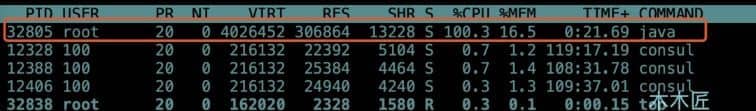
Check the Java thread by executing top -Hp 32805
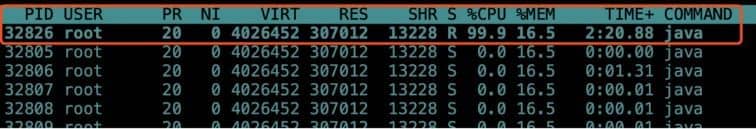
Execute # printf '%x' 32826 # to obtain the hexadecimal thread id for dump information query, and the result is # 803a. Finally, we execute jstack 32805 |grep -A 20 803a to view the detailed dump information.
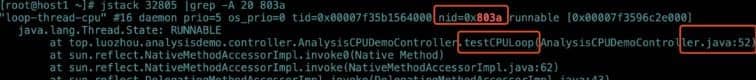
Here, the dump information directly locates the problem method and code line, which locates the problem of full CPU.
Memory leak
The simulation of memory leakage is completed with the help of ThreadLocal object. ThreadLocal is a thread private variable that can be bound to the thread and will exist throughout the life cycle of the thread. However, due to the particularity of ThreadLocal, ThreadLocal is implemented based on ThreadLocalMap, and the Entry of ThreadLocalMap inherits WeakReference, The Key of the Entry is encapsulated by the WeakReference. In other words, the Key is a weak reference. The weak reference will be recycled after the next GC. If ThreadLocal does not perform subsequent operations after set, the GC will clear the Key, but the Value will not be recycled because the thread is still alive. Finally, a memory leak will occur.
/**
     * Simulated memory leak
     */
    @GetMapping(value = "/memory/leak")
    public String leak() {
        System.out.println("Simulated memory leak");
        ThreadLocal<Byte[]> localVariable = new ThreadLocal<Byte[]>();
        localVariable.set(new Byte[4096 * 1024]);// Add variables to threads
        return "ok";
    }Copy to clipboardErrorCopied
We add a heap memory size limit to startup, and set the output stack snapshot and log when memory overflows.
java -jar -Xms500m -Xmx500m -XX:+HeapDumpOnOutOfMemoryError -XX:HeapDumpPath=/tmp/heapdump.hprof -XX:+PrintGCTimeStamps -XX:+PrintGCDetails -Xloggc:/tmp/heaplog.log analysis-demo-0.0.1-SNAPSHOT.jarCopy to clipboardErrorCopied
After the startup is successful, we execute the loop 100 times, for i in {1..500}; do curl localhost:8080/memory/leak;done, the system has returned 500 errors before the execution is completed. The following exceptions occurred when viewing the system log:
java.lang.OutOfMemoryError: Java heap spaceCopy to clipboardErrorCopied
Let's use the jstat -gc pid command to see the GC situation of the program.

Obviously, the memory overflowed, and the heap memory did not release the available memory after 45 times of Full Gc, which indicates that the objects in the current heap memory are alive, with GC Roots references, and cannot be recycled. What causes memory overflow? Do I just need to increase the memory? If it is an ordinary memory overflow, it may be OK to expand the memory, but if it is a memory leak, the expanded memory will be filled in a short time, so we still need to determine whether it is a memory leak. We saved the heap Dump file before. At this time, we use our MAT tool to analyze it. Select Leak Suspects Report as the import tool, and the tool will directly list the problem report for you.
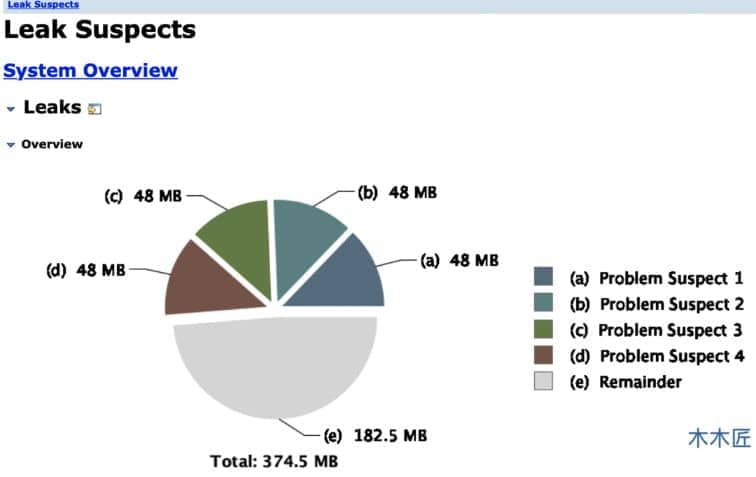
Four suspected memory leaks have been listed here. Let's click one of them to see the details.
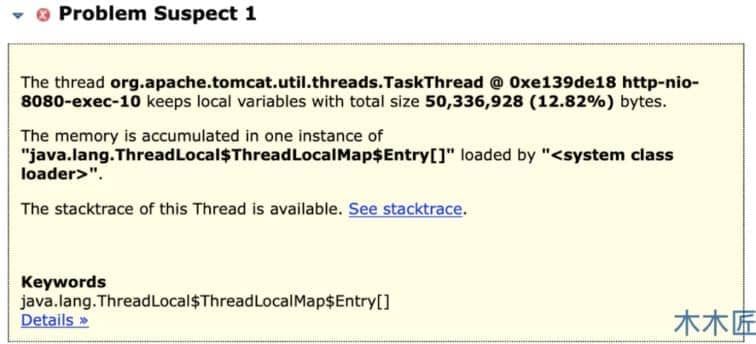
It has been pointed out here that the memory occupied by threads is nearly 50M, and the occupied object is ThreadLocal. If you want to analyze it manually in detail, you can click Histogram to see who is the largest object occupied, and then analyze its reference relationship to determine who caused the memory overflow.
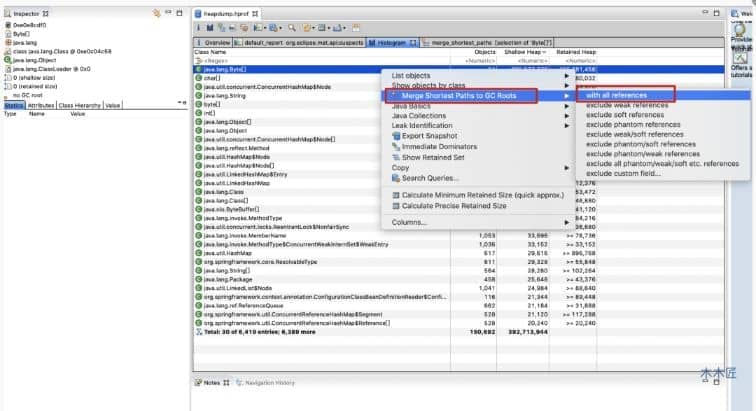
It is found in the figure above that the object occupying the most memory is a Byte array. Let's see if it is not recycled because it is referenced by the GC Root. According to the operation instructions in the red box above, the results are as follows:
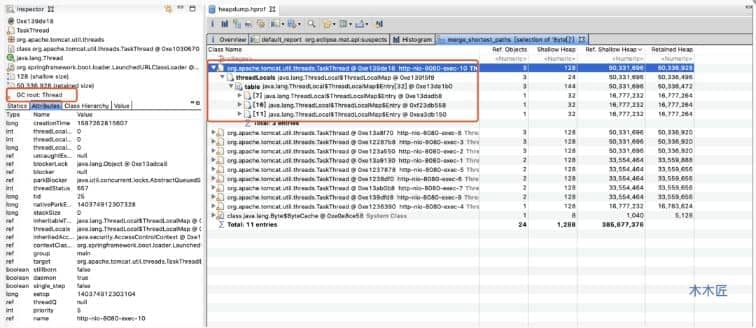
We found that the Byte array is referenced by the thread object. It is also indicated in the figure that the GC Root of the Byte array object is a thread, so it will not be recycled. Expand the details. We found that the final memory occupied object is occupied by the ThreadLocal object. This is also consistent with the results automatically analyzed by MAT tool.
deadlock
Deadlock will lead to exhaustion of thread resources and occupation of memory. The performance is that the memory occupation increases and the CPU does not necessarily soar (depending on the scenario). If it is a direct new thread, the JVM memory will be exhausted and the error of unable to create a thread will be reported. This also reflects the benefits of using thread pool.
 ExecutorService service = new ThreadPoolExecutor(4, 10,
            0, TimeUnit.SECONDS, new LinkedBlockingQueue<Runnable>(1024),
            Executors.defaultThreadFactory(),
            new ThreadPoolExecutor.AbortPolicy());
   /**
     * Analog deadlock
     */
    @GetMapping("/cpu/test")
    public String testCPU() throws InterruptedException {
        System.out.println("request cpu");
        Object lock1 = new Object();
        Object lock2 = new Object();
        service.submit(new DeadLockThread(lock1, lock2), "deadLookThread-" + new Random().nextInt());
        service.submit(new DeadLockThread(lock2, lock1), "deadLookThread-" + new Random().nextInt());
        return "ok";
    }

public class DeadLockThread implements Runnable {
    private Object lock1;
    private Object lock2;

    public DeadLockThread1(Object lock1, Object lock2) {
        this.lock1 = lock1;
        this.lock2 = lock2;
    }

    @Override
    public void run() {
        synchronized (lock2) {
            System.out.println(Thread.currentThread().getName()+"get lock2 and wait lock1");
            try {
                TimeUnit.MILLISECONDS.sleep(2000);
            } catch (InterruptedException e) {
                e.printStackTrace();
            }
            synchronized (lock1) {
                System.out.println(Thread.currentThread().getName()+"get lock1 and lock2 ");
            }
        }
    }
}Copy to clipboardErrorCopied
We repeatedly requested the interface for 2000 times and found that a log error occurred in the system after a while. The thread pool and queue were full. Because I chose the policy of rejecting when the queue was full, the system threw an exception directly.
java.util.concurrent.RejectedExecutionException: Task java.util.concurrent.FutureTask@2760298 rejected from java.util.concurrent.ThreadPoolExecutor@7ea7cd51[Running, pool size = 10, active threads = 10, queued tasks = 1024, completed tasks = 846]Copy to clipboardErrorCopied
Find out the java process pid through ps -ef|grep java command, and execute jstack pid | to display the java thread stack information. Five deadlocks are found here, and we only list one of them. It is obvious that thread pool-1-thread-2 locks 0x00000000f8387d88 and waits 0x00000000f8387d98, and thread pool-1-thread-1 locks 0x00000000f8387d98 and waits 0x00000000f8387d88, This creates a deadlock.
Java stack information for the threads listed above:
===================================================
"pool-1-thread-2":
        at top.luozhou.analysisdemo.controller.DeadLockThread2.run(DeadLockThread.java:30)
        - waiting to lock <0x00000000f8387d98> (a java.lang.Object)
        - locked <0x00000000f8387d88> (a java.lang.Object)
        at java.util.concurrent.Executors$RunnableAdapter.call(Executors.java:511)
        at java.util.concurrent.FutureTask.run(FutureTask.java:266)
        at java.util.concurrent.ThreadPoolExecutor.runWorker(ThreadPoolExecutor.java:1149)
        at java.util.concurrent.ThreadPoolExecutor$Worker.run(ThreadPoolExecutor.java:624)
        at java.lang.Thread.run(Thread.java:748)
"pool-1-thread-1":
        at top.luozhou.analysisdemo.controller.DeadLockThread1.run(DeadLockThread.java:30)
        - waiting to lock <0x00000000f8387d88> (a java.lang.Object)
        - locked <0x00000000f8387d98> (a java.lang.Object)
        at java.util.concurrent.Executors$RunnableAdapter.call(Executors.java:511)
        at java.util.concurrent.FutureTask.run(FutureTask.java:266)
        at java.util.concurrent.ThreadPoolExecutor.runWorker(ThreadPoolExecutor.java:1149)
        at java.util.concurrent.ThreadPoolExecutor$Worker.run(ThreadPoolExecutor.java:624)
        at java.lang.Thread.run(Thread.java:748)

 Found 5 deadlocks.Copy to clipboardErrorCopied
Frequent thread switching
Context switching will cause a lot of CPU time to be wasted on the saving and recovery of registers, kernel stack and virtual memory, resulting in the decline of the overall performance of the system. When you find that the performance of the system has decreased significantly, you need to consider whether a large number of thread context switches have occurred.
 @GetMapping(value = "/thread/swap")
    public String theadSwap(int num) {
        System.out.println("Simulate thread switching");
        for (int i = 0; i < num; i++) {
            new Thread(new ThreadSwap1(new AtomicInteger(0)),"thread-swap"+i).start();
        }
        return "ok";
    }
public class ThreadSwap1 implements Runnable {
    private AtomicInteger integer;

    public ThreadSwap1(AtomicInteger integer) {
        this.integer = integer;
    }

    @Override
    public void run() {
        while (true) {
            integer.addAndGet(1);
            Thread.yield(); //Free up CPU resources
        }
    }
}Copy to clipboardErrorCopied
Here, I create multiple threads to perform the basic atomic + 1 operation, and then give up the CPU resources. In theory, the CPU will schedule other threads. We ask the interface to create 100 threads to see the effect. curl localhost:8080/thread/swap?num=100. Every 10 seconds after the thread switches to print, the result is as follows:
procs -----------memory---------- ---swap-- -----io---- -system-- ------cpu-----
 r  b   swpd   free   buff  cache   si   so    bi    bo   in   cs us sy id wa st
101  0 128000 878384    908 468684    0    0     0     0 4071 8110498 14 86  0  0  0
100  0 128000 878384    908 468684    0    0     0     0 4065 8312463 15 85  0  0  0
100  0 128000 878384    908 468684    0    0     0     0 4107 8207718 14 87  0  0  0
100  0 128000 878384    908 468684    0    0     0     0 4083 8410174 14 86  0  0  0
100  0 128000 878384    908 468684    0    0     0     0 4083 8264377 14 86  0  0  0
100  0 128000 878384    908 468688    0    0     0   108 4182 8346826 14 86  0  0  0Copy to clipboardErrorCopied
Here we focus on four indicators, R, CS, US and sy.
r=100, indicating that the number of waiting processes is 100 and the thread is blocked.
CS = more than 8 million, indicating that the context has been switched more than 8 million times per second. This number is quite large.
us=14, indicating that the user mode takes up 14% of the CPU time slice to process logic.
sy=86, indicating that the kernel state occupies 86% of the CPU. Obviously, context switching is done here.
We check the process and thread CPU through the top command and top -Hp pid. We find that the Java process is full of CPU, but the thread CPU usage is very average. No thread is full of CPU.
PID USER      PR  NI    VIRT    RES    SHR S  %CPU %MEM     TIME+ COMMAND
 87093 root      20   0 4194788 299056  13252 S 399.7 16.1  65:34.67 javaCopy to clipboardErrorCopied
 PID USER      PR  NI    VIRT    RES    SHR S %CPU %MEM     TIME+ COMMAND
 87189 root      20   0 4194788 299056  13252 R  4.7 16.1   0:41.11 java
 87129 root      20   0 4194788 299056  13252 R  4.3 16.1   0:41.14 java
 87130 root      20   0 4194788 299056  13252 R  4.3 16.1   0:40.51 java
 87133 root      20   0 4194788 299056  13252 R  4.3 16.1   0:40.59 java
 87134 root      20   0 4194788 299056  13252 R  4.3 16.1   0:40.95 javaCopy to clipboardErrorCopied
Combined with the above, the user state CPU is only used by 14%, and the kernel state CPU is occupied by 86%. It can be basically judged that the performance problem is caused by the thread context switching of Java program.
We use the pidstat command to see the thread switching data inside the Java process. Execute pidstat -p 87093 -w 1 10. The collected data are as follows:
11:04:30 PM   UID       TGID       TID   cswch/s nvcswch/s  Command
11:04:30 PM     0         -     87128      0.00     16.07  |__java
11:04:30 PM     0         -     87129      0.00     15.60  |__java
11:04:30 PM     0         -     87130      0.00     15.54  |__java
11:04:30 PM     0         -     87131      0.00     15.60  |__java
11:04:30 PM     0         -     87132      0.00     15.43  |__java
11:04:30 PM     0         -     87133      0.00     16.02  |__java
11:04:30 PM     0         -     87134      0.00     15.66  |__java
11:04:30 PM     0         -     87135      0.00     15.23  |__java
11:04:30 PM     0         -     87136      0.00     15.33  |__java
11:04:30 PM     0         -     87137      0.00     16.04  |__javaCopy to clipboardErrorCopied
According to the information collected above, we know that the java thread switches about 15 times per second. Under normal circumstances, it should be a single digit or decimal. Combined with this information, we can conclude that Java threads are opened too much, resulting in frequent context switching, which affects the overall performance.
Why is the context switching of the system more than 8 million per second, while a thread in the Java process is switched only about 15 times?
System context switching can be divided into three situations:
1. Multitasking: in a multitasking environment, when one process is switched out of the CPU and another process is running, context switching will occur.
2. Interrupt handling: when an interrupt occurs, the hardware will switch the context. In the vmstat command is in
3. User and kernel mode switching: when the operating system needs to switch between user mode and kernel mode, context switching is required, such as system function call.
Linux maintains a ready queue for each CPU, sorts the active processes according to priority and waiting time for CPU, and then selects the process that needs CPU most, that is, the process with the highest priority and the longest waiting time for CPU to run. That is, r in the vmstat command.
When will the process be scheduled to run on the CPU?
- When the process terminates after execution, the CPU it used before will be released, and then a new process will be run from the ready queue
- In order to ensure that all processes can be fairly scheduled, CPU time is divided into time slices, which are allocated to each process in turn. When a process runs out of time slice, it will be suspended by the system and switched to other processes waiting for the CPU to run.
- When the system resources are insufficient, the process can run only after the resources are met. At this time, the process will also be suspended and the system will schedule other processes to run.
- When the process is actively suspended through the sleep function sleep, it will also be rescheduled.
- In order to ensure that the current process has higher priority, the process will be suspended in order to run with higher priority.
- When a hardware interrupt occurs, the process on the CPU will be suspended by the interrupt and execute the interrupt service program in the kernel instead.
Combined with our previous content analysis, the blocked ready queue is about 100, while our CPU has only 4 cores. The context switching caused by this part may be quite high. In addition, the number of interrupts is about 4000 and the function calls of the system, it is not surprising that the context switching of the whole system is 8 million. The thread switching in Java is only 15 times because the thread uses thread Yield () to give up CPU resources, but the CPU may continue to schedule the thread. At this time, there is no switching between threads, which is why the switching times of an internal thread are not very large.
summary
This paper simulates common performance problem scenarios and analyzes how to locate CPU100%, memory leakage, deadlock and frequent thread switching. To analyze problems, we need to do two things well. First, master the basic principles. Second, use good tools. This article also lists common tools and commands for analyzing problems, hoping to help you solve problems. Of course, the real online environment may be very complex, not as simple as the simulated environment, but the principle is the same, and the performance of the problem is similar. We focus on the principle, learn and use it flexibly, and believe that complex online problems can also be solved smoothly.
You must remember to praise, collect and pay attention
In case you can't find it next time
Your support is the driving force of my continuous creation!!!