Copyright notice: This article is the original article of the blogger. Please indicate the source for reprint
R language data The table package comes with data The upgraded version of frame is used for the processing of data in data frame format. The biggest feature is fast. It includes two aspects: on the one hand, it is fast to write and the code is concise. As long as one line of command can complete many tasks, on the other hand, it is fast to process. The internal processing steps are optimized in the program, using multithreading, and even many functions are written in C, which greatly speeds up the data running speed. Therefore, in the processing of big data, use data Table is undoubtedly extremely efficient. Here we mainly talk about its fast processing of data frame structure.
And data Highly compatible with frame
DT = data.table(x=rep(c("b","a","c"),each=3), y=c(1,3,6), v=1:9)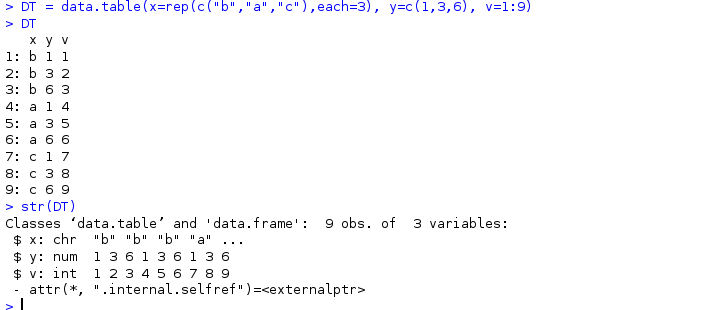
The following DT uses this data table
It can be seen that it belongs to data Table and data Frame class, and data can be used for column and dimension Frame method.
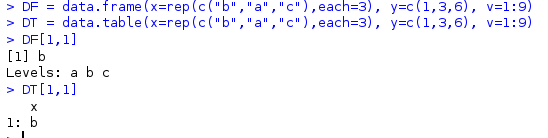
DF = data.frame(x=rep(c("b","a","c"),each=3), y=c(1,3,6), v=1:9)
DT = data.table(x=rep(c("b","a","c"),each=3), y=c(1,3,6), v=1:9)
DF
DT
identical(dim(DT), dim(DF)) # TRUE
identical(DF$a, DT$a) # TRUE
is.list(DF) # TRUE
is.list(DT) # TRUE
is.data.frame(DT) # TRUE
But data Frame converts non numbers into factors by default; And data Table converts non numbers to characters
data. The table data frame can also use the pipeline of dplyr package, which is not described here.
data.table common functions
as.data.table(x, keep.rownames=FALSE, ...) convert an R object into data Table, R, vector, list, data Frame et al., keep Rownames determines whether to keep the row name or list name. The default is false. If TRUE, the row name will be stored in the "rn" row, keep Rownames = "id", the row name is saved in the "id" row.
DF = data.frame(x=rep(c("b","a","c"),each=3), y=c(1,3,6), v=1:9) #New data frame DF
DT=as.data.table(DF,keep.rownames=TRUE)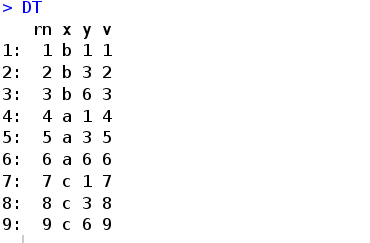
setDT(x, keep.rownames=FALSE, key=NULL, check.names=FALSE) converts an R object into data Table, than as data. There is no way to directly copy the original address of the object, because it is not transmitted in the form of table copy(x) deep copy a data Table, X is data Table object. data. In order to speed up the speed, table will be modified directly in the object address, so if necessary, copy before modification. The commands for direct modification include: = add a column, set series commands, such as setattr,setnames,setorder, etc; When using DT_ When names = names (DT), modify dt_names will modify the original data If you don't want to modify the column name of table, you should copy the original data at this time Table, or dt_names < - copy (names (DT)) directly copy the column name, so you don't have to copy the whole data table.
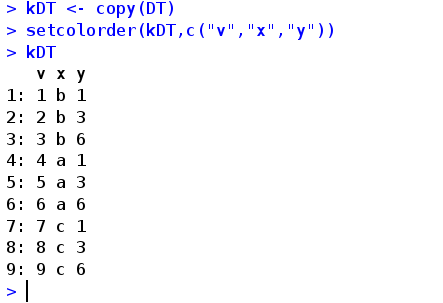
kDT=copy(DT) #kDT is a copy of DT
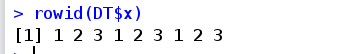
**rowid(..., prefix=NULL) * * generate unique id, prefix parameter prefixes id
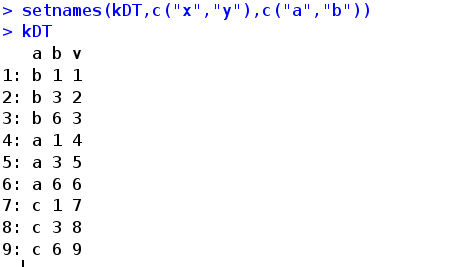
Setattr set the attribute of DT. When setattr(x,name,value) x, data Table, list or data Frame, and name is the attribute name, value is the attribute value, setnames(x,old,new), set the column name of X, old is the old column name or numeric position, and new is the new column name
setcolorder(x,neworder) rearrange the order, neworder character vector or line number
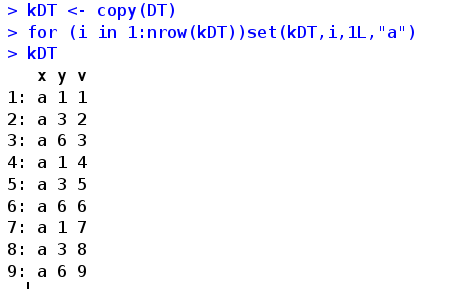
set(DT,rownum,colnum,value) directly modifies the value of a position. Rownum line number, colnum, column number, line number, column number. It is recommended to use integer to ensure the fastest speed. The method is to add L after the number. For example, 1L, value is the value to be given. Faster than: =, usually used in combination with circulation
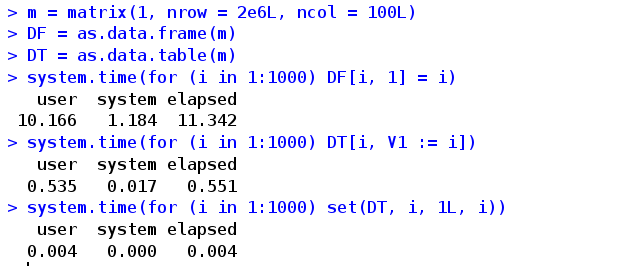
As for how fast this operation is, you can take a look (refer to the official manual command). In addition, I think the three best functions are set(), fread, and fwrite
fread
fread(input, sep="auto", sep2="auto", nrows=-1L, header="auto", na.strings="NA", file,
stringsAsFactors=FALSE, verbose=getOption("datatable.verbose"), autostart=1L,
skip=0L, select=NULL, drop=NULL, colClasses=NULL,
integer64=getOption("datatable.integer64"),
# default: "integer64"
dec=if (sep!=".") "." else ",", col.names,
check.names=FALSE, encoding="unknown", quote="\"",
strip.white=TRUE, fill=FALSE, blank.lines.skip=FALSE, key=NULL,
showProgress=getOption("datatable.showProgress"), # default: TRUE
data.table=getOption("datatable.fread.datatable") # default: TRUE
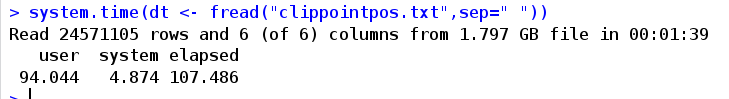
)Input input file, or string (at least one "\ n"); Separator between sep columns; sep2, the separator separated within the separator, and the function has not been applied; Nrow, the number of rows read, default - l all, nrow=0, only return the column name; Whether the first row of header is column name; na.strings, interpretation of NA; The file path is very useful to ensure that the shell command is not executed. You can also enter it in the input parameter; Whether stringsASFactors are converted to string factors, verbose, whether to interact and report the running time; autostart: any line number in this area can be read by the machine. The default is 1L. If this line is empty, read the next line; Skip the number of lines to skip reading. If it is 1, it will start reading from the second line. If this option is set, the autostart option will be ignored automatically. It can also be a character. skip="string", then it will start reading from the line containing this character; select, the column name or column number to be reserved, not others; drop, the column name or column number to be removed, and others; colClasses, class character vector, is used for rare coverage instead of regular use. It will only change a column to a higher type and cannot reduce the type; integer64, read integer numbers such as 64 bits; dec, decimal separator, default "." Otherwise, it is col.names, give the column name, try the header or detected by default, otherwise it is the V + column number; Encoding, the default is "unknown". Other possible "UTF-8" or "Latin-1" are not used for re encoding, but allow the processed string to be encoded locally; Quote, default "" "". If it starts with double quotation, fread will deal with the quotation marks inside forcefully. If it fails, it will use other attempts. If you set quote = "", the default quotation marks are not available strip.white, the default is TRUE, and the ending blank character is deleted. If FALSE, only the ending blank character of the header is removed; fill, the default is FALSE. If TRUE, areas of unequal length can be filled in automatically, which is conducive to the smooth reading of documents; blank.lines.skip, the default is FALSE. If TRUE, skip blank lines Key, set key, use one or more column names, and it will be passed to setkey showProgress,TRUE will display the script process, R-level C code data.table,TRUE returns data Table, FALSE returns data frame The example is as follows. The data of 1.8GB is read in for 94 seconds. It can be seen that the speed of reading files is very fast,
fwrite
fwrite(x, file = "", append = FALSE, quote = "auto",
sep = ",", sep2 = c("","|",""),
eol = if (.Platform$OS.type=="windows") "\r\n" else "\n",
na = "", dec = ".", row.names = FALSE, col.names = TRUE,
qmethod = c("double","escape"),
logicalAsInt = FALSE, dateTimeAs = c("ISO","squash","epoch","write.csv"),
buffMB = 8L, nThread = getDTthreads(),
showProgress = getOption("datatable.showProgress"),
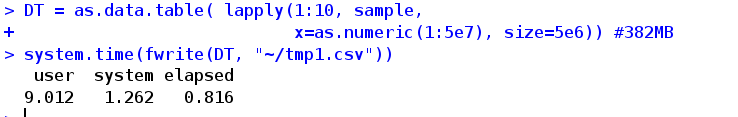
verbose = getOption("datatable.verbose"))x. Lists with the same length, such as data Frame and data Table, etc; File, output file name, "", which means output directly to the console; append, if TRUE, add after the original file; quote, if "auto", the factor and column name will be enclosed in double quotation marks only when they need it. For example, this part includes a separator, or a line ending with "\ n", or the double quotation mark itself. If FALSE, the area will not be enclosed in double quotation marks. If TRUE, it is like writing a CSV file. Except for numbers, all other parts will be enclosed in double quotation marks; sep, separator between columns; Sep2. For a column that is a list, the list members are separated by sep2 when writing out. They are within a column, and then separated by characters inside; eol, line separator, default Windows is "\ r\n", others are "\ n"; Na, the representation of Na value, default ""; dec, decimal point, default "."; row.names, whether to write out the row name, because data Table has no row name, so it defaults to FALSE; col.names, whether to write out the column name. The default is TRUE. If it is not defined, and append=TRUE and the file exists, FALSE will be used by default; qmethod, how to deal with double quotation marks, "escape", similar to C style. Use backslash to avoid double quotation, "double", by default, double quotation marks are paired; logicalAsInt, whether the logical value is written out as a number or as FALSE and TRUE; dateTimeAS, determines the writing of Date/IDate,ITime and POSIXct, "ISO" default, - 2016-09-12, 18:12:16 and 2016-09-12t18:12:16.99999z; "Square", - 20160912181216 and 20160912181216999;"epoch",-1705665536 and 1473703936;"write.csv", like write Like CSV, the write time only affects POSIXct, as Character will be digits Secs converts characters and returns the local time through R internal UTC. The first three options are written in new specific C code, which is faster buffMB, the buffer size given by each core, between 1 and 1024, 80MB by default nThread, the number of cores used. showProgress: displays the process on the workbench. When file = = "", this parameter is automatically ignored verbose, whether to interact and report time
data.table data frame structure processing syntax
data.table[ i , j , by]
i determines the displayed row, which can be integer, character or expression. j evaluates the data frame and determines the displayed column. By specifies the grouping of data. In addition to by, a series of other parameters can also be added: keyby,with,nomatch,mult,rollollends,which,.SDcols,on.
i decide which rows to display
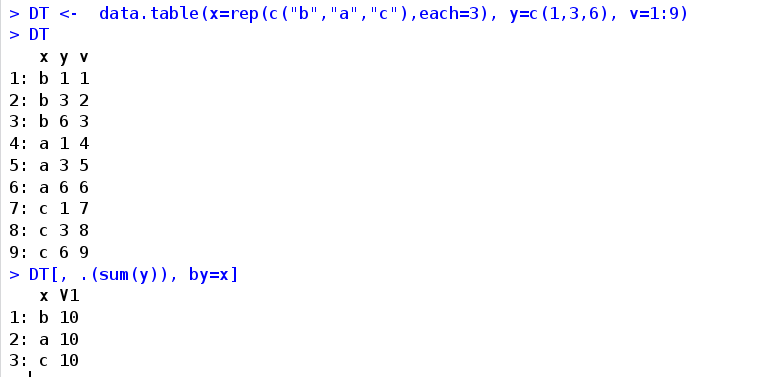
DT = data.table(x=rep(c("b","a","c"),each=3), y=c(1,3,6), v=1:9)   #New data Table object DT
DT[2]   #Take the second line
DT[2:3]   #Take the second to third lines
DT[order(x)]  #Sort DT by column x to simplify the operation. In addition, you can also sort by setkey(DT,x). The DT will be sorted by column X. Use haskey(DT) to judge whether DT has set a key. You can set multiple columns as keys
DT[y>2]   #  Lines with DT $Y > 2
DT[!2:4]   #Except for 2 to 4 lines, the remaining lines
DT["a",on="x"]   #On parameter, DT[D,on=c("x","y")] takes the row on the "X" and "y" columns of DT associated with the "X" and "y" columns of D and merges with D. for example, in this example, take the row with "a" in the X column of DT and merge with "a". The first column of on parameter must be the first column of DT
DT[.("a"), on="x"]  #Same as above () has a function similar to c()
DT["a", on=.(x)]   #Same as above
DT[x=="a"]   # Like the above, the binary search method is used as the same as using on, so they are faster than using data Frame is fast. You can also use DT after setkey to enter DT["a"] or DT["a",on=.(x)]. If there are several keys, on is recommended
DT[x!="b" | y!=3]  #Rows with column x not equal to "b" or column y not equal to 3
DT[.("b", 3), on=.(x, v)]  #Take the row x="b",v=3 on the x,v column of DT
j evaluate and output the data frame
j parameter calculates the data, such as sum,max,min,tail and other basic functions, and outputs the calculation result of the basic function. It can also output the nth column with n N (total number of columns, enter directly in j. n takes the last column),: = (add columns directly on data.table without copy process, so it is fast. Pay attention to backup if necessary) SD output subset SD[n] outputs the nth column of the subset, DT [, (a =. (), B =. ())] outputs a data frame of columns a and B () is the contents of columns a and B to be input. You can also put a series of processing in braces, such as {TMP < - mean (y); (a = a-tmp, B = b-tmp)}
DT[,y] #Return y column, vector
DT[,.(y)] #Return y column and return data table
DT[, sum(y)] #Sum column y
DT[, .(sv=sum(v))] #Sum the y column and output the sv column. The content of the column is sum(v)
DT[, .(sum(y)), by=x] # After grouping the x columns, sum the y columns of each grouping
DT[, sum(y), keyby=x] #After grouping the x columns, sum the y columns of each grouping, and the results are sorted by x
DT[, sum(y), by=x][order(x)] #As above, take data The link of table matches the expression
DT[v>1, sum(y), by=v] #After grouping the v column, take the row with v > 1 in each group, and each group sums y in the defined row respectively
DT[, .N, by=x] #After grouping DT with x by, the total number of rows in each group is taken
DT[, .SD, .SDcols=x:y] #Use SDcols defines SubDadaColums (sub column data). Here, take the columns between x and as a subset, and then SD output all subsets
DT[2:5, cat(y, "\n")] #Directly use the cat function in j to output the y value of 2 to 5 columns
DT[, plot(a,b), by=x] #For each function plot, draw a graph directly in x
DT[, m:=mean(v), by=x] #Group DT by column x, and directly add a column m on DT. The content of M is mean(v), which is directly modified and not output to the screen
DT[, m:=mean(v), by=x] [] #Add [] to output the result to the screen
DT[,c("m","n"):=list(mean(v),min(v)), by=x][] # After grouping by x, add m and N columns at the same time. The contents are mean(v) and min(v) respectively, and output to the screen
DT[, `:=`(m=mean(v),n=min(v)),by=x][] #The content is the same as above, with other writing methods
DT[,.(seq = min(y):max(v)), by=x] #Output the seq column with the contents from min(a) to max(b)
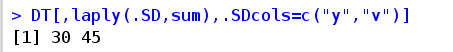
DT[, c(.(y=max(y)), lapply(.SD, min)), by=x, .SDcols=y:v] #Take the columns between y:v for DT, group by x, output max(y), and calculate the minimum value for each column between Y and v for output.by, on, with and other parameters
by grouping data
On DT[D,on=c("x","y")] take the row on the "x","y" column on DT associated with the "x","y" column on D, and merge with D
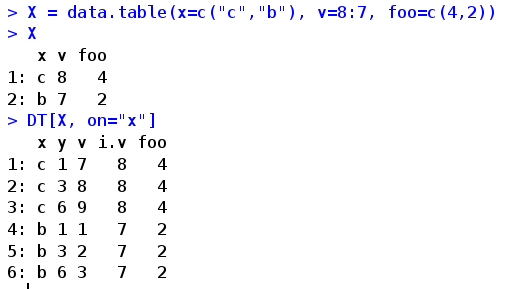
DT[X, on="x"]   #Left join
X[DT, on="x"]   #Right connection
DT[X, on="x", nomatch=0]   #For inner join, nomatch=0 means no mismatched rows are returned, and nomatch=NA means no mismatched values are returned with NA
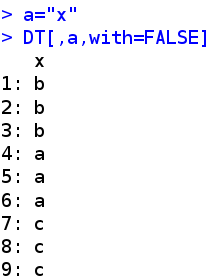
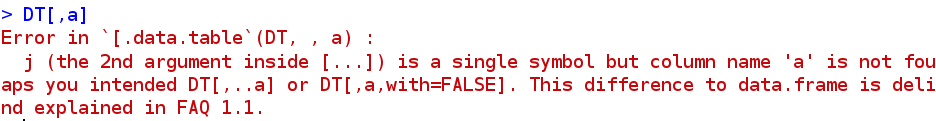
With is TRUE by default. The column name can be used as a variable, that is, X is equivalent to DT$"x". When it is FALSE, the column name is only used as a string and can be used as traditional data Frame method and return data Table, x[, cols, with=FALSE] is the same as x [,. SD,. Sdcols = cols]
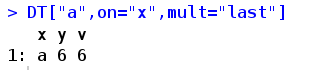
Mult when there are multiple rows matched in i, mult controls the returned rows, "all" returns all (default), "first", returns the first row, and "last" returns the last row
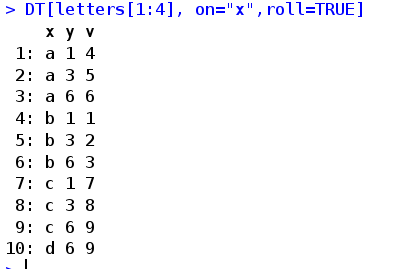
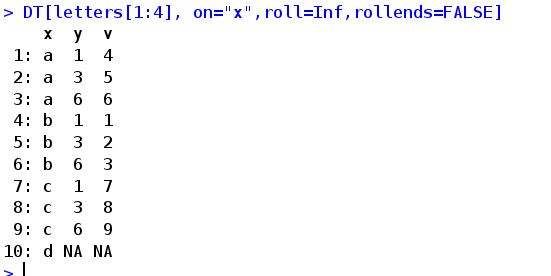
roll when all rows in i match and only one row does not match, fill in the blank of the row, + Inf (or TRUE) is filled with the value of the previous row, - Inf is filled with the value of the next row. When a number is entered, it indicates the distance that can be filled, and near is filled with the nearest row rollends fill in the rows with mismatched head and tail. If TRUE, fill in. If FALSE, do not fill in. Use with roll
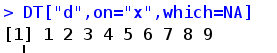
which TRUE returns the matching line number, NA returns the unmatched line number, and FALSE returns the matching line number by default
. SDcols take a specific column, and then SD includes the specific columns selected for page writing, and function processing can be applied to these subsets
allow.cartesian FALSE prevents the result from exceeding nrow(x)+nrow(i) rows, often because there are duplicate columns in i. The cartesian here is different from the traditional cartesian.
reference
data.table package manual: https://cran.r-project.org/web/packages/data.table/data.table.pdf