While the code is rolling, a message pops up in the company's chat tool:
"Brother wolf, my machine always FGC frequently..."
I quickly opened the dialog box and replied with a witty expression

Then continue silently.
Then, the little partner smashed a GC log
2019-09-17T20:33:57.889+0800: 4753520.554: [Full GC (Metadata GC Threshold) 4753520.554: [CMS[YG occupancy: 723220 K (1887488 K)]4753520.988: [weak refs process        ing, 0.0042134 secs]4753520.992: [class unloading, 0.0987343 secs]4753521.091: [scrub symbol table, 0.0237609 secs]4753521.115: [scrub string table, 0.0025983 s        ecs]: 145423K->141376K(3354624K), 0.6260023 secs] 868644K->864597K(5242112K), [Metaspace: 128179K->128179K(1234944K)], 0.6264315 secs] [Times: user=1.24 sys=0.0        0, real=0.63 secs]
4159962 Heap after GC invocations=8029 (full 50):
4159963  par new generation   total 1887488K, used 723220K [0x0000000673400000, 0x00000006f3400000, 0x00000006f3400000)
4159964   eden space 1677824K,  42% used [0x0000000673400000, 0x000000069ed59090, 0x00000006d9a80000)
4159965   from space 209664K,   4% used [0x00000006d9a80000, 0x00000006da36c210, 0x00000006e6740000)
4159966   to   space 209664K,   0% used [0x00000006e6740000, 0x00000006e6740000, 0x00000006f3400000)
4159967  concurrent mark-sweep generation total 3354624K, used 141376K [0x00000006f3400000, 0x00000007c0000000, 0x00000007c0000000)
4159968  Metaspace       used 128145K, capacity 136860K, committed 262144K, reserved 1234944K
4159969   class space    used 14443K, capacity 16168K, committed 77312K, reserved 1048576K
4159970 }
4159971 {Heap before GC invocations=8029 (full 50):
4159972  par new generation   total 1887488K, used 723220K [0x0000000673400000, 0x00000006f3400000, 0x00000006f3400000)
4159973   eden space 1677824K,  42% used [0x0000000673400000, 0x000000069ed59090, 0x00000006d9a80000)
4159974   from space 209664K,   4% used [0x00000006d9a80000, 0x00000006da36c210, 0x00000006e6740000)
4159975   to   space 209664K,   0% used [0x00000006e6740000, 0x00000006e6740000, 0x00000006f3400000)
4159976  concurrent mark-sweep generation total 3354624K, used 141376K [0x00000006f3400000, 0x00000007c0000000, 0x00000007c0000000)
I saw several key words Full GC and Metadata GC Threshold, and then replied casually
"Is metaspace not set, or is it set too small, resulting in FGC" plus a proud expression
Then, another section of JVM parameter configuration is smashed
CATALINA_OPTS="$CATALINA_OPTS -server -Djava.awt.headless=true -Xms5324m -Xmx5324m -Xss512k -XX:PermSize=350m -XX:MaxPermSize=350m -XX:MetaspaceSize=256m -XX:MaxMet aspaceSize=256m -XX:NewSize=2048m -XX:MaxNewSize=2048m -XX:SurvivorRatio=8 -XX:MaxTenuringThreshold=9 -XX:+UseConcMarkSweepGC -XX:+UseCMSInitiatingOccupancyOnly -XX :+CMSScavengeBeforeRemark -XX:+ScavengeBeforeFullGC -XX:+UseCMSCompactAtFullCollection -XX:+CMSParallelRemarkEnabled -XX:CMSFullGCsBeforeCompaction=9 -XX:CMSInitiat ingOccupancyFraction=80 -XX:+CMSClassUnloadingEnabled -XX:SoftRefLRUPolicyMSPerMB=0 -XX:-ReduceInitialCardMarks -XX:+CMSPermGenSweepingEnabled -XX:CMSInitiatingPerm OccupancyFraction=80 -XX:+ExplicitGCInvokesConcurrent -Djava.nio.channels.spi.SelectorProvider=[sun.nio.ch](http://sun.nio.ch/).EPollSelectorProvider -Djava.util.logging.manager=org.apac he.juli.ClassLoaderLogManager -XX:+PrintGCDetails -XX:+PrintGCDateStamps -XX:+PrintGCApplicationConcurrentTime -XX:+PrintGCApplicationStoppedTime -XX:+PrintHeapAtGC -Xloggc:/data/applogs/heap_trace.txt -XX:+IgnoreUnrecognizedVMOptions -XX:-HeapDumpOnOutOfMemoryError -XX:HeapDumpPath=/data/applogs/HeapDumpOnOutOfMemoryError"
"It should not be. We configured - XX:MaxMetaspaceSize=256m -XX:MetaspaceSize=256m"
After seeing the configuration, I was a little confused. It seemed that it was beyond my cognitive range. I didn't reply at once and threw a pile of data.
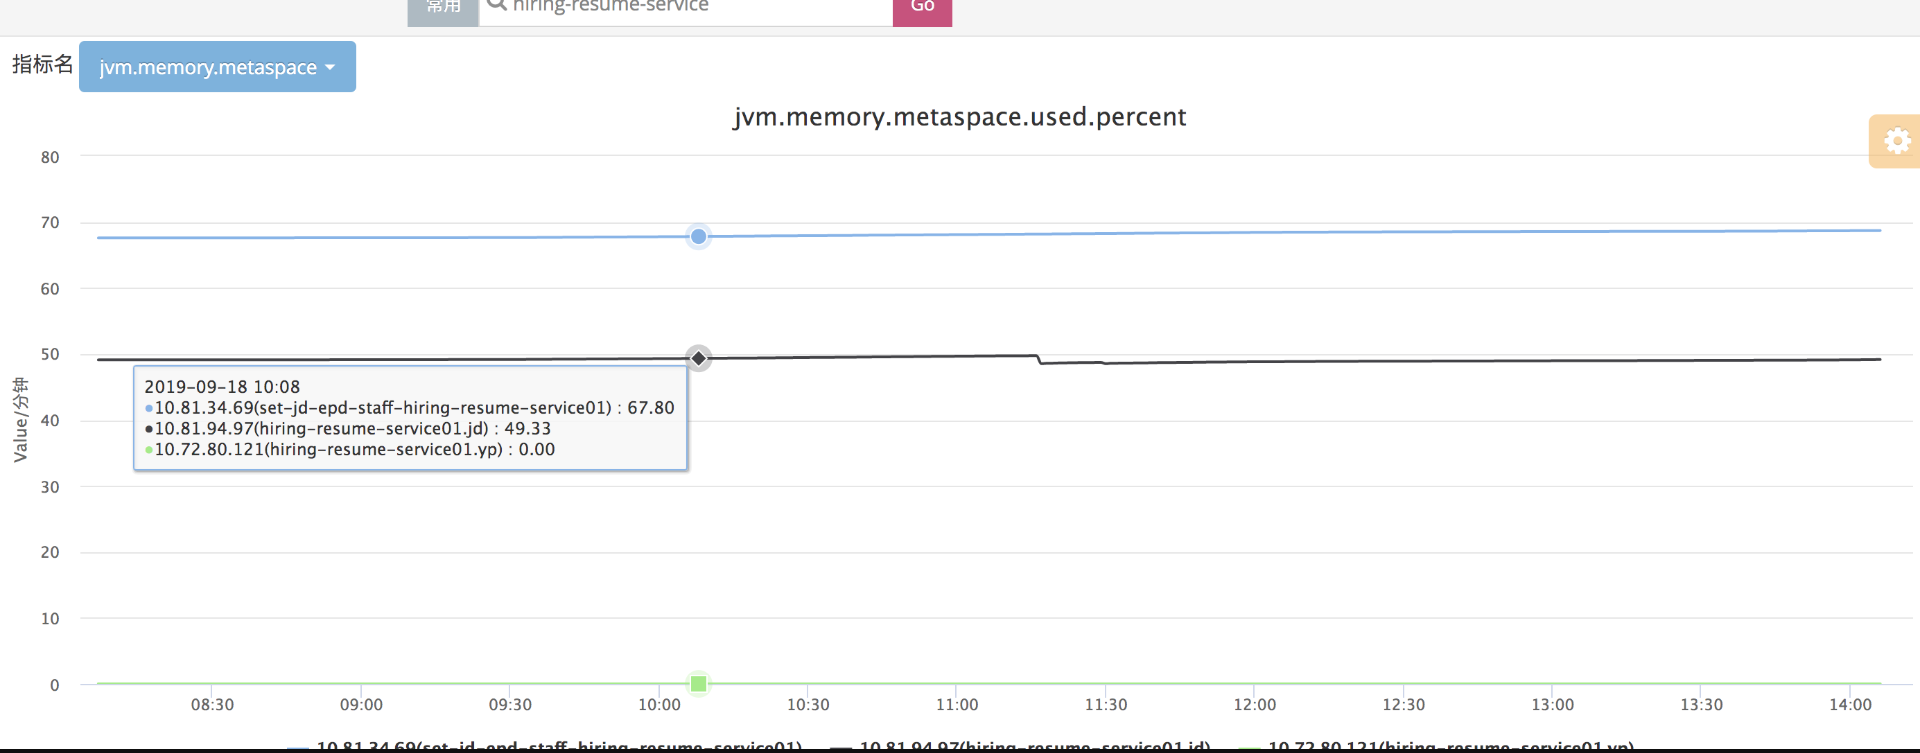
image.png
"Looking at the cat monitoring data, when the utilization rate of Metaspace is 50%, it is FGC, and the display on the GC log only uses 142M, but we clearly set the initial value to 256M and the maximum value to 250M, which has not reached the threshold."
Smart as me, quickly reply "wait, I'll see it when I'm free"
When I was free, I thought of this problem again and decided to study it well.
Since the FGC is caused by Metadata GC Threshold, it can only be that the metadata space is used up. I repeatedly looked at the GC log fragment and stared at it for a while
[0x00000006f3400000, 0x00000007c0000000, 0x00000007c0000000)
4159977  Metaspace       used 128145K, capacity 136860K, committed 262144K, reserved 1234944K
Before FGC, the committed of Metaspace did reach 256M,
We need to know one thing: when the current committed memory + the memory to be allocated reaches the Metaspace threshold, the FGC of Metadata GC Threshold will occur.
Seeing here, we can probably guess that FGC is reasonable this time.
However, why should I apply for other memory when the used index is only 125M?
There seems to be only one reason: memory fragmentation.
I've only heard about the old days before, because the tag cleaning of CMS will produce memory fragments and lead to FGC. Why does Metaspace have such a problem?
Let colleagues dump the problematic machine. After opening it with mat, they found a new world, including a large number of class loaders.
Is this fragmentation problem caused by a large number of class loaders?
Local authentication
With this question, it's easy to see if it can be reproduced locally.
1. First define a custom class loader to destroy parental delegation
public class MyClassLoader extends ClassLoader {

        @Override
        protected Class<?> findClass(String name) throws ClassNotFoundException {
            try{
                String filePath = "/Users/zhanjun/Desktop/" + name.replace('.', File.separatorChar) + ".class";
                //Specifies to read from a folder on the disk class file:
                File file = new File(filePath);
                FileInputStream fis = new FileInputStream(file);
                byte[] bytes = new byte[fis.available()];
                fis.read(bytes);
                //Call the defineClass method to convert the byte array into a Class object
                Class<?> clazz = this.defineClass(name, bytes, 0, bytes.length);
                fis.close();
                return clazz;
            }catch (FileNotFoundException e){
                e.printStackTrace();
            } catch (IOException e) {
                e.printStackTrace();
            } finally {

            }
            return super.findClass(name);
        }
    }
2. Then, in the while loop, continuously load the compiled class files
public static void main(String[] args) throws Exception {
        while (true) {
            Class clazz0 = new MyClassLoader().loadClass("com.sankuai.discover.memory.OOM");
        }
    }
3. Finally, configure the jvm startup parameters
-Xmx2688M -Xms2688M -Xmn960M -XX:MetaspaceSize=50M -XX:MaxMetaspaceSize=100M -XX:+PrintGCDetails -XX:+PrintGCDateStamps -XX:+PrintHeapAtGC -XX:+UseConcMarkSweepGC
After startup, a log appeared on the console shortly after
{Heap before GC invocations=0 (full 0):
 par new generation   total 884736K, used 330302K [0x0000000752400000, 0x000000078e400000, 0x000000078e400000)
  eden space 786432K,  42% used [0x0000000752400000, 0x000000076668fae0, 0x0000000782400000)
  from space 98304K,   0% used [0x0000000782400000, 0x0000000782400000, 0x0000000788400000)
  to   space 98304K,   0% used [0x0000000788400000, 0x0000000788400000, 0x000000078e400000)
 concurrent mark-sweep generation total 1769472K, used 0K [0x000000078e400000, 0x00000007fa400000, 0x00000007fa400000)
 Metaspace       used 22636K, capacity 102360K, committed 102400K, reserved 1118208K
  class space    used 8829K, capacity 33008K, committed 33008K, reserved 1048576K
2019-09-21T16:09:28.562-0800: [Full GC (Metadata GC Threshold) 2019-09-21T16:09:28.562-0800: [CMS: 0K->5029K(1769472K), 0.0987115 secs] 330302K->5029K(2654208K), [Metaspace: 22636K->22636K(1118208K)], 0.1340367 secs] [Times: user=0.11 sys=0.03, real=0.13 secs]
Heap after GC invocations=1 (full 1):
 par new generation   total 884736K, used 0K [0x0000000752400000, 0x000000078e400000, 0x000000078e400000)
  eden space 786432K,   0% used [0x0000000752400000, 0x0000000752400000, 0x0000000782400000)
  from space 98304K,   0% used [0x0000000782400000, 0x0000000782400000, 0x0000000788400000)
  to   space 98304K,   0% used [0x0000000788400000, 0x0000000788400000, 0x000000078e400000)
 concurrent mark-sweep generation total 1769472K, used 5029K [0x000000078e400000, 0x00000007fa400000, 0x00000007fa400000)
 Metaspace       used 2885K, capacity 4500K, committed 43008K, reserved 1058816K
  class space    used 291K, capacity 388K, committed 33008K, reserved 1048576K
}
It can be seen from the log that before FGC, the used is about 22M and the committed has reached 100M. At this time, when loading the class, you need to apply for memory, which is not enough. You can only organize and compress the memory of Metaspace through FGC.
Up to now, we have verified that too many class loaders can indeed cause FGC.
How does memory fragmentation occur?
In fact, in order to achieve efficient allocation within the JVM, when the class loader first loads a class, it will allocate an independent memory block in the Metaspace, and then the class information loaded by the class will be saved in the memory block. However, if this class loader only loads one or a few classes, this memory will be wasted. If there are too many class loaders, memory fragments will be generated.

Well, everyone, the above is the whole content of this article. The people who can see here are talents.
I will update several articles related to the interview of front-line Internet companies and common technology stacks every week. Thank you very much for reading here. If this article is well written and feels that "xv: bjmsb003" I have something, please praise, pay attention and share 👥 It's really useful for me!!!
White whoring is not good and creation is not easy. Your support and recognition is the biggest driving force for my creation. See you in the next article!
If there are any mistakes in this blog, please comment and advice. Thank you very much!