Adding custom monitors to zabbix
By writing scripts to obtain various states of tcp, adding TCP status template, triggers, graphics, the whole process of customizing monitoring through scripts is realized.
1. agent-side configuration
1. Create custom scripts to store directories
[root@localhost ~]# mkdir /etc/zabbix/scripts
[root@localhost ~]# chown zabbix.zabbix /etc/zabbix/scripts/
2. Create scripts
Create a script to get the tcp status, as shown below
#!/bin/bash
#this script is used to get tcp and udp connetion status
#tcp status
metric=$1
tmp_file=/tmp/tcp_status.txt
/bin/netstat -an|awk '/^tcp/{++S[$NF]}END{for(a in S) print a,S[a]}' > $tmp_file

case $metric in
  closed)
         output=$(awk '/CLOSED/{print $2}' $tmp_file)
         if [ "$output" == "" ];then
            echo 0
         else
            echo $output
         fi
       ;;
  listen)
         output=$(awk '/LISTEN/{print $2}' $tmp_file)
         if [ "$output" == "" ];then
            echo 0
         else
            echo $output
         fi
       ;;
  synrecv)
         output=$(awk '/SYN_RECV/{print $2}' $tmp_file)
         if [ "$output" == "" ];then
            echo 0
         else
            echo $output
         fi
       ;;
  synsent)
         output=$(awk '/SYN_SENT/{print $2}' $tmp_file)
         if [ "$output" == "" ];then
            echo 0
         else
            echo $output
         fi
       ;;
  established)
         output=$(awk '/ESTABLISHED/{print $2}' $tmp_file)
         if [ "$output" == "" ];then
            echo 0
         else
            echo $output
         fi
       ;;
  timewait)
         output=$(awk '/TIME_WAIT/{print $2}' $tmp_file)
         if [ "$output" == "" ];then
            echo 0
         else
            echo $output
         fi
       ;;
  closing)
         output=$(awk '/CLOSING/{print $2}' $tmp_file)
         if [ "$output" == "" ];then
            echo 0
         else
            echo $output
         fi
       ;;
  closewait)
         output=$(awk '/CLOSE_WAIT/{print $2}' $tmp_file)
         if [ "$output" == "" ];then
            echo 0
         else
            echo $output
         fi
       ;;
  lastack)
         output=$(awk '/LAST_ACK/{print $2}' $tmp_file)
         if [ "$output" == "" ];then
            echo 0
         else
            echo $output
         fi
        ;;
  finwait1)
         output=$(awk '/FIN_WAIT1/{print $2}' $tmp_file)
         if [ "$output" == "" ];then
            echo 0
         else
            echo $output
         fi
        ;;
  finwait2)
         output=$(awk '/FIN_WAIT2/{print $2}' $tmp_file)
         if [ "$output" == "" ];then
            echo 0
         else
            echo $output
         fi
        ;;
        *)
         echo -e "\e[033mUsage: sh  $0 [closed|closing|closewait|synrecv|synsent|finwait1|finwait2|listen|established|lastack|timewait]\e[0m"
esac
3. Configure zabbix_agent d.conf
To execute a custom script to get data, you need to open the appropriate options in the configuration file. If you have started, you can skip this step.
[root@localhost ~]# egrep -v "(^#|^$)" /etc/zabbix/zabbix_agentd.conf
PidFile=/var/run/zabbix/zabbix_agentd.pid
LogFile=/var/log/zabbix/zabbix_agentd.log
LogFileSize=1
EnableRemoteCommands=1  #Allow remote commands to be executed locally
Server=c2600217k6.wicp.vip
ListenPort=10050
ListenIP=0.0.0.0
StartAgents=3
Hostname=47.96.226.49
UnsafeUserParameters=1 #Enable user-defined monitoring scripts
Include=/etc/zabbix/zabbix_agentd.d/*.conf
Timeout=8
4. Custom key profile
[root@localhost ~]# cat /etc/zabbix/zabbix_agentd.d/tcp-status-params.conf
UserParameter=tcp.status[*],/etc/zabbix/scripts/tcp_conn_status.sh $1
Note: The tcp.status here is the monitored item name, followed by $1 is the corresponding parameter.
For example, the state of closewait is tcp.status[closewait]
5. Restart service
[root@localhost ~]# systemctl restart zabbix-agent.service
6. Testing
Test whether you can get customized monitoring data by zabbix_get on the server side
[root@localhost ~]# zabbix_get -s ip -p 10050 -k "tcp.status[listen]"
13
[root@localhost ~]# zabbix_get -s ip -p 10050 -k "tcp.status[listen]" 13
No problem with data
Note: This command is executed on the server side of zabbix, not on the agent side.
If there is no zabbix_get command, install zabbix_get
[root@localhost ~]# yum -y install  zabbix-get
 Loaded plug-in: fastest mirror
Loading mirror speeds from cached hostfile
 * base: mirrors.aliyun.com
 * epel: mirrors.aliyun.com
 * extras: mirrors.aliyun.com
 * updates: mirrors.aliyun.com
 The package zabbix-get-4.0.12-1.el7.x86_64 is installed and is the latest version without any processing.
Defining custom templates
After the agent side configuration is completed, we need to create the corresponding template on the zabbix server web. Other hosts can apply the template to obtain custom data.
1. Creating Templates
Create a new template in Configuration -> Template ->.
The template name "TCP_CONN_STATUS" group is placed in Templates, and the configuration is shown below.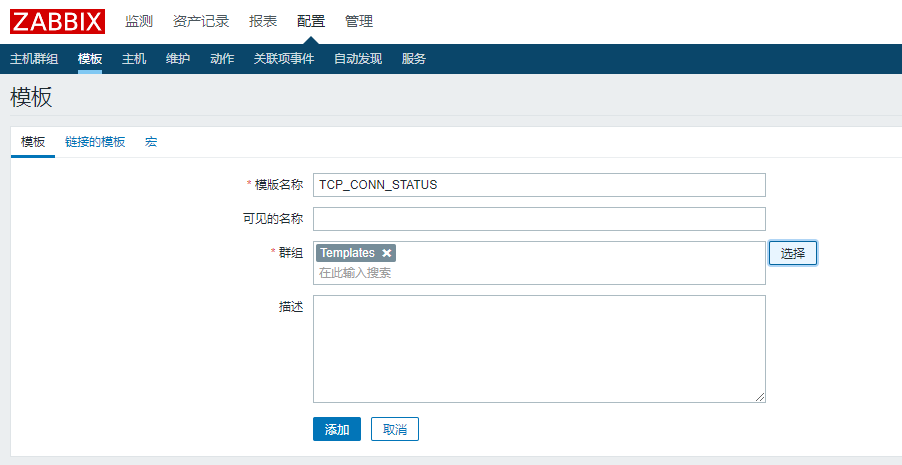
2. Create monitoring items
After creating the template, we should create the application set first, but when creating the monitor item, we can create the application set directly, so we skip the creation of the application set.
Find the newly created template in Configuration -> Template -> TCP_CONN_STATUS -> Monitor Item -> Create Monitor Item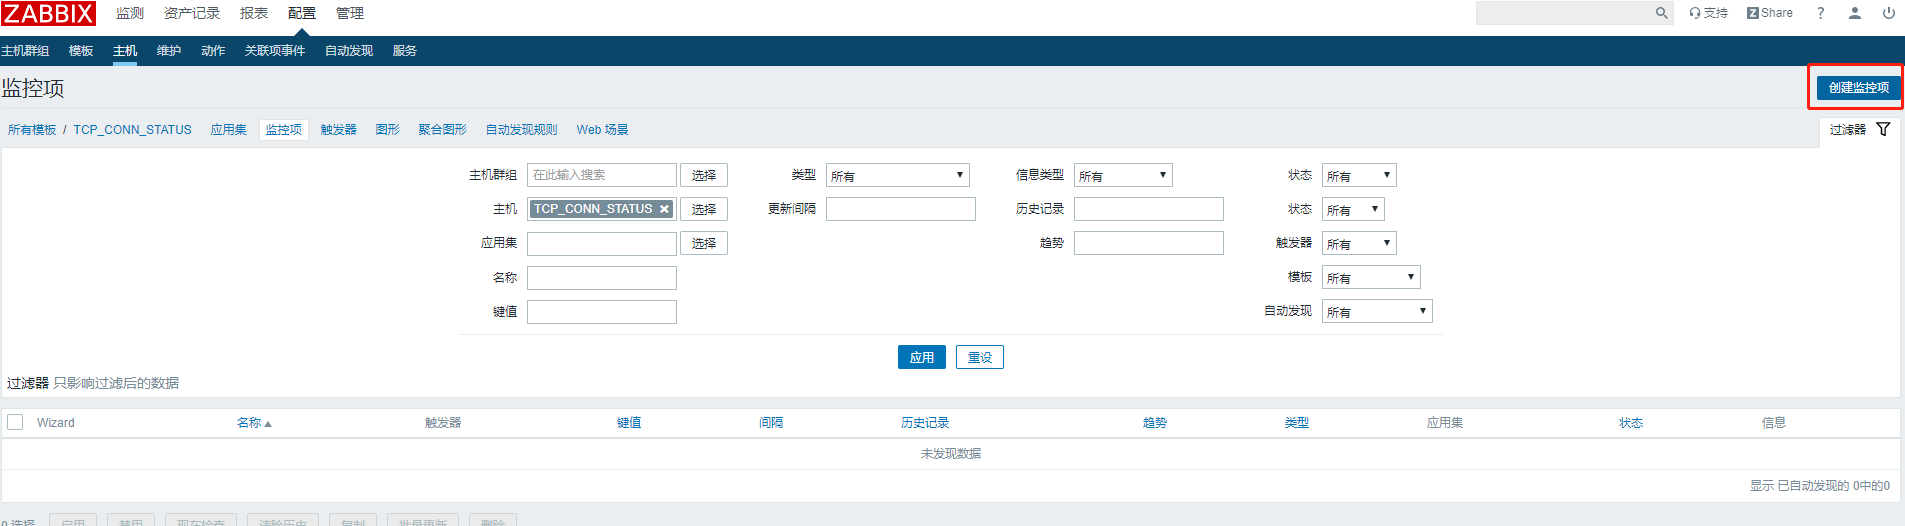
In the monitor item, we define the name TCP_CONN_LISTEN to monitor the number of LISTENs in tcp. The key value is tcp.status[listen] defined in our custom key, and then select the new application set TCP_CONN_STATUS at the application set. Click Add, as shown in the following figure: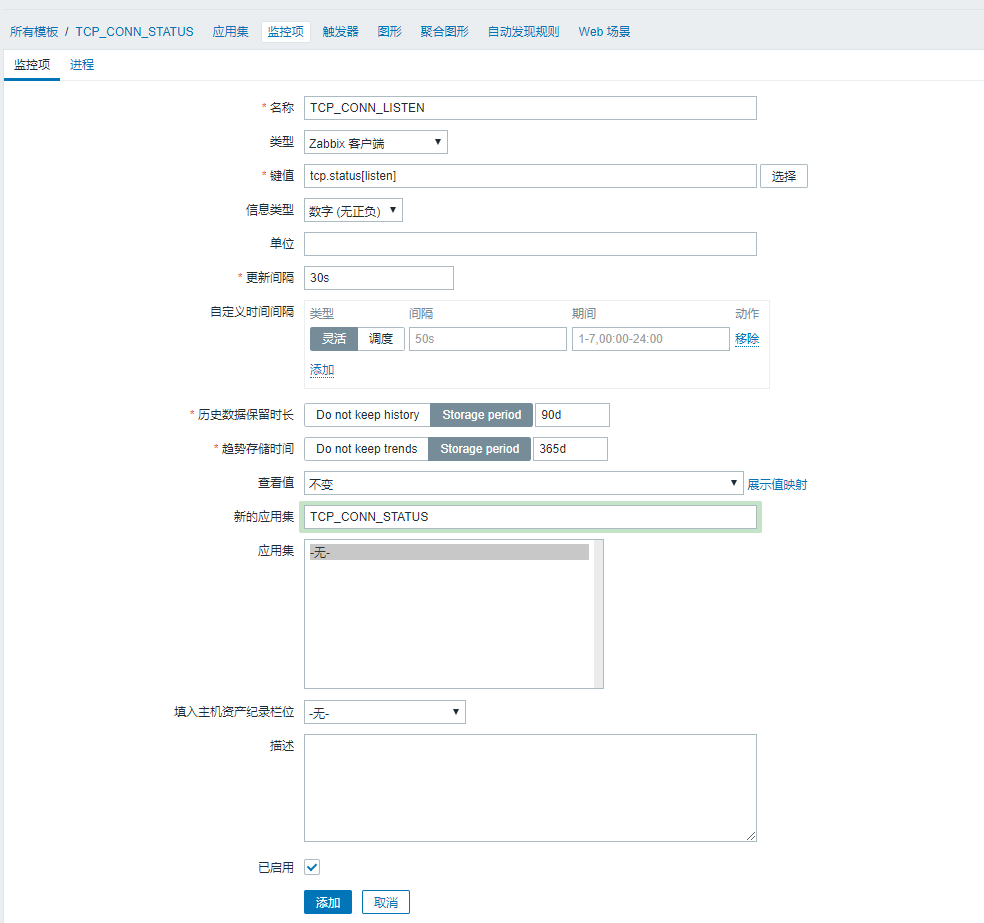
Create other tcp states such as TCP_CONN_CLOSED, TCP_CONN_FIN-WAIT-1, TCP_CONN_LAST-ACK, TCP_CONN_SYN-RECV, TCP_CONN_TIME-WAIT and so on by the above steps.
The final monitoring items are shown in the following figure: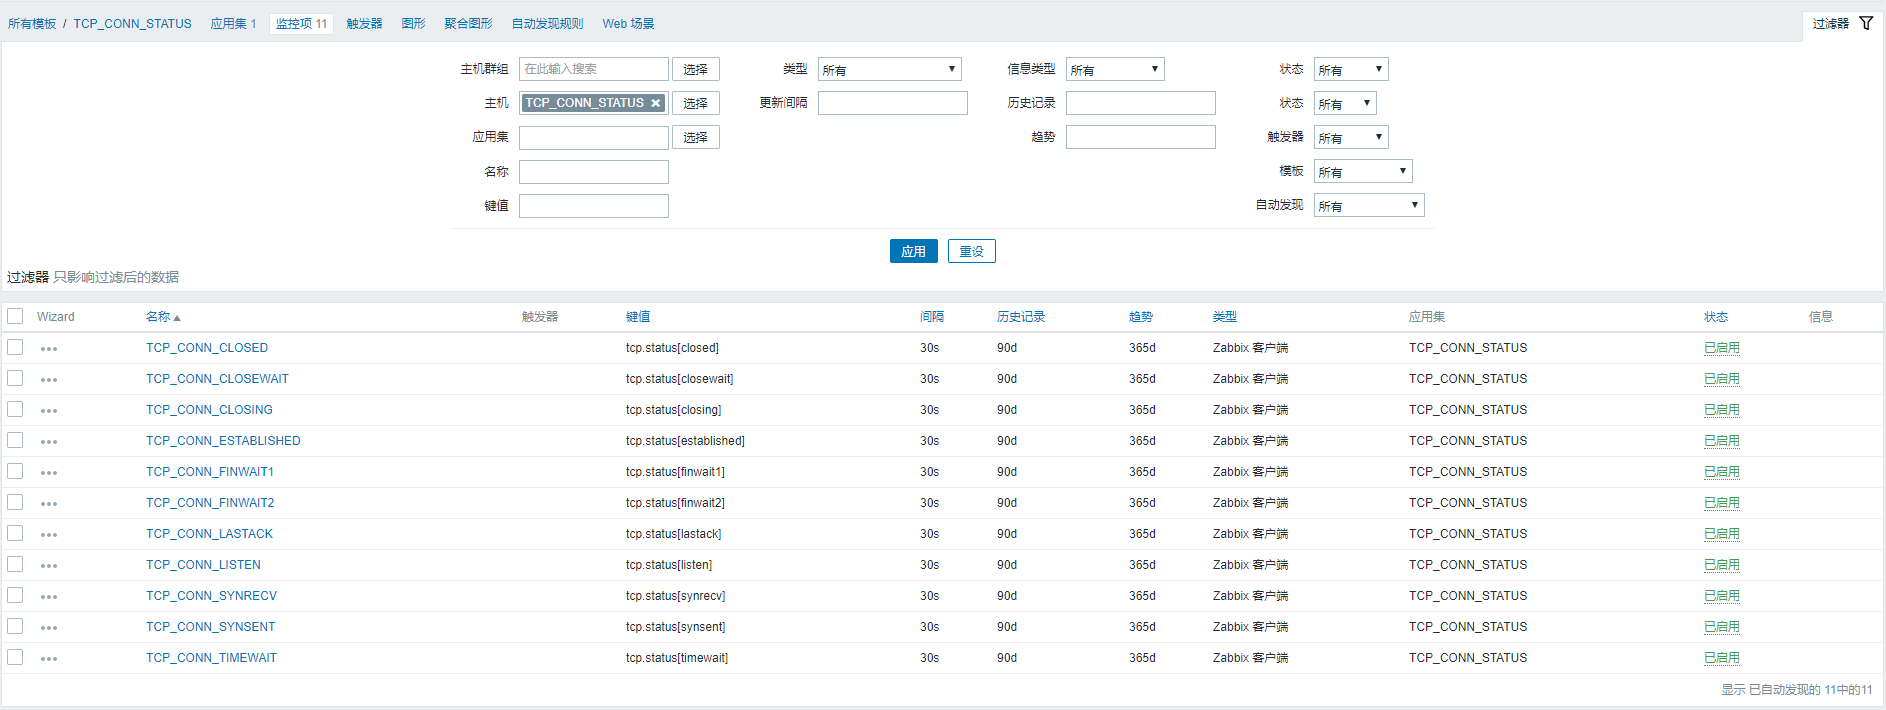
3. Create triggers
Find the newly created template in Configuration -> Template -> TCP_CONN_STATUS -> Trigger -> Create Trigger, as shown in the following figure: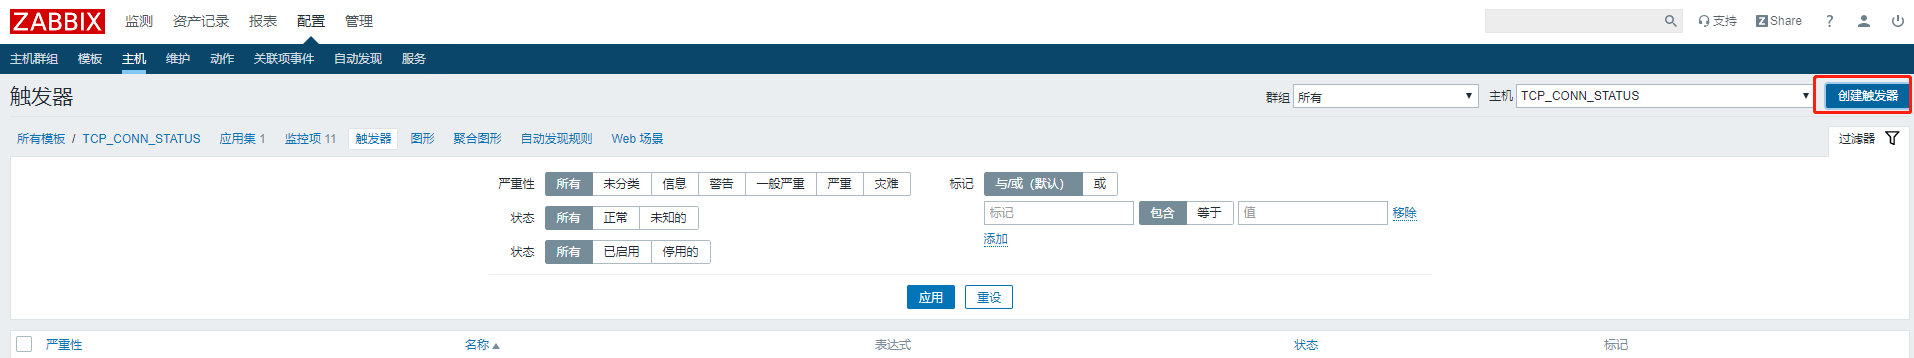
Create a trigger named Too Many Tcp Closewait, set the number of closewaits to alarm, I set it to 500, the expression is {TCP_CONN_STATUS: tcp. status [closed]. last ()}> 500, the specific configuration is as follows: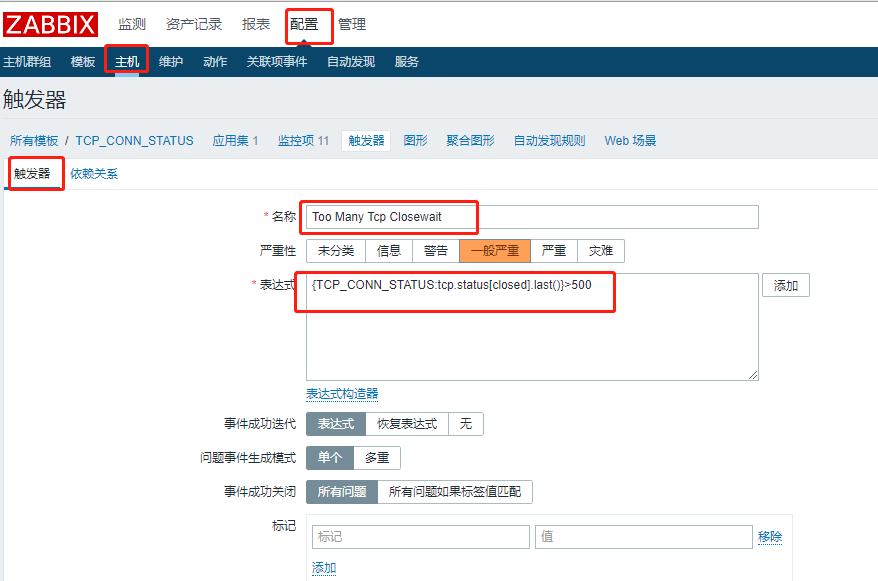
The expression is added at that point. In the monitor item, select the close wait monitor item and insert the result with > 500 clicks, as shown in the following figure: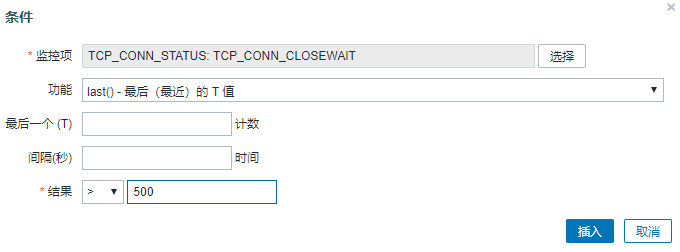
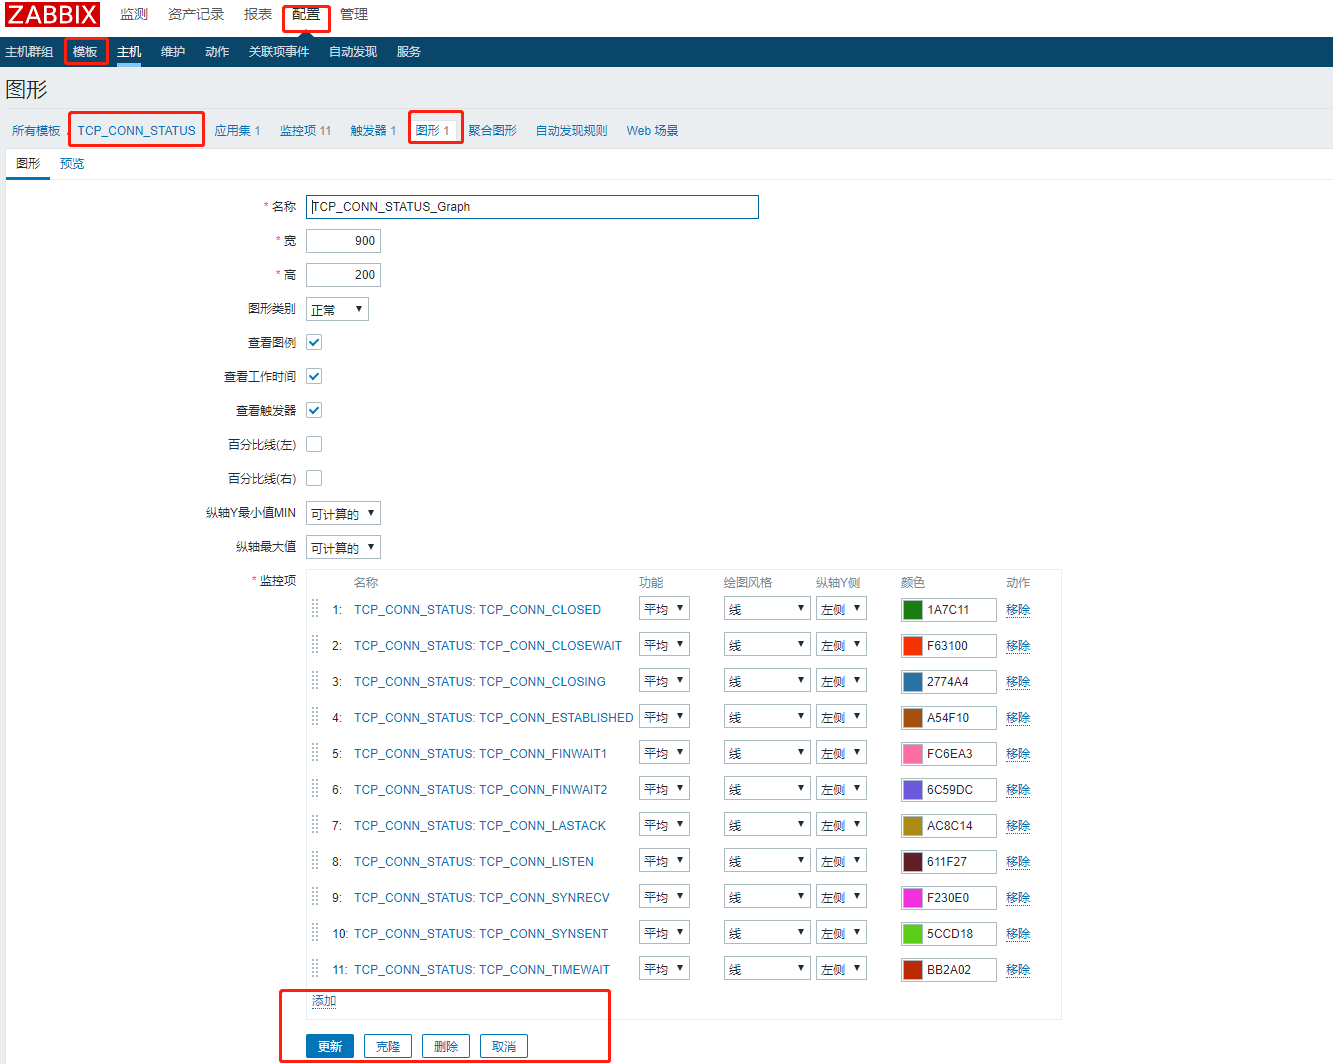
4. Creating Graphics
Configuration -> Module -> TCP_CONN_STATUS - > Graphics - > Create Graphics - > Name "TCP_CONN_STATUS_Graph" - > Select Pre-monitor - > Add as follows: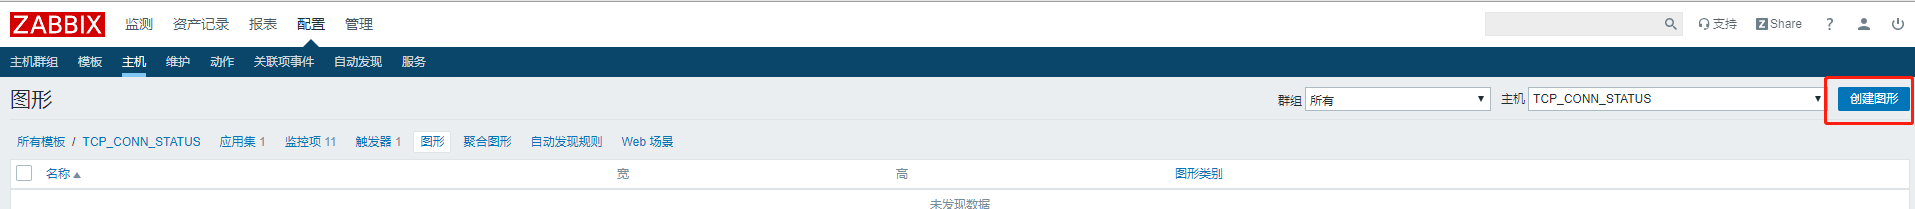
To complete a custom monitoring template definition here
5. Associated Host
Connect the template we just created to our host for the template to take effect
In Configuration -> Host -> Select the Host to Monitor -> Click Template -> Select the Template we just created on the Link Indicator, click Add -> Click Update, and the Template is added, as shown in the following figure: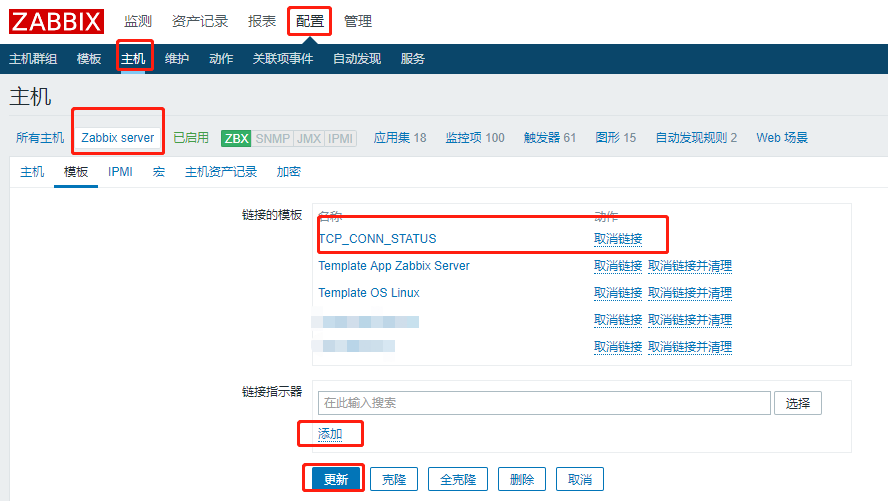
We can see the latest data generation in Detect -> Latest Data -> Select the host that just added the template -> Select the Application Set (TCP_CONN_STATUS), which shows that our template configuration is successful, as shown in the following figure: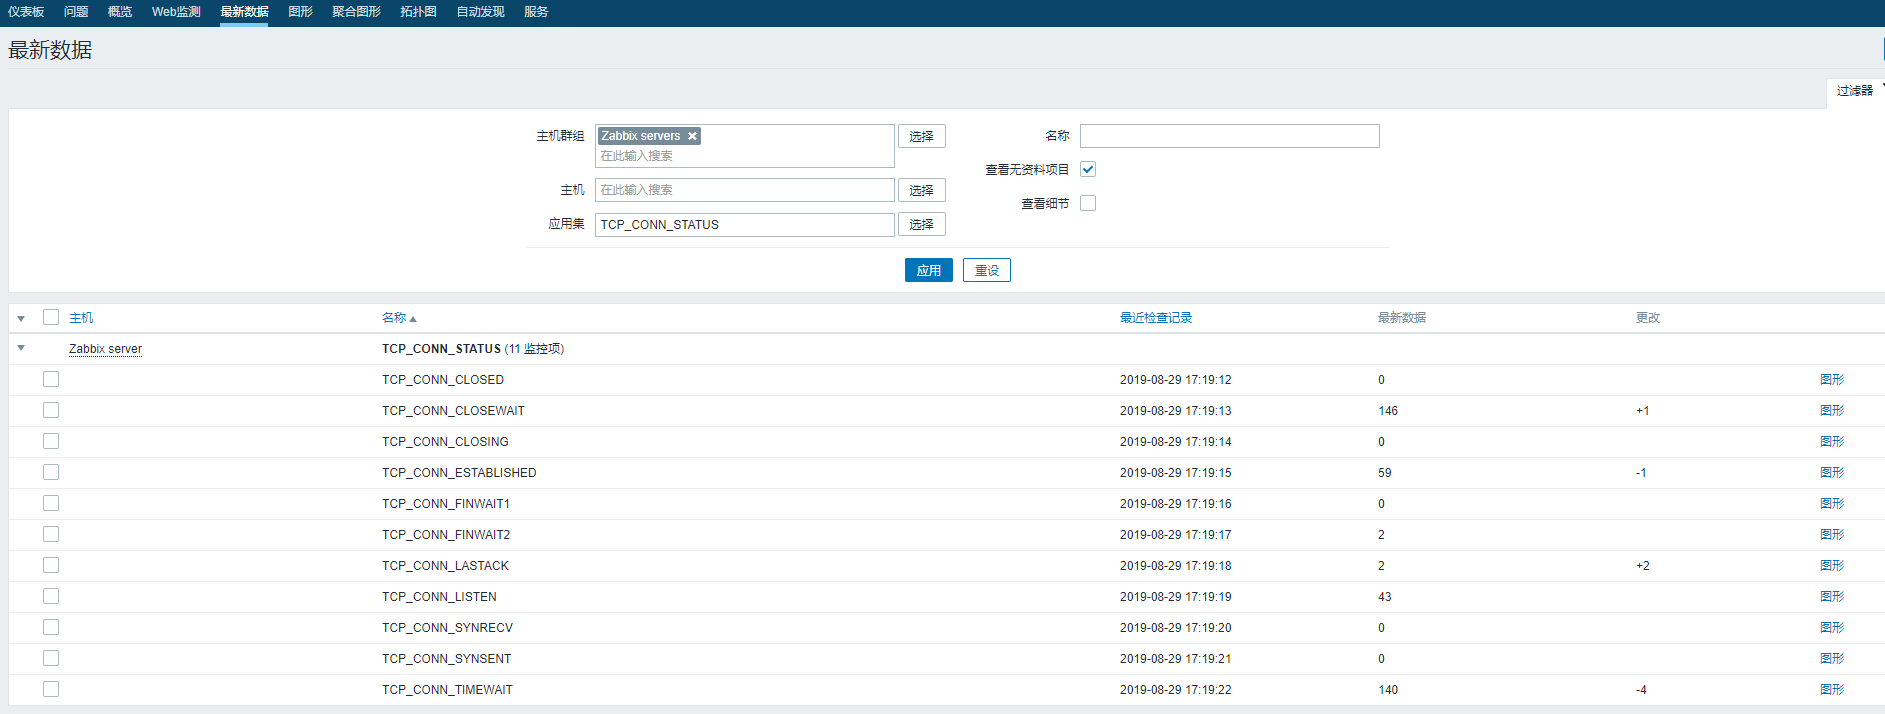
You can also select TCP_CONN_STATUS_Graph we created earlier in the graph to see the graph generation, as shown in the following figure: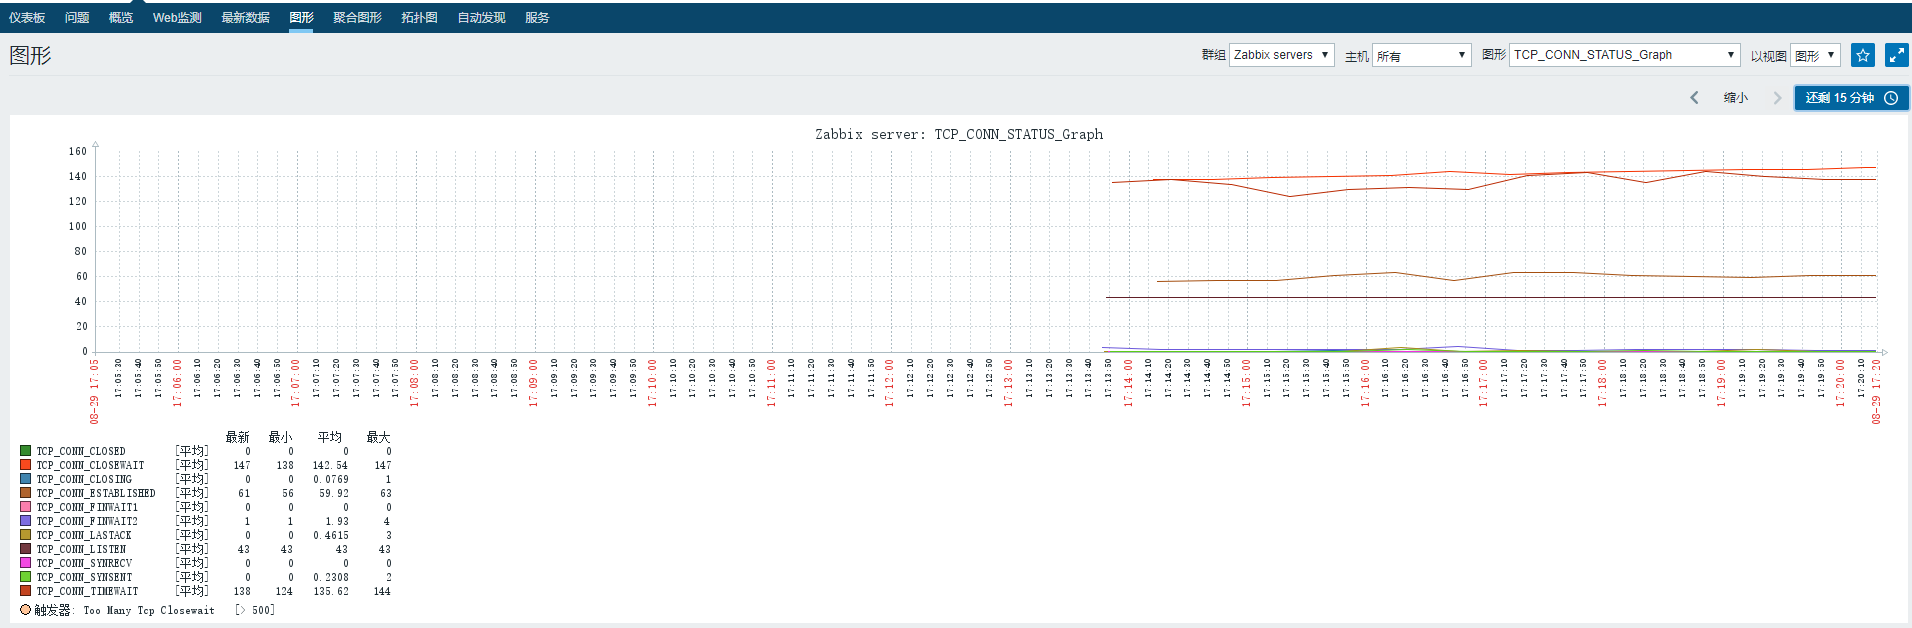
Little knowledge:
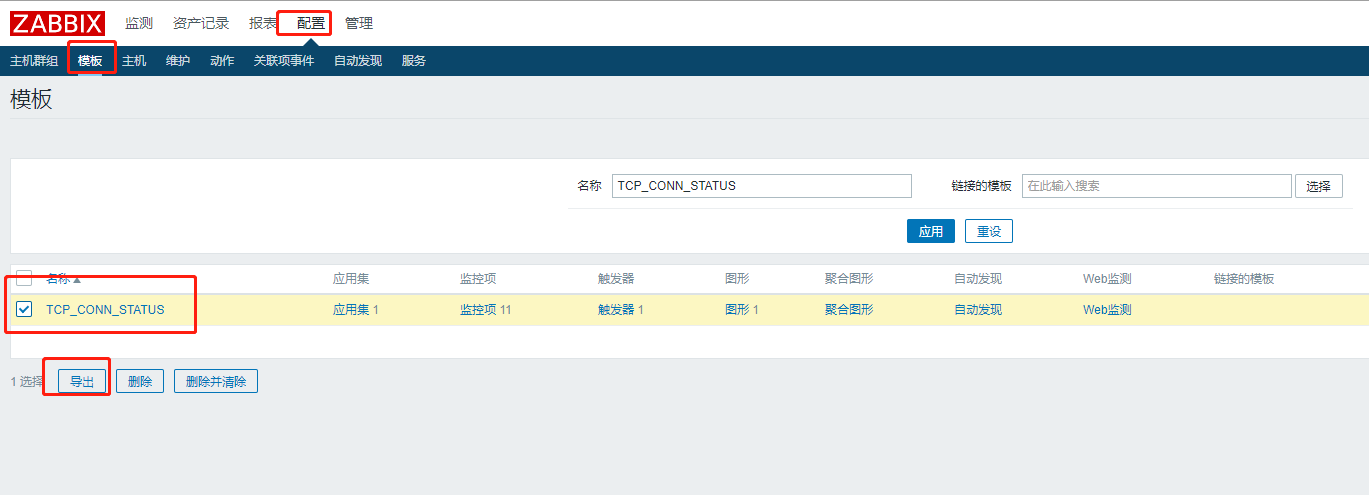
After we have created the template, we can choose to export the template to facilitate our sharing and reuse.
In Configuration -> Template -> Find the Template we created -> Check Template -> Click Export
Save the exported files and use them on other hosts. Note that the template and agent configurations should be consistent.