
preface
The text and pictures of this article are from the Internet, only for learning and communication, not for any commercial purpose. The copyright belongs to the original author. If you have any questions, please contact us in time for handling.
What do you want to do most after the outbreak? Take off the mask and go out for the sun. Do you want Korean food? Or rolling? Or hot pot? Stay with your family for a few days to make up for the missing company during the Spring Festival; go to the once familiar cinema and make up all the missed New Year's blockbusters.
When the epidemic is over, do you want to go to the hero city of Wuhan, see cherry blossom, eat a bowl of hot and dry noodles in Hubu lane, and see the Yangtze River Bridge where cars come and go. Whether there will be more travel plans, no matter where the beautiful scenery, want to see.
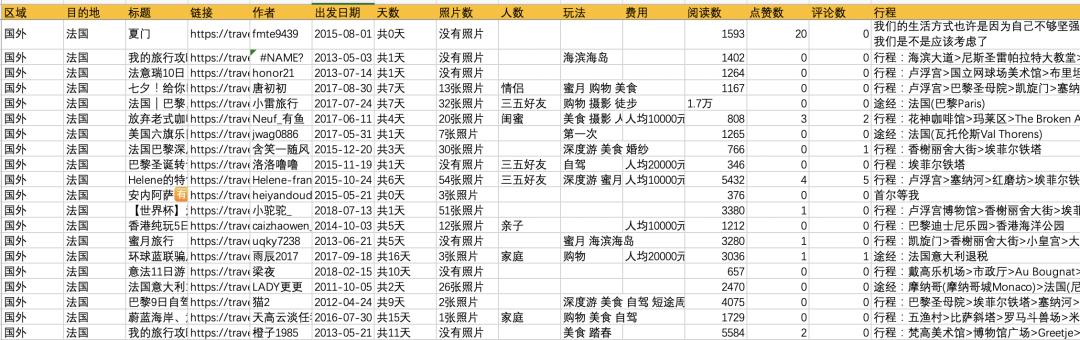
Travel is to relax and experience local characteristics. For a perfect trip, it is necessary to make a detailed travel strategy. For this reason, in the last article, the editor has crawled through the strategy database of "where to go" and obtained nearly 3.8 strategy data. Data fields include: area, destination, title, link, strategist, departure date, days, number of photos, number of people, play method, cost, number of reading, number of likes, number of comments, itinerary, etc.

Data preprocessing
For the acquired data, we need to carry out further processing to meet the needs of analysis. The main data processing steps are as follows:
- Delete duplicate values
- Correction field
- Delete unnecessary fields
Specific code implementation
#data fetch
import pandas as pd
import re
#data fetch
base_data =  pd.read_excel('trip_data_merge.xlsx')
#Delete duplicate values
base_data.drop_duplicates(inplace=True)
#Fields not needed in analysis
base_data = base_data.drop(['link'], axis=1)
#Field correction, convenient for statistics
base_data['Days']= base_data['Days'].apply(lambda x :re.sub("\D", "", x) )
base_data['Number of photos']= base_data['Number of photos'].apply(lambda x :re.sub("\D", "", x) )
base_data['cost']= base_data['cost'].apply(lambda x :re.sub("\D", "", str(x) ))
base_data['cost'] = base_data['cost'].apply(lambda x : eval(x) if len(x)>0 else 0 )
base_data['date']= base_data['Departure date'].apply(lambda x :x.split( )[0] )
base_data['date_year']= base_data['Departure date'].apply(lambda x :x.split( )[0][:4])
base_data['Number of readings']= base_data['Number of readings'].apply(lambda x : int(re.sub("\D", "", str(x)))*10000 if str(x).find('ten thousand') else x)
Data analysis and visualization
Cost issues
The first thing to consider when traveling is the cost. Due to the epidemic situation, in the cost data analysis and statistics, we have excluded the data in 2020 and considered the data in 2017, 2018 and 2019.
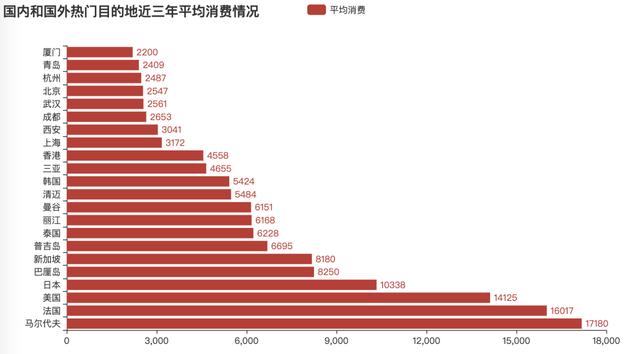
The figure above shows the per capita consumption of major hot destinations in the past three years, including domestic and foreign hot areas. According to the statistics, the average per capita consumption in foreign countries is 9461 yuan, and that in China is 3313 yuan. The consumption of tourists in foreign countries is 2.85 times of that in China. The top four domestic per capita consumption: Lijiang, Sanya, Hong Kong and Shanghai. Top four consumers abroad: Maldives, France, the United States, Japan. Why is the per capita consumption of tourists in Maldives 6 times higher than that in Shanghai?
Tourists
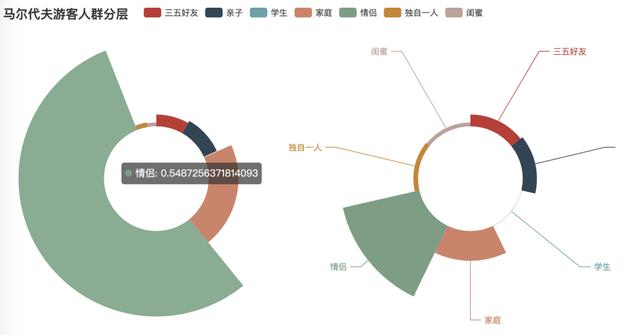
Distribution of tourists in Maldives
Distribution of tourists in Shanghai
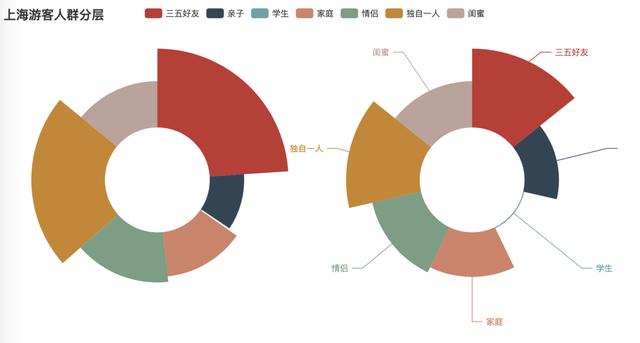
Maldives, a place with a name that makes people imagine, is called the necklace god throws on the world. The last paradise of the world attracts many people to go on holiday and leisure. The proportion of lovers is as high as 54.8%. In addition, the consumption of machine wine is also an important reason for the high consumption of Maldives. The tourists in Shanghai are relatively scattered, and the proportion of lovers is about 15%, One person travel, 35 friends account for a relatively high proportion.
Length of stay
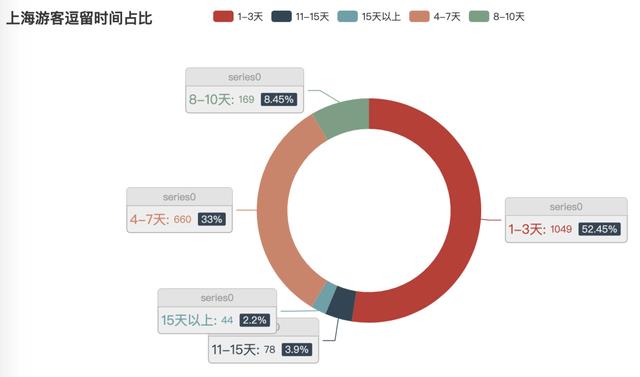
Length of stay of Shanghai tourists
Length of stay of Maldives tourists
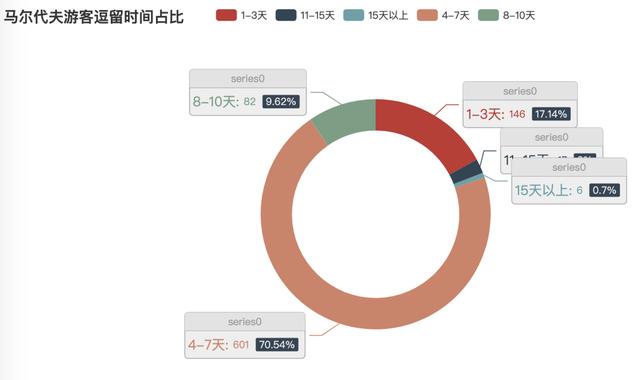
To judge the attraction of a city to tourists, the stay time of tourists is the core index. From the above figure, we can see that the total stay time of Maldives is more than 80% in 4-7 days and 8-10 days. The proportion of staying time in Shanghai in 1-3 days is 52.45%, and that in 4-7 days and 8-10 days is about 41%, which is an important factor of high per capita consumption in Maldives.
Play strategy
We can see that food, shopping + food, short weekend, seashore Island, self driving and other playing methods are your favorite. Exploration, tour, cycling and so on are also popular with many people. What kind of playing methods do you like?
Punch in attractions
Go to a place to travel, some scenic spots must go, for a strange city, how can you quickly determine the punch point? Xiao Bian chooses Shanghai, Chengdu and Wuhan to see if there are any missed punch points.


Best route
There are all kinds of punch in spots we want to go to. We need to have the most perfect route. Xiaobian combs the route that netizens like the most. Are you satisfied? Let's take a picture.

conclusion
So far, the editor has taken you to know about the average consumption of the tourist destination, the strategies of playing, the strategies of punching cards, the best routes, etc. if you have any questions, please leave a message in the comment area, and attach some core codes because of the space display
Core code display
#Proportion of stay days of Shanghai tourists
from pyecharts import options as opts
from pyecharts.charts import Pie
from pyecharts.faker import Faker

c = (
    Pie()
    .add(
        "",
        [list(z) for z in zip(list(base_data_city_day_sh['Days']), list(base_data_city_day_sh['num']))],
        radius=["40%", "55%"],
        label_opts=opts.LabelOpts(
            position="outside",
            formatter="{a|{a}}{abg|}\n{hr|}\n {b|{b}: }{c}  {per|{d}%}  ",
            background_color="#eee",
            border_color="#aaa",
            border_width=1,
            border_radius=4,
            rich={
                "a": {"color": "#999", "lineHeight": 22, "align": "center"},
                "abg": {
                    "backgroundColor": "#e3e3e3",
                    "width": "100%",
                    "align": "right",
                    "height": 22,
                    "borderRadius": [4, 4, 0, 0],
                },
                "hr": {
                    "borderColor": "#aaa",
                    "width": "100%",
                    "borderWidth": 0.5,
                    "height": 0,
                },
                "b": {"fontSize": 16, "lineHeight": 33},
                "per": {
                    "color": "#eee",
                    "backgroundColor": "#334455",
                    "padding": [2, 4],
                    "borderRadius": 2,
                },
            },
        ),
    )
    .set_global_opts(title_opts=opts.TitleOpts(title="Proportion of stay time of Shanghai tourists"))
    .render("Proportion of stay time of Shanghai tourists.html")
)
Cloud of words
import stylecloud
from IPython.display import Image # Used to display local pictures in jupyter lab
result_gap = ' '.join(result)
# Draw word cloud
stylecloud.gen_stylecloud(text=result_gap,
                          max_words=1000,
                          collocations=False,
                          font_path=r'msyh.ttf',
                          icon_name='fas fa-plane-departure',
                          size=624,
                          output_name='Cloud chart of punch words.png')

Image(filename='Cloud chart of punch words.png')