8, Jmeter listener
Monitor the data in the execution process with a listener; Such as execution times, response time, throughput, error rate, etc
In jmeter, the listener component provides the functions of viewing, saving, and reading saved test results.
By default, the test results will be stored as an xml file with the suffix:. jtl. Another storage format is CSV file, which has the advantage of higher efficiency, but the stored information is not as detailed as xml format.
Common listener reports
View result tree
The most used listeners during testing with Jmeter
You can see the requested parameters and response results during the test process, which is convenient to judge the results of the test script
However, in the actual project process, whether it is interface automation test or performance test, when the test script is really run. In general, the view result tree needs to be closed.
Attachment: generally only used for debugging scripts.
Summary Report
Summary report; Summary report
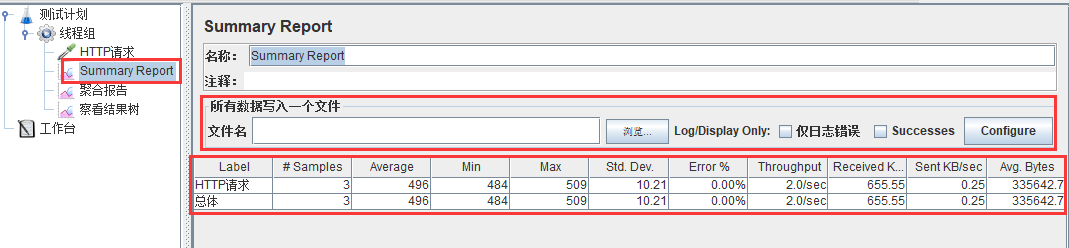
Write all data to a file: save the test results locally.

File name: Specifies the result to be saved.

Log error only: save only the error part in the log.

Successes: Save the successful part of the log.

Configure: Set the result properties, that is, which result fields are saved to the file. Generally, you can save the necessary field information. The more you save, the better the load machine will be IO Will have an impact.

Label: Sampler/Listener name  [It's better to change it to business name]

Samples : Number of transactions

Average: Average time taken to complete a transaction (average response time)

Median: The intermediate value of all response times, that is, 50% User response time, which probably means this

Min: Minimum response time

Max: Maximum response time


The above units are ms
Std.Dev: Deviation/The smaller the standard deviation, the more stable it is

Error %: Error transaction rate

Throughtput: Transactions per second, i.e tps throughput

Received KB/sec: network throughput;The unit of network traffic received and sent is KB

Avg.Bytes: Average data flow, unit: Byte.
Aggregate Report
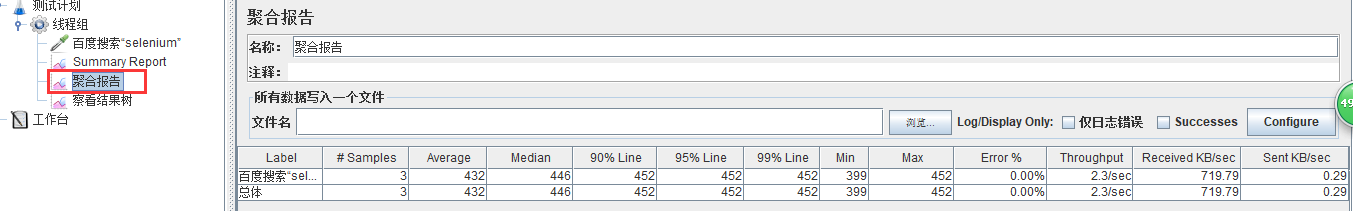
Label: Request corresponding name Property value.

Samples :  The number of samples with the same label and the total number of requests issued.

Average : Average response time for requests.

Median - 50%: 50%None of the samples exceeded this time. This value means that all data are arranged from small to large, that is, they are arranged at the 50th%Value of.

90% Line : 90%None of the samples exceeded this time. This value means that all data are arranged from small to large, that is, they are arranged at the 90th%Value of.

95% Line : 95%None of the samples exceeded this time. This value means that all data are arranged from small to large, that is, they are arranged at 95th%Value of.

99% Line : 99%None of the samples exceeded this time. This value means that all data are arranged from small to large, that is, they are arranged at the 99th%Value of.

Min :  Minimum response time.

Max :  Maximum response time.

Error % : Percentage of requests with errors in this test.

Throughput :  Throughput is in seconds/minute/Measured by the number of requests per hour. This represents the number of requests completed per second.

Received KB/sec :  Throughput test of kilobytes per second received.

Sent KB/sec :  Throughput test of kilobytes per second sent.
90% understanding in aggregate reports
90% Line : 90% of the samples took no more than this time. The remaining samples at leastt as long as this.

Arrange a group of numbers from small to large to find his 90th%Number (if it is 12), then there are 90 in this array%	The number of will be less than or equal to 12, that is, 90%The user response time will not exceed 12 seconds.
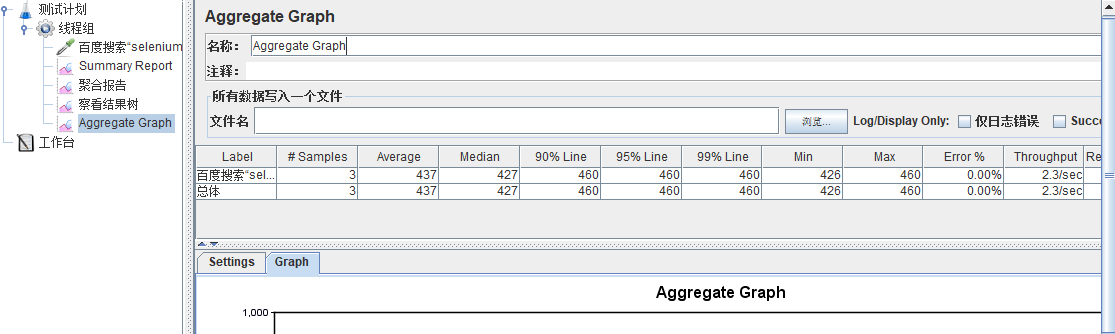
Aggregate Graph
Generally, it is not used much, and there is still a certain gap between the efficiency of the chart and LoadRunner.
Jmeter also has the same graphics monitoring extension as Loadrunner
Jmeter's pain points
1. Graphics monitoring is inferior to Loadrunner
2. Can I monitor Windows or Linux? Just like Loadrunner.
Extension
- Download plugins-manager.jar and put it in the lib / ext directory, then restart JMeter
- Download address: https://jmeter-plugins.org/downloads/old/
- We need to copy the files under the serverAgent directory to the server we are testing, and then click open
On (this is my local computer. Just open this application system directly on this computer. Its default port is 4444) - Download address: https://jmeter-plugins.org/wiki/PerfMonAgent/ The link address has expired
Baidu cloud disk link: http://pan.baidu.com/s/1skZS0Zb Password: isu5
Jmeterplugins standard and jmeterplugins extras are the plug-ins of the client, and ServerAgent is the plug-in of the server.
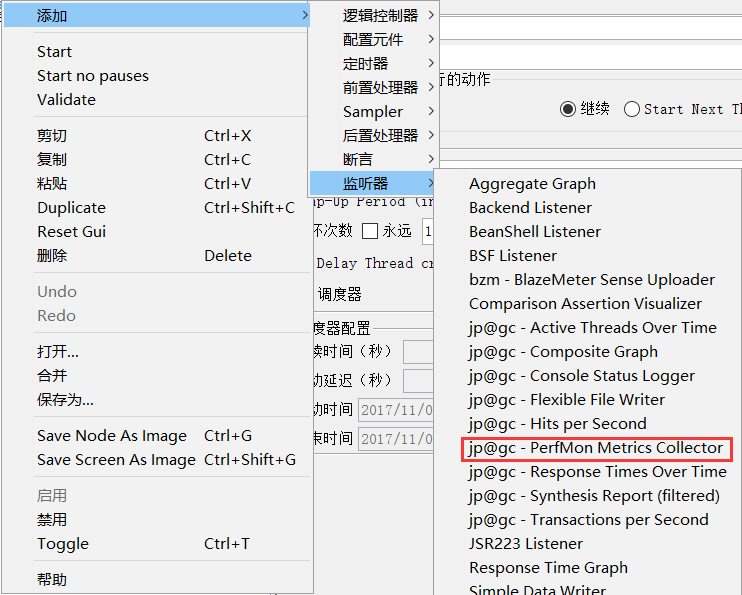
After downloading successfully, copy JmeterPlugins-Extras.jar and JmeterPlugins-Standard.jar, put them in lib/ext in jmeter installation file, restart jmeter, and you can see the monitor plug-in. As shown below:
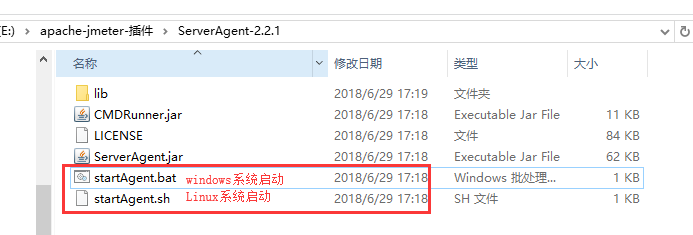
Upload ServerAgent-2.2.1.jar to the tested server, unzip it, enter the directory, Windows environment, and double-click
Start ServerAgent.bat; The linux environment starts with ServerAgent.sh, and port 4444 is used by default.
As shown in the figure below, the server configuration is successful:
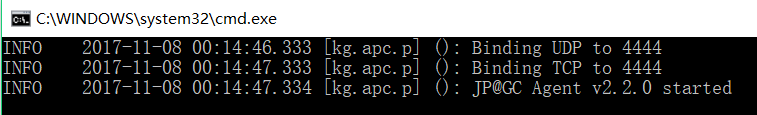
- Server start verification
- CMD enters the command box and observes whether a message has been received. If yes, it indicates that the ServerAgent has been started successfully.
- Client monitoring test
- Add to test script jp@gc -Perfmon metrics collector listener, add the option of server resources to be monitored, and start the script to see the curve change of resource use in the listener interface. As shown in the figure below:
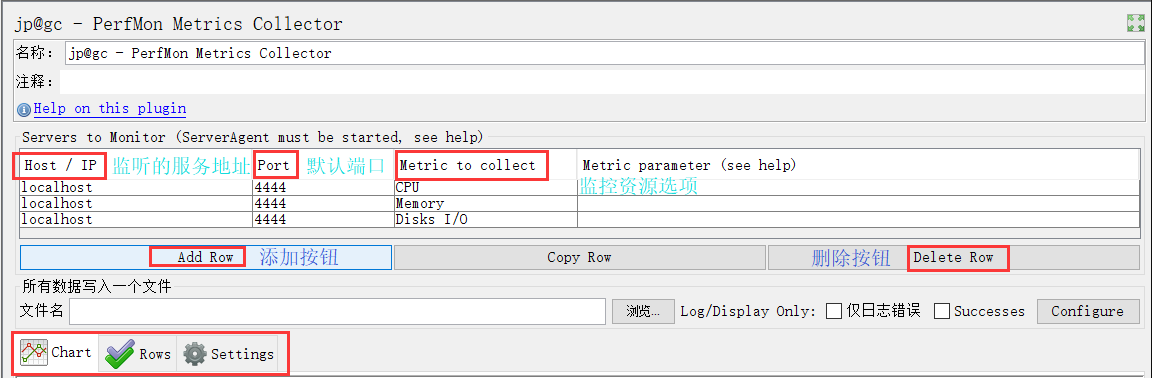
After the script is started, you can see the curve change of server resource use from the interface. Chart represents the display of the main interface, Rows represents the colors represented by the small interface and different resource curves, and Settings represents Settings. You can choose your own configuration.
PerfMon Metrics Collector
Server performance monitoring data collector. During the performance test, in addition to monitoring TPS and TRT, it is also necessary to monitor the resource usage of the server, such as CPU, memory, I/O, etc. The plug-in can monitor the use of various resources of the server in real time during the performance test.
Refer to the above "client listening test" for usage methods
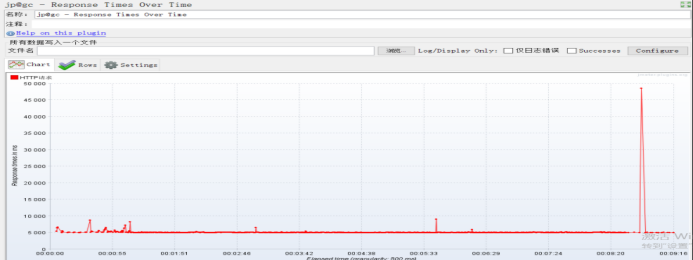
Response Times Over Time
TRT: transaction response time, the other of the two most important indicators in performance testing. The main function of the plug-in is to monitor and view the real-time average value of response time and the trend of overall response time during the execution of test scripts.
The usage method is as above. After downloading, installing and configuring the plug-in, restart jmeter and add the monitor to see the real-time TRT value and overall performance in real time.
TRT change diagram of a pressure test:
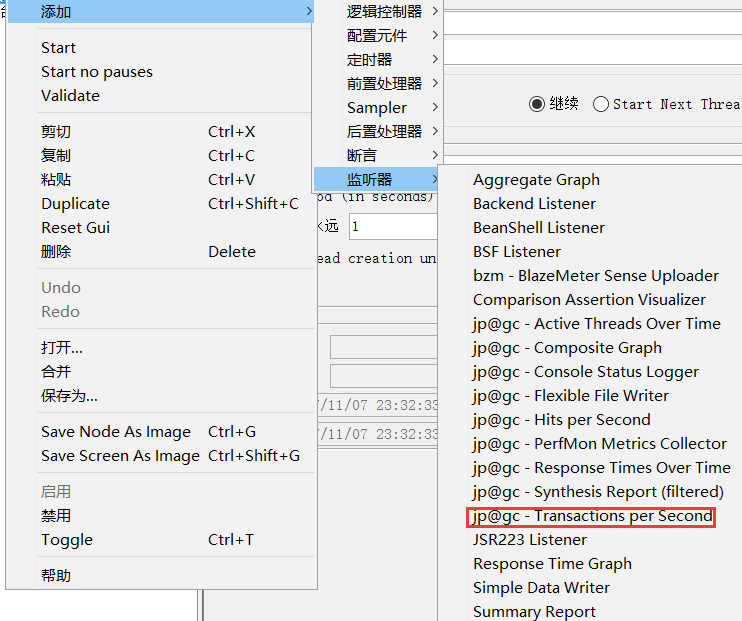
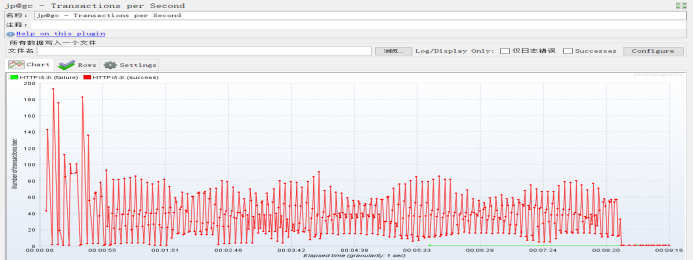
Transactions per Second
TPS: the number of transactions per second, one of the two most important indicators in the performance test. The plug-in is used to monitor and view the TPS performance of the server during the execution of the test script, such as JU
TPS change diagram of a pressure test:
Hits per Second
Click through rate
During performance testing, it is not recommended to add too many listeners when the concurrency is too high
There will be problems. After all, Jmeter needs to read the file.
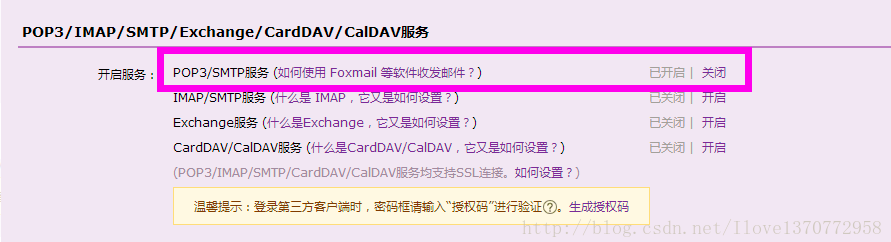
Mail viewer
Start pop3/smtp service in QQ/163 mailbox and generate authorization code for standby
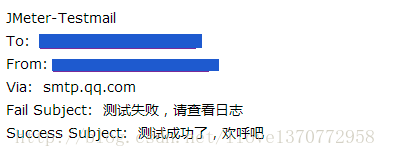
Add a mail viewer in jmeter and configure it as follows
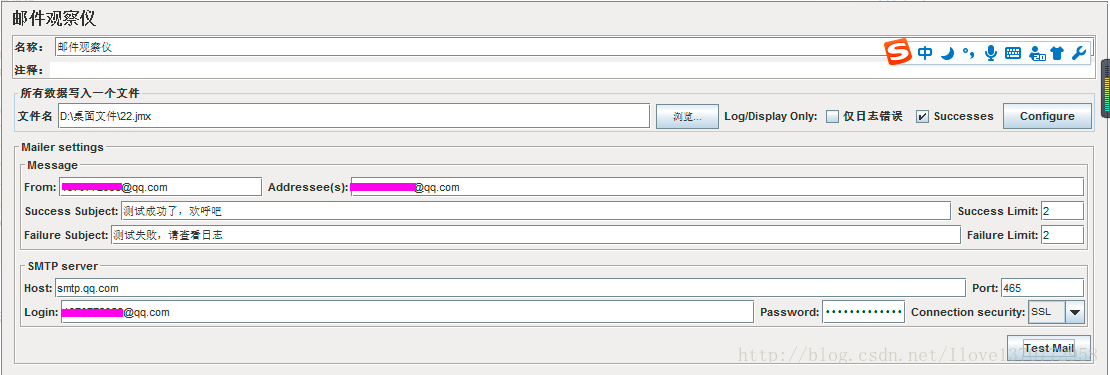
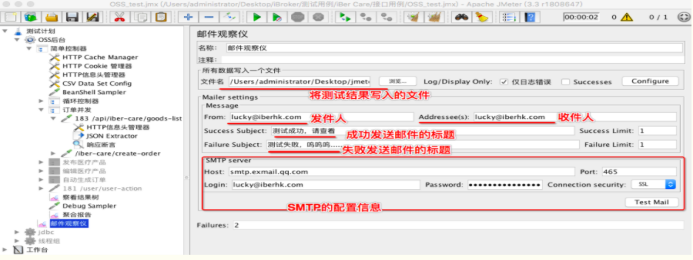
Description information:
1,File name: you only need to give the path and the name of the saved file. After it is given, the data of the test results will be written to the file
  Note: it will not send this file as an attachment in the mail, but write the test results to the specified directory file. If you run the script,
     Open this file directly in this path to see the running results

2,Address(s): Recipients. When adding multiple recipient mailboxes, the middle is separated by commas,
   For example: lucky@iberhk.com,bob@iberhk.com

3,Success Limit And Failure Limit: When the number of successes and failures is equal, send the email. If I write 1, I will be notified by email after 1 failure

4,SMTP The configuration of the is shown below
SMTP Configuration of
  Important information:
    HOST: smtp.exmail.qq.com
    Port: 465
    Login: Log in to your mailbox and fill in your own mailbox
    Password: 16 Bit authorization password
    Connection Security: Be sure to choose SSL
How to obtain the authorization code Baidu.
Click test mail to receive the mail in the corresponding mailbox
During the test, you need to configure the value of success limit failure limit