The original text was posted on the TesterHome forum by xinxi, Original link
background
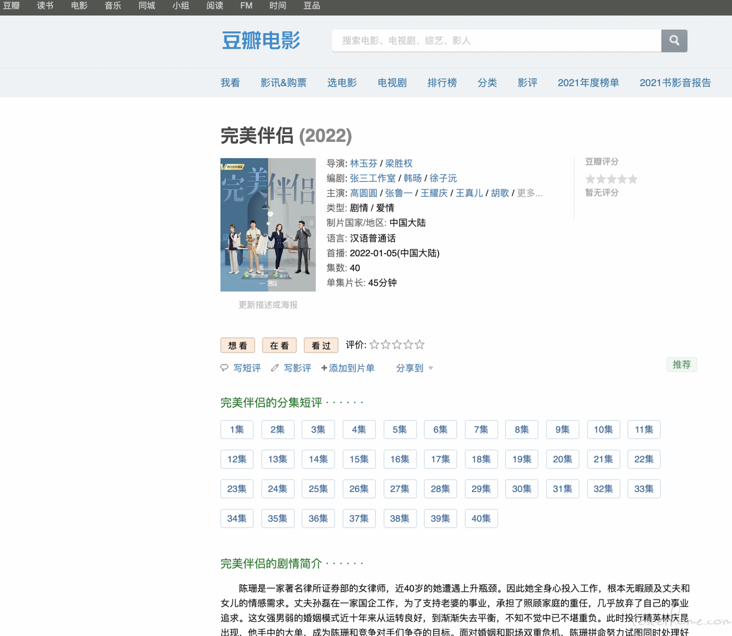
During the Spring Festival holiday, I chased a TV series "perfect partner", starring the goddess "Gao Yuanyuan". There are about 45 episodes. I feel that the overall plot is OK, and the acting skills and appearance of the goddess are still online
General plot introduction:
Chen Shan is a female lawyer in the Securities Department of a famous law firm. At the age of nearly 40, she has encountered a bottleneck in her rise. Therefore, she devoted herself to her work and had no time to take into account the emotional needs of her husband and daughter.
Her husband sun Lei worked in a state-owned enterprise. In order to support his wife's career, he undertook the important task of taking care of his family and almost gave up his career pursuit. Over the past decade, the marriage model of strong women and weak men has been running well and gradually out of balance. Unconsciously, it has been overwhelmed. At this time, investment banking elite Lin Qingkun appeared, and the big order in his hand became the target of Chen Shan and his competitors.
Facing the dual crisis of marriage and workplace, Chen Shan tried hard to deal with both at the same time, but it was more and more counterproductive. After many tests, sun Lei and Chen Shan,
Finally, it is found that their original heart for each other is still there. As long as they cherish and support each other, they are the most perfect partners for each other.
At that time, the play was also very bloody in some places, including praise and scolding. I want to analyze a wave through the comments of netizens.
data sources
You can find thousands of comments on Douban. It should be enough to climb down
Douban address
https://movie.douban.com/subj...
View request
Take a look at the data interface and data format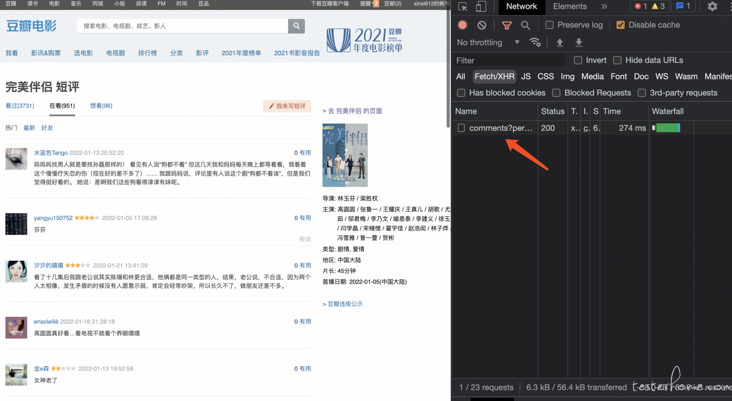
data format
On the h5 page, a comment is composed of avatar, score and comment.
When viewing the returned data, it does not return a standard kv structure data, but a lump of html structure, and then the front end will render it.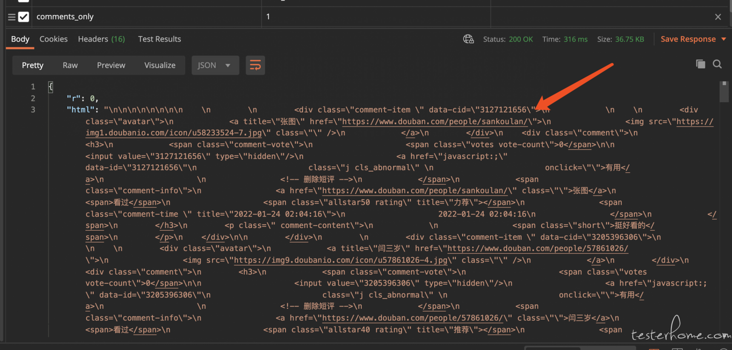
Copy curl
The purpose of copying curl is to facilitate debugging scripts through postman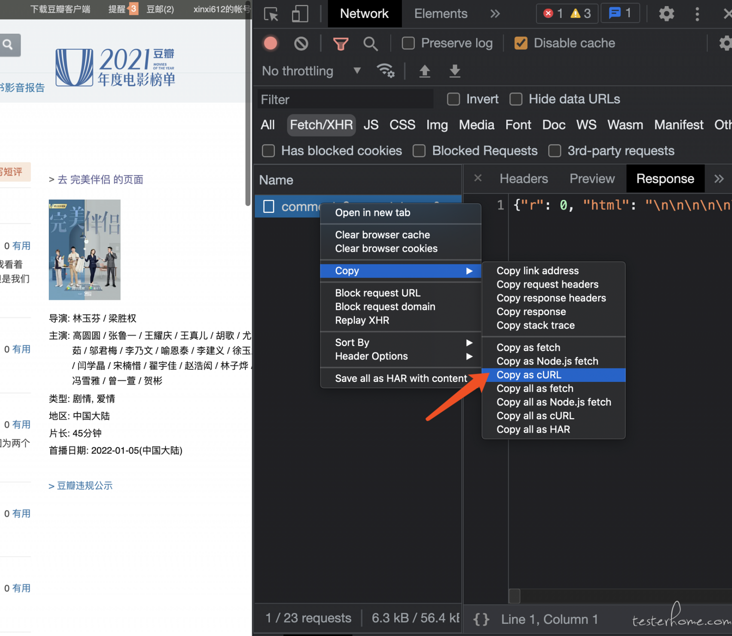
Using header
Reuse header header to get data in script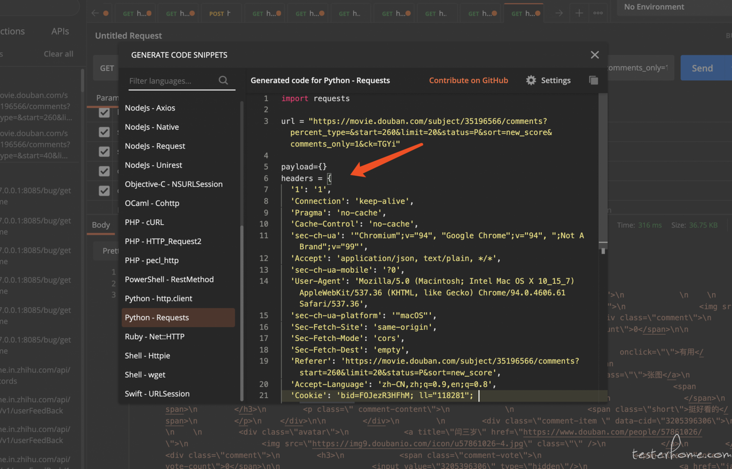
Scripting
Dependency Library
source: https://pypi.doubanio.com/simple

pip3 install jieba (participle)
pip3 install httpx (Send network request)
pip3 install logzero (journal)
pip3 install beautifulsoup4 (analysis html)
pip3 install wordcloud (Generate word cloud)
pip3 install pyecharts (Generate chart)
Get comments circularly, query the data by the number of start s, get the corresponding span tag data through BeautifulSoup, and finally get class="short" is the comment
@staticmethod
def get_info_by_comments():
    """
    Get comments
    :return:
    """
    Page_INDEX = 0
    START_INDEX = 0
    IS_RUNNING = True
    while IS_RUNNING:
        url = HOST + "/subject/35196566/comments?percent_type=&start={}&limit=20&status=P&sort=new_score&comments_only=1".format(
            START_INDEX)
        START_INDEX = START_INDEX + 20
        Page_INDEX = Page_INDEX + 1
        logger.info(url)
        r = httpx.get(url, headers=headers, timeout=10)
        if 'html' in r.text:
            html = r.json()['html']
            soup = BeautifulSoup(html, 'html.parser')
            for k in soup.find_all('span'):
                if 'class="short"' in str(k):
                    comment = str(k.string).encode()
                    CommentsList.append(comment)
                    write_content_to_file(FilePath, comment, is_cover=False)
                    write_content_to_file(FilePath, "\n".encode(), is_cover=False)
            time.sleep(1)
        else:
            IS_RUNNING = False
Get comments
Use the script to save the comments offline in the local file for subsequent analysis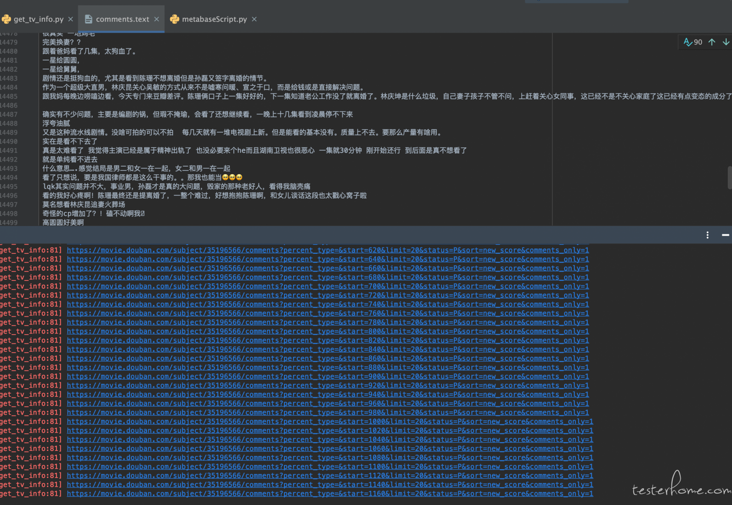
Word cloud generated from comments
Generate word cloud script
with open(CommentsFilePath, 'r') as f:
    r_info = f.readlines()

sentence = ''.join(r_info)
# Use jieba to segment sentences
font_path = "/System/Library/fonts/PingFang.ttc"
word = jieba.cut(sentence)
words = " ".join(word)
# Generate the nd array of the picture and pass in the picture path
im = imageio.imread('test.jpeg')
wc = wordcloud.WordCloud(width=600, height=800, background_color='white', font_path=font_path, mask=im,
                         contour_width=1, contour_color='black')
wc.generate(words)
wc.to_file('wc.png')
jieba will be used here for word segmentation. wordcloud generates word cloud by the number of words after segmentation
Get score
I also want to see how the scores are distributed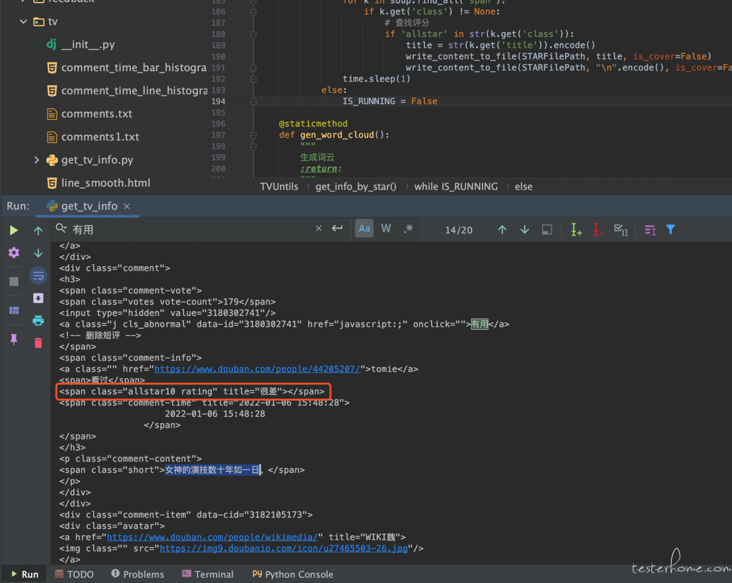
The script to get the score is as follows:
if 'html' in r.text:
    html = r.json()['html']
    soup = BeautifulSoup(html, 'html.parser')
    for k in soup.find_all('span'):
        if k.get('class') != None:
            # Find score
            if 'allstar' in str(k.get('class')):
                title = str(k.get('title')).encode()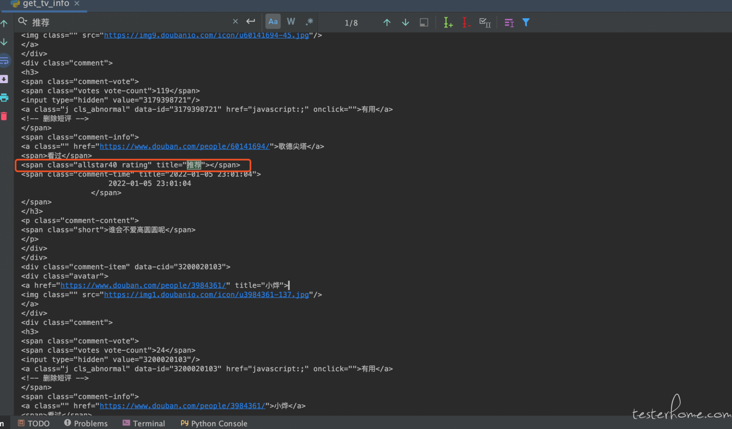
Generate scoring pie chart through pyechards
with open(STARFilePath, 'r') as f:
    r_info = f.readlines()

JIAOCHA = 0
HAIXING = 0
TUIJIAN = 0
HENCHA = 0
LIJIAN = 0
QITA = 0

for i in r_info:
    STAR = i.replace("\n", "")
    if STAR == "Poor":
        JIAOCHA = JIAOCHA + 1
    elif STAR == "it 's not bad":
        HAIXING = HAIXING + 1
    elif STAR == "recommend":
        TUIJIAN = TUIJIAN + 1
    elif STAR == "Very bad":
        HENCHA = HENCHA + 1
    elif STAR == "recommend strongly":
        LIJIAN = LIJIAN + 1
    else:
        QITA = QITA + 1
pie = (
    Pie()
        .add("", [('Very bad', HENCHA), ('Poor', JIAOCHA), ('it 's not bad', HAIXING), ('recommend', TUIJIAN), ('recommend strongly', LIJIAN)])
        .set_global_opts(title_opts=opts.TitleOpts(title="Score distribution"))
        .set_series_opts(label_opts=opts.LabelOpts(formatter='{b}:{d}%'))
)

pie.render(path=RootPath + "/star_pie.html")
pie.render()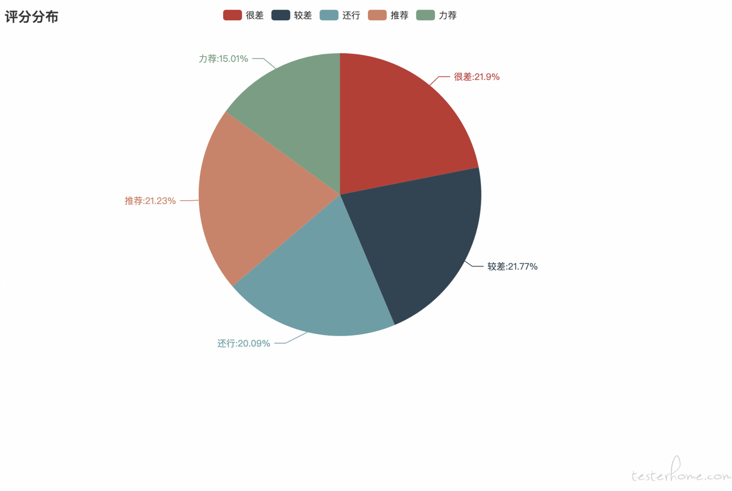
Get comment time and generate chart
I also want to see the time period of netizens' comments, according to the hour dimension
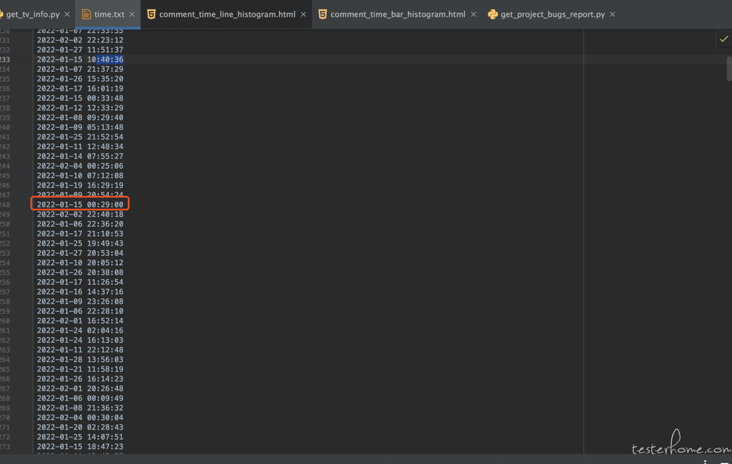
The data obtained is to seconds, and the time processing is as follows:
1. Filter by hour
2. Sorted by time
comment_time_list = []
with open(TIMEFilePath, 'r') as f:
    r_info = f.readlines()
for i in r_info:
    comment_time = i.replace("\n", "").split(":")[0] + ":00:00"  # Filter by hour
    comment_time_list.append(comment_time)

comment_dict = {}
comment_dict_list = []
for i in comment_time_list:
    if i not in comment_dict.keys():
        comment_dict[i] = comment_time_list.count(i)

for k in comment_dict:
    comment_dict_list.append({"time": k, "value": comment_dict[k]})

comment_dict_list.sort(key=lambda k: (k.get('time', 0)))
# print(comment_dict_list) # Sorted by time
time_list = []
value_list = []
for c in comment_dict_list:
    time_list.append(c['time'])
    value_list.append(c['value'])

c = (
    Bar(init_opts=opts.InitOpts(width="1600px", height="800px"))
        .add_xaxis(time_list)
        .add_yaxis("quantity", value_list, category_gap=0, color=Faker.rand_color())
        .set_global_opts(title_opts=opts.TitleOpts(title="Comment time-histogram"),
                         xaxis_opts=opts.AxisOpts(name="Submission time", axislabel_opts={"rotate": 45}))
        .render("comment_time_bar_histogram.html")

        )
The line chart has no smooth curve set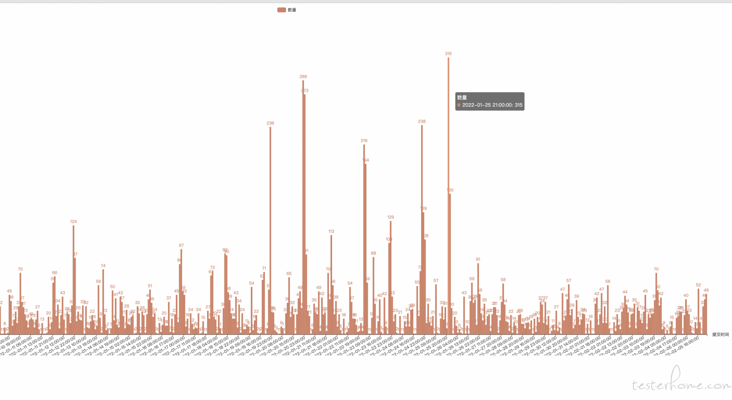
Line chart and set smooth curve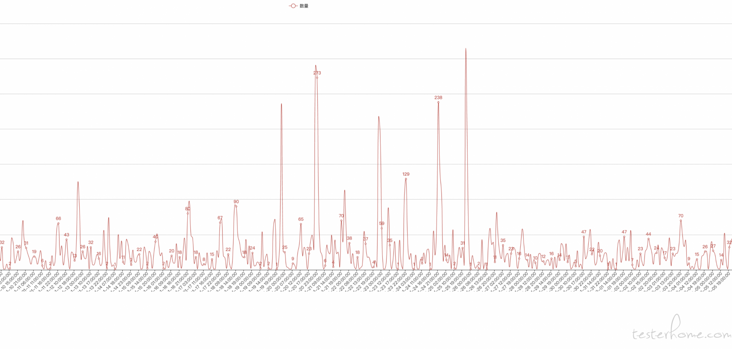
Get the most words
Also want to see what are the "most words"
1. Use jieba for word segmentation
2. Filtered modal particle
Including modal particles, which is not accurate. Some words have no meaning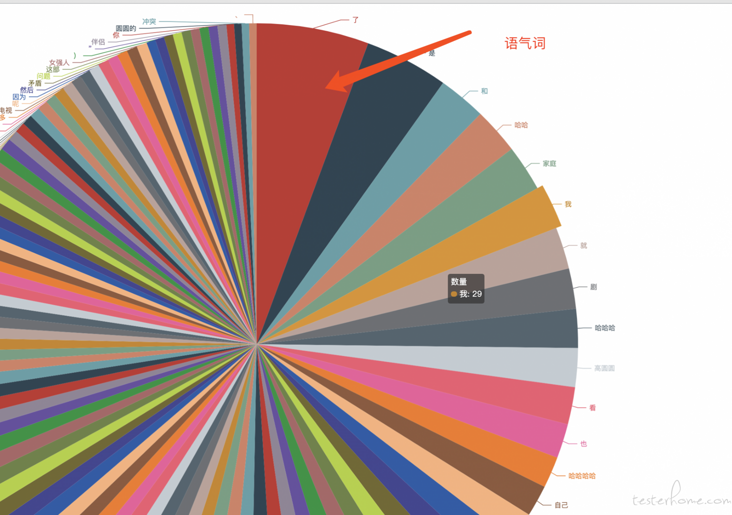
Remove modal particles and filter some commonly used modal particles
import jieba

def stopwordslist():
    """
    Create a stop word list
    :return:
    """
    stopwords = [line.strip() for line in open('chinese_stopword.txt', encoding='UTF-8').readlines()]
    return stopwords

def seg_depart(sentence):
    """
    Chinese word segmentation of sentences
    :param sentence:
    :return:
    """
    print("Participle in progress")
    out_str_list = []
    sentence_depart = jieba.cut(sentence.strip())
    stopwords = stopwordslist()
    outstr = ''
    # De stop word
    for word in sentence_depart:
        if word not in stopwords:
            if word != '\t':
                outstr += word
                outstr += " "
                out_str_list.append(word)
    return out_str_list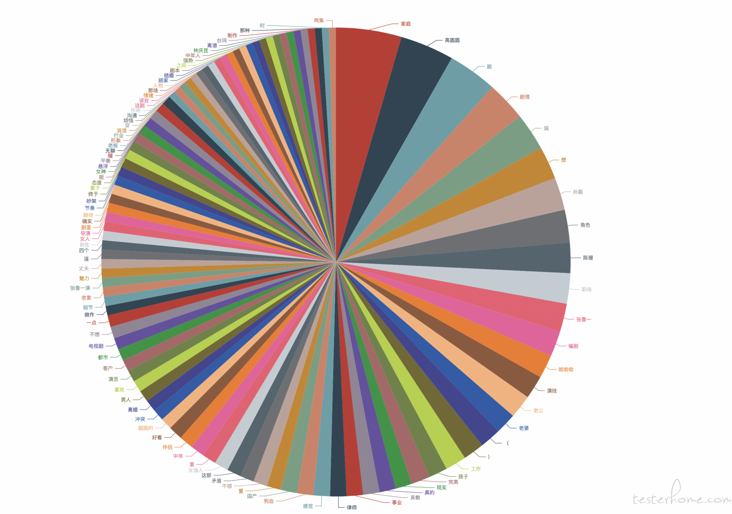
last
Through the analysis of a TV drama review, we can get:
1. python Network Request exercise
2. python common data structure exercises
3. Chart Library of python
4. Common algorithm exercises
Finally, after recommending this play, the male host 35 + gives up his career for his wife's career, takes care of his children, and balances family and career
The word "family" appears most in the last pie chart, which is associated with the high pressure of our internet work and often work overtime and ignore the company of our family
I wish you all work overtime and spend more time with your family~