Someone at the interface came to me and said that there was a stored procedure that couldn't run and tried to report errors several times.
ORA-12801: Error signal in parallel query server p001, instance xx
 ORA-04030: Insufficient process memory when attempting to allocate 16328 bytes (xxxx)
It also monitors the receipt of spatially increasing SMS alerts (dozens of GB core files are generated in the oracle root directory). The alertlog content is as follows:
Errors in file /oracle/db/diag/rdbms/almdb/almdb1/trace/almdb1_ora_61429.trc  (incident=261961):
ORA-07445: Exceptional error occurred: Core Dump [kxsGetFullSqlText()+74] [SIGSEGV] [ADDR:0x0] [PC:0x220C50C] [SI_KERNEL(general_protection)] []
ORA-07445: Exceptional error occurred: Core Dump [_wordcopy_fwd_dest_aligned()+189] [SIGSEGV] [ADDR:0x7F5B36F83000] [PC:0x3787A89D1D] [Invalid permissions for mapped object] []
Incident details in: /oracle/db/diag/rdbms/almdb/almdb1/incident/incdir_261961/almdb1_ora_61429_i261961.trc
Use ADRCI or Support Workbench to package the incident.
See Note 411.1 at My Oracle Support for error and packaging details.
Exception [type: SIGSEGV, SI_KERNEL(general_protection)] [ADDR:0x0] [PC:0x4C45B18, ksxplstdmp()+424] [flags: 0x0, count: 3]
Exception [type: SIGSEGV, SI_KERNEL(general_protection)] [ADDR:0x0] [PC:0x2D7BEEF, kghstack_err()+113] [flags: 0x2, count: 4]
Exception [type: SIGSEGV, SI_KERNEL(general_protection)] [ADDR:0x0] [PC:0x2D7BEEF, kghstack_err()+113] [flags: 0x2, count: 4]
Exception [type: SIGSEGV, SI_KERNEL(general_protection)] [ADDR:0x0] [PC:0x2D7BEEF, kghstack_err()+113] [flags: 0x2, count: 4]
Exception [type: SIGSEGV, SI_KERNEL(general_protection)] [ADDR:0x0] [PC:0x2D7BEEF, kghstack_err()+113] [flags: 0x2, count: 4]
Questions causing errors SQL has been positioned to:
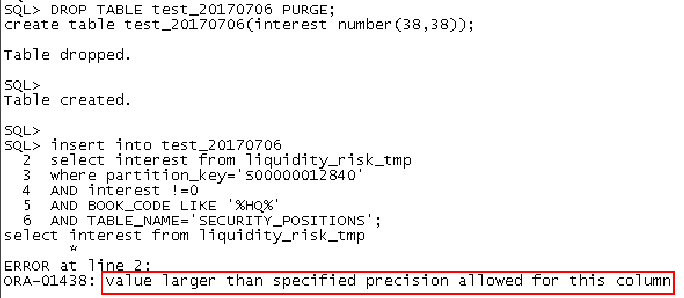
They have tried to modify the configuration parameters, and the error is still reported.insert /*+ append */ into xxxxx partition(PS00000012840) (50 Multiple columns) select 50 Multiple columns from table(pack_lr.lr_f(pack_install.get_reporting_da te, cursor (50 Multiple columns from xxxxx_tmp where (nominal != 0 or interest != 0))))
ALTER SYSTEM SET pga_aggregate_target='25G' SCOPE=BOTH SID='almdb1';
ALTER SYSTEM SET _pga_max_size='6442450944' SCOPE=BOTH SID='almdb1';
ALTER SYSTEM SET shadow_core_dump='NONE' SCOPE=SPFILE SID='*';
----------------------------------------------------------------------------------------------------------------------------------------------
Combined with the above, the only available information is this SQL. Looking at SQL and PLAN is no problem. The key to locating the problem is to narrow the scope of the error.
1. Check whether insert or select causes problems
Select comes out and runs, and the error is still reported. So the problem is on the select side [narrowing down]
2. The only condition of SQL is nominal!= 0 or interest!= 0. By trying to reserve only one condition, the condition for the problem is interest!= 0 [scope narrowing]
Start to analyze SQL.
ALTER SYSTEM SET pga_aggregate_target='25G' SCOPE=BOTH SID='almdb1';
ALTER SYSTEM SET _pga_max_size='6442450944' SCOPE=BOTH SID='almdb1';
ALTER SYSTEM SET shadow_core_dump='NONE' SCOPE=SPFILE SID='*';
3. The SQL statement itself is not complicated, but there is a func in it. Take the func code out (the code is very complex, only a part of the code is intercepted)
function lr_f(v_reporting_date date, the_cursor pack_lr.lr_in_cursor)
	return t_lr_out_table
	parallel_enable (
	partition the_cursor by hash(
		50 Multiple columns
	)
)	order the_cursor by (
	50 Multiple columns
)
pipelined
is ......
This is a product they bought in their project. The only thing that can be optimized in the product code is to get rid of hash, order by, which consumes pga, and try it. Wrong reporting
4. View the execution plan of SQL. In fact, I started to understand that there was not much valuable information in the plan. Just because when I first learned about their products, I realized a function <automatically locate the full table scan in a partition for partition clipping> to see if the execution plan implemented the function according to the principle of the product: I found that there was only table access full in the execution plan, but no PARTITION RANGE/LIST SINGLE about partition.
At this point, we still firmly believe that the performance problem is caused by the amount of data, and the amount of data in a single partition is quite different from that in a whole table. So modify the code decisively so that it scans only a single partition. Wrong reporting
Iterative analysis - ---------------------------------------------------------------------------------------------------------------------------
5. Comparing with the past: common means of performance analysis
Today and yesterday (normal), all-round comparison, the only difference is that there are more than 20w (total 600w) data. Is this 20w the bottleneck of code processing?
To test my hypothesis, I made a rewrite, dividing the table into multiple tables according to an organization code field, and then looping them one by one. The amount of data processed by the code at one time is reduced from 600 to 30 W lines.
This not only solves the problem of data quantity, but also optimizes the code from the point of view of sub-table. Then the miracle didn't happen, and the program reported an error again when it went through a small table.
At this point, we can basically eliminate the problem of data quantity, which may be the problem of data itself.
6. Next, reduce the problematic data to 10,000 rows through several dimensions in the table
Analysis of Data Problem
7. Time field is most likely to have problems. First, check whether the time field has data before 1900.
8. Query the max(length) of each field to verify whether there is an overlength of the field and the storage of the hypercursor.
There is no problem with time and character type queries. There are only 12 numbered fields left, and interest!= 0 is also numbered.
In fact, there are few errors in the number type, so we can imagine the workload of checking one by one from the 10,000 lines. In fact, we can give up.
But I'm not willing to think that I've been holding on for so long...
Because the condition in the SQL statement is interest!= 0, so make a bold guess, it is this field, caused, so in the survey, priority only to see this field.
Eventually, a miracle happened...
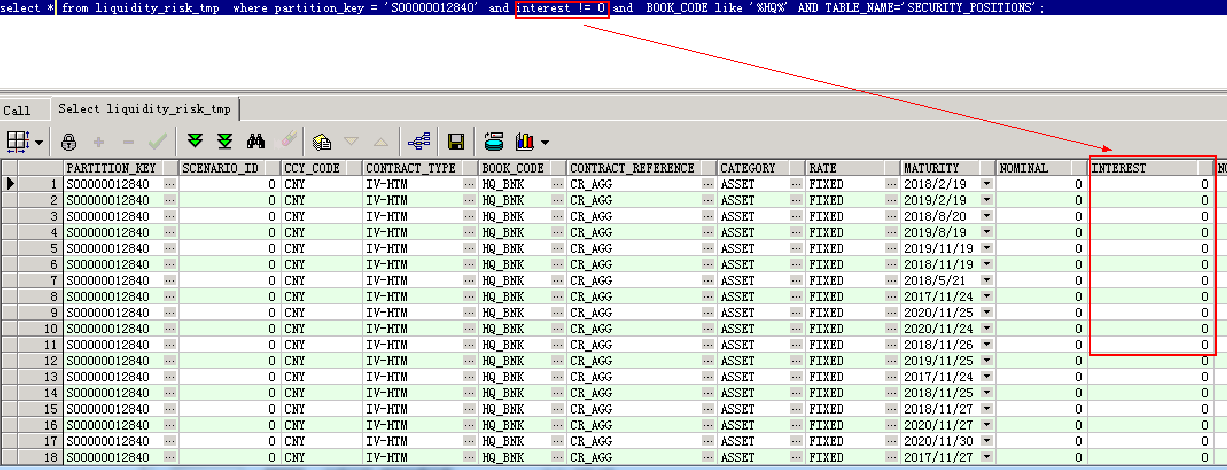
The so-called miracle is this strange phenomenon in the picture.
------------------------------------------------------------------------------------------------------------------------------------------------
9. Set up the preferances in plsql dev to check number fields to char to run SQL and run SQL in SQL*plus. The results are blank.
Why does the blank appear as 0 - ----------------------------------------------------------------------------------------------------------------------------------
10. Check the SQL condition interest is null or interest =''without any results. So the value in the interest field is neither zero nor empty, is it an infinite number close to zero? If you filter out this part of the number, will the program be able to run through it?
Problem solving - -----------------------------------------------------------------------------------------------------------------------------
11. Change the above analysis interest!= 0 condition to interest > 1 or interest <-1 program passed smoothly - ---> In order to reduce program differences, finally change to interest > 0.1 or interest < 0 error perfect solution.
----------------------------------------------------------------------------------------------------------------------------------------------------
So we did the following two experiments
Experiment 1:
It is concluded that there is an overly long number type in the interset field.
Experiment 2:
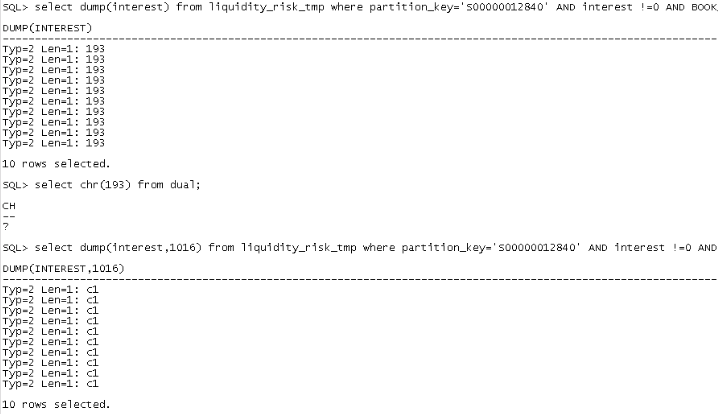
Take out the dump value of the field value, and I can't interpret the dump either.