Analysis of the top 100 crawlers of China's third-order cube speed blindness
1, Topic background
Rubik's cube, also known as Rubik's cube, was first invented by Professor El Rubik of Budapest Institute of architecture in Hungary in 1974. WCA(World Cube Association) holds various Rubik's cube competitions all over the world every year. In November 1991, China's first domestic Rubik's cube competition was held in Guangzhou. In January 2004, Chinese players participated in the world Rubik's Cube Association competition for the first time. In May 2009, Chinese players broke the world record in the official competition for the first time. In June 2014, cuping China was officially launched, which played a key role in the development of domestic Rubik's cube cause, Now the Chinese have also made excellent achievements in the third-order magic cube. This course will make crawler analysis on the data of the top 100 of the third-order magic cube speed screw and blind screw of the rough cake web.

2, Thematic web crawler design
1. Topic crawler name
Rough cake · China Rubik's cube tournament website China third-order Rubik's cube single speed blind top 100 crawler analysis
2. Content and data feature analysis of topic web crawler
The ranking, name, region, score, competition, date and year data of the top 100 single speed screwing and blind screwing of China's third-order magic cube are analyzed.
Data source: https://cubing.com/ (data as of December 27, 2021)
3. Overview of thematic web crawler design scheme
(1) implementation ideas
Through the analysis of the rough cake web page, we use the Requests crawler library and beautiful soup library to climb to the top 100 ranking, name, region, score, competition, date and year of China's third-order magic cube in a single quick twist and blind twist, and then save it as csv file, and finally visual analysis.
(2) technical difficulties
For some difficulties in crawling data, difficulties are encountered in data visual analysis using Matplotlib and pyechards.
3, Analysis on the structural characteristics of theme pages
1. Structure and feature analysis of theme page
Screenshot of relevant pages to be crawled
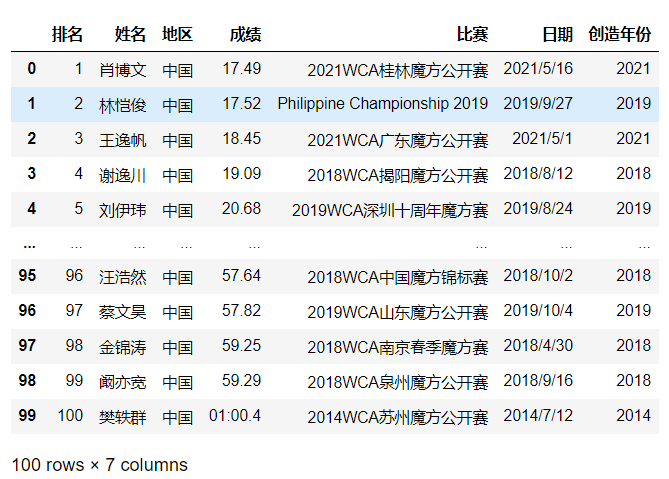
Top 100 of level 3 single score (screenshot only shows part)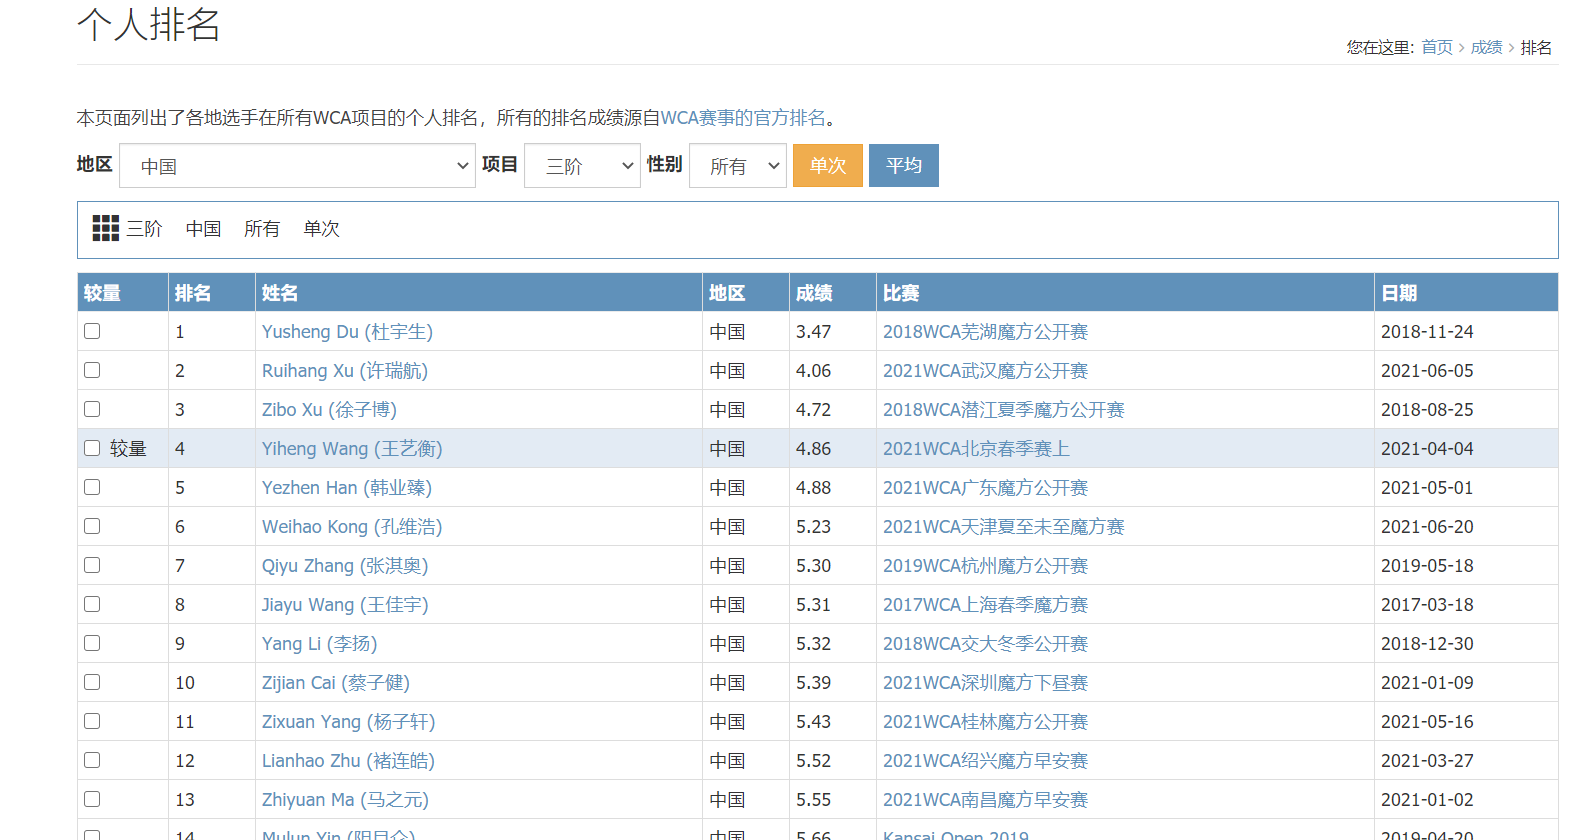
Top 100 scores of third-order single blind screwing (screenshot only shows part)
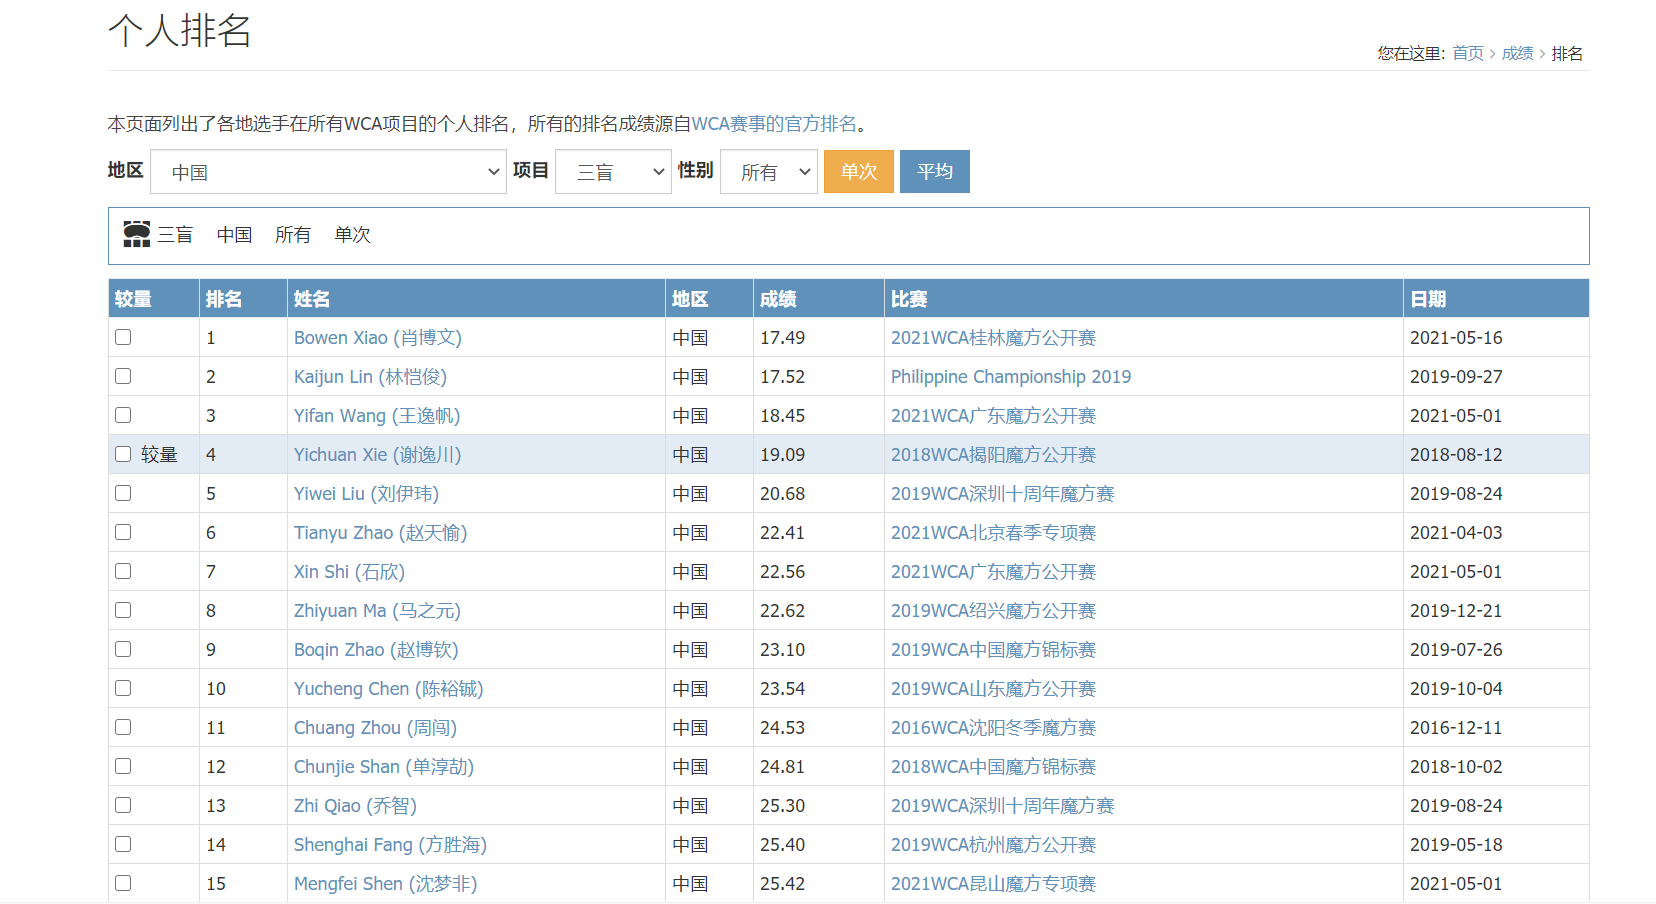
The data we need to crawl is shown in the figure.
2. HTML page parsing
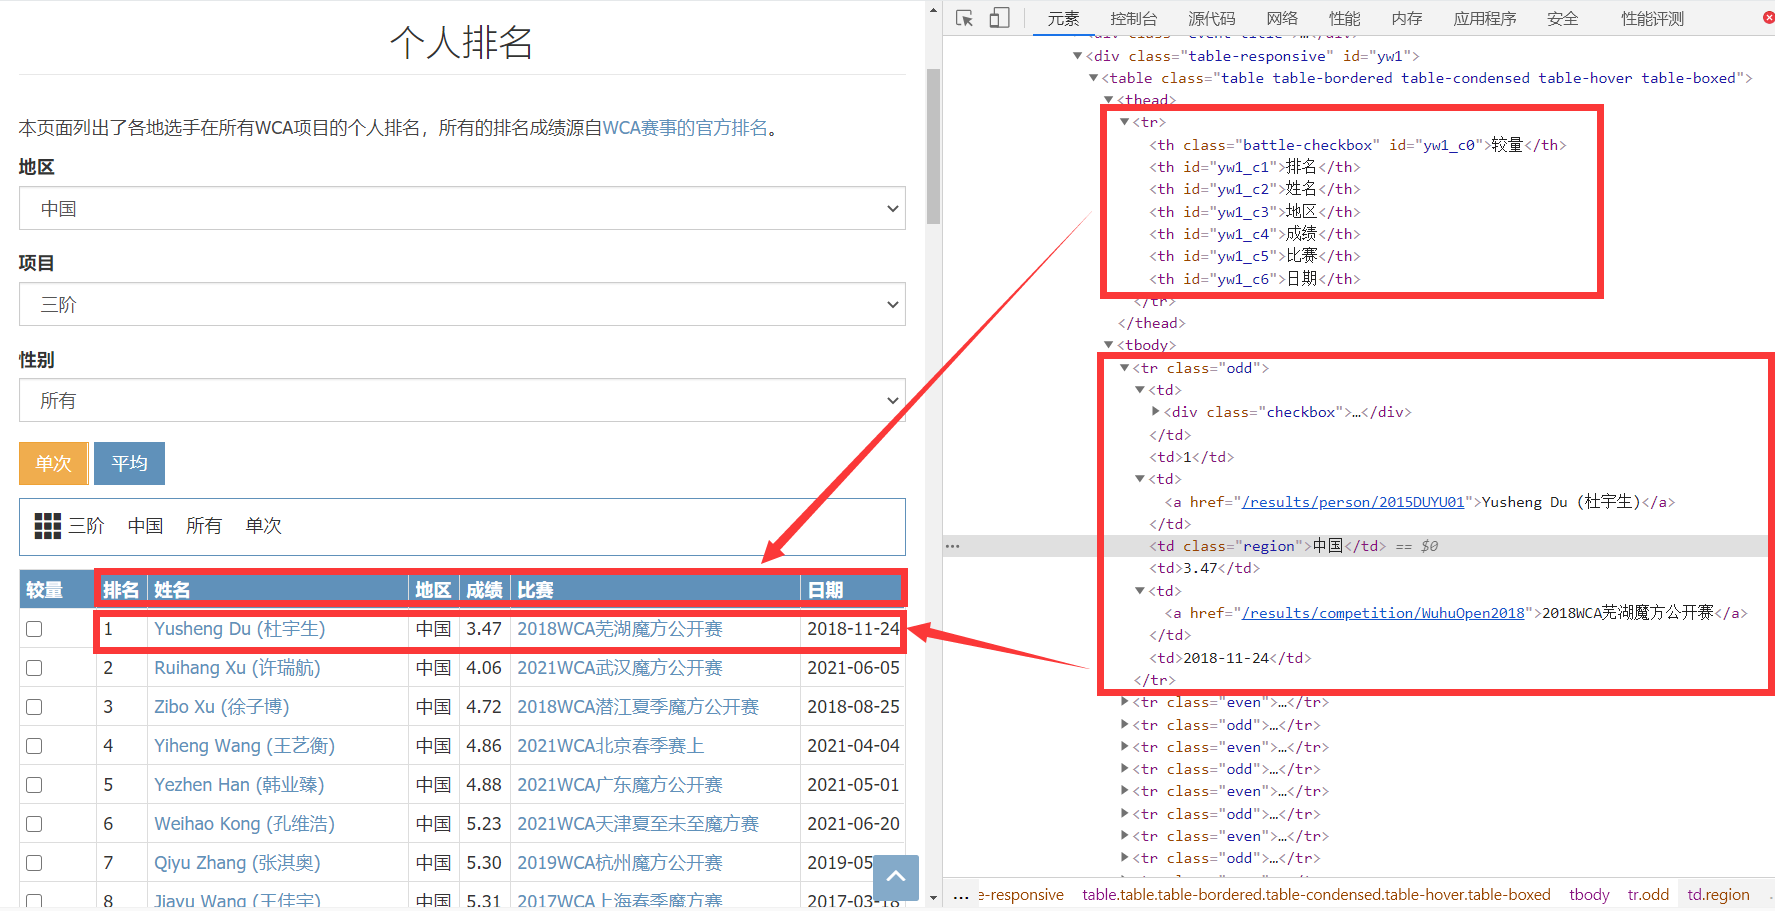
Through the observation and analysis of page review elements, we can know that the data we need to crawl is in the div tag under the body tag (the same is true for the single data of third-order blind screwing)
3. Node (label) search method and traversal method
Find and traverse nodes (labels) through the for loop.
4, Web crawler programming
1. Data crawling and acquisition
 1 #Import the library we need#
 2 import requests
 3 from bs4 import BeautifulSoup
 4 import csv
 5 main_url = 'https://cubingchina.com'
 6 def get_html(url):
 7 #according to url Return the corresponding html object#
 8 #Write request header#
 9     headers = {'User-Agent': 'Mozilla/5.0 (Windows NT 10.0; WOW64) AppleWebKit/537.36 (KHTML, like Gecko) Chrome/86.0.4240.198 Safari/537.36'}
10     response = requests.get(url, headers=headers)
11     response.encoding='utf-8-sig'
12     html = response.text
13     return html
14 def get_soup(html):
15 #according to HTML return beautifulsoup object#
16     soup = BeautifulSoup(html, 'lxml')
17     return soup
18 def get_rank_list(soup):
19 #use beautifulsoup Analyze the web page, obtain the player information, and return the player information list#
20     rank_text_list = soup.find('table', {'class': 'table table-bordered table-condensed table-hover table-boxed'})
21     rank_text_list = rank_text_list.find_all('tr')[1:]
22     rank_list = []
23     for rank_text in rank_text_list:
24         rank_text = rank_text.find_all('td')
25         rank = rank_text[1].extract().text
26         name = rank_text[2].extract().text
27         region = rank_text[3].extract().text
28         result = rank_text[4].extract().text
29         competitive = rank_text[5].extract().text
30         date = rank_text[6].extract().text
31         item = (rank, name, region, result, competitive, date)
32         rank_list.append(item)
33     return rank_list
34 def writer_file(rank_list, flag=''):
35 #Write the data of the third-order quick tightening csv file#
36     header = ('ranking', 'full name','region', 'achievement', 'match', 'date')
37     with open('333_single_china.csv', 'a',encoding='utf-8-sig',newline='') as file:
38         writer = csv.writer(file)
39         if flag == 'first':
40             writer.writerow(header)
41         for rank in rank_list:
42             writer.writerow(rank)
43 def main():
44     start_url = 'https://cubing.com/results/rankings'
45     html = get_html(start_url)
46     soup = get_soup(html)
47     # Write third-order single ranking to file#
48     rank_list = get_rank_list(soup)
49     writer_file(rank_list, 'first')
50     print('The third-order single speed screw ranking data has been successfully crawled and saved!')
51 if __name__=="__main__":
52     main()
53 def writer_file(rank_list, flag=''):
54 #Write the data of the third-order blind screw csv file#
55     header = ('ranking', 'full name','region', 'achievement', 'match', 'date')
56     with open('333bf_single_china.csv', 'a',encoding='utf-8-sig',newline='') as file:
57         writer = csv.writer(file)
58         if flag == 'first':
59             writer.writerow(header)
60         for rank in rank_list:
61             writer.writerow(rank)
62 def main():
63     start_url = 'https://cubing.com/results/rankings?region=China&event=333bf&gender=all&type=single'
64     html = get_html(start_url)
65     soup = get_soup(html)
66     # Third order blind write file#
67     rank_list = get_rank_list(soup)
68     writer_file(rank_list, 'first')
69     print('Third order blind twist single ranking data crawling succeeded, saved!')
70 if __name__=="__main__":
71     main()
Operation results:

The saved csv files are as follows

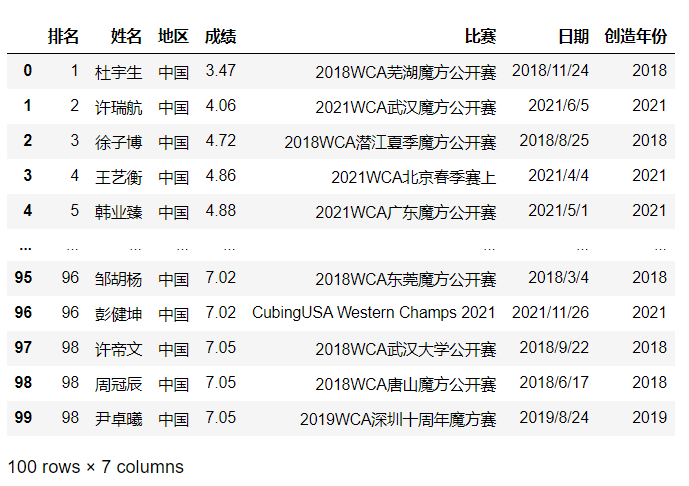
1 #Import the data of the top 100 ranking of China in a single time#
2 import pandas as pd
3 df=pd.DataFrame(pd.read_csv('C:\\Users\\Lenovo\\Desktop\\Chinese third-order cube data\\333_single_china.csv'))
4 df
Operation results:
1 #Import the data of the top 100 ranking in China for a single time#
2 import pandas as pd
3 df2=pd.DataFrame(pd.read_csv('C:\\Users\\Lenovo\\Desktop\\Chinese third-order cube data\\333bf_single_china.csv'))
4 df2
Operation results:
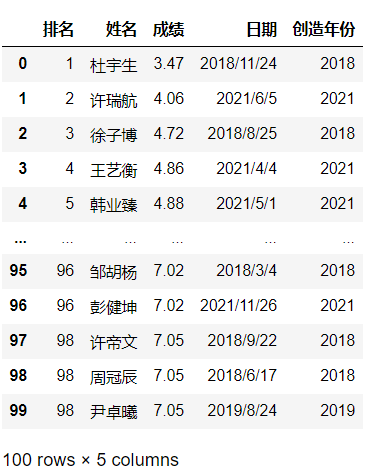
1 #Delete the rows and columns we don't need in the third-order quick twist single ranking data#
2 df.drop('match',axis=1,inplace=True)
3 df
4 df.drop('region',axis=1,inplace=True)
5 df
Operation results:
1 #Delete the rows and columns we don't need in the third-order single blind ranking#
2 df2.drop('match',axis=1,inplace=True)
3 df2
4 df2.drop('region',axis=1,inplace=True)
5 df2
Operation results:

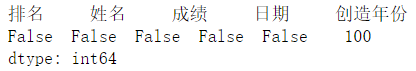
1 # Check whether there is a null value in the data, and return if there is a null value True,No null value returned False#
2 df.isnull().value_counts()
Operation results:
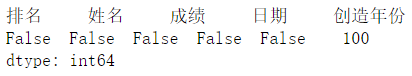
1 df2.isnull().value_counts()
Operation results:
1 # Check whether there are duplicate rows in the crawled data, and return if there are duplicate rows True,No duplicate rows returned False#
2 df.duplicated()
Operation results:
1 df2.duplicated()
Operation results:
3. Data analysis and visualization
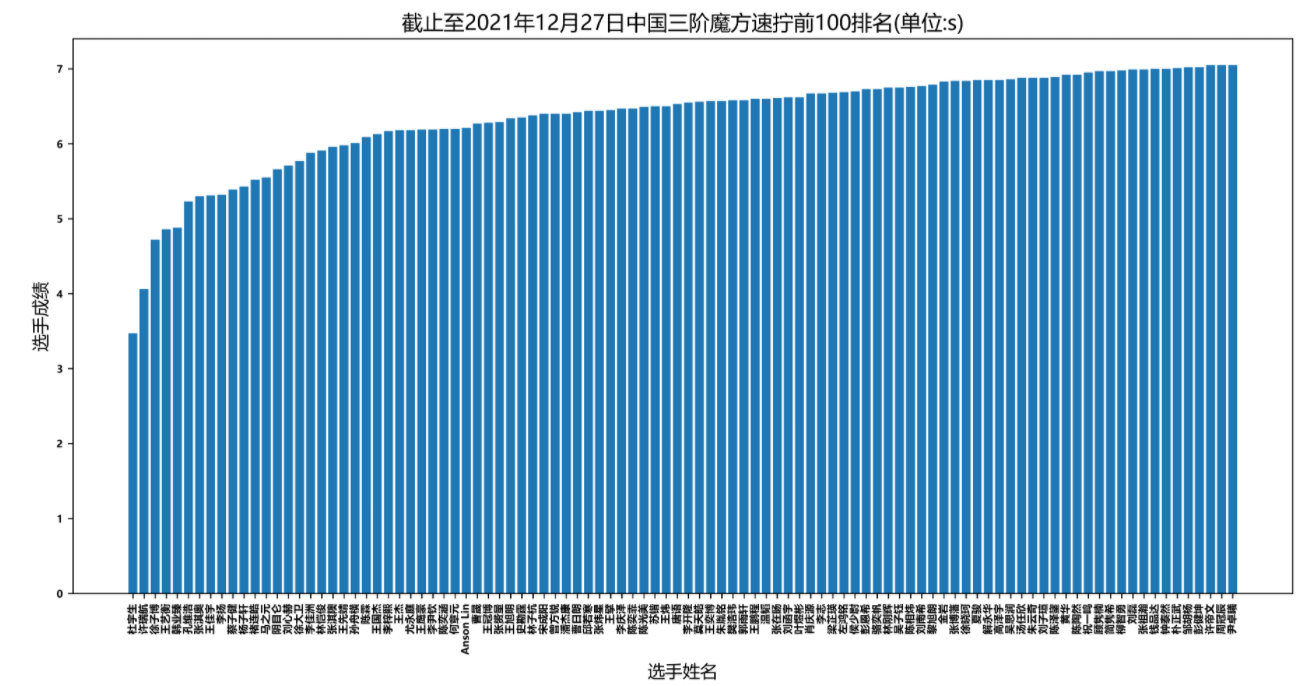
 1 #utilize Matplotlib Draw the top 100 ranking histogram of China's third-order magic cube by December 27, 2021#
 2 #Import library#
 3 import pandas as pd
 4 import matplotlib
 5 import matplotlib.pyplot as plt
 6 plt.figure(figsize=(15, 7),dpi=600)
 7 # Solve Chinese and minus sign display problems#
 8 plt.rcParams['font.sans-serif']=['SimHei']
 9 plt.rcParams['axes.unicode_minus'] = False
10 #Read the first 100 data of Chinese third-order Rubik's cube in a single quick twist csv file#
11 df = pd.read_csv("C:\\Users\\Lenovo\\Desktop\\Chinese third-order cube data\\333_single_china.csv")
12 #set up x Axis and y Axis display content#
13 plt.bar(df['full name'], df['achievement'])
14 #Set title#
15 plt.title(r'By December 27, 2021, China's top 100 third-order Rubik's Cube(Company:s)')
16 #set up x Axis label#
17 plt.xlabel('Name of contestant')
18 #set up y Axis label#
19 plt.ylabel(r'Player performance')
20 #take x Axis label font adjusted to 7#
21 plt.tick_params(labelsize=7)
22 #take x Axis label font rotates 90 degrees clockwise#
23 plt.xticks(rotation=90)
24 #Data persistence#
25 plt.savefig('By December 27, 2021, China's top 100 third-order Rubik's Cube.jpg')
26 #Display visualization results#
27 plt.show()
Operation results:
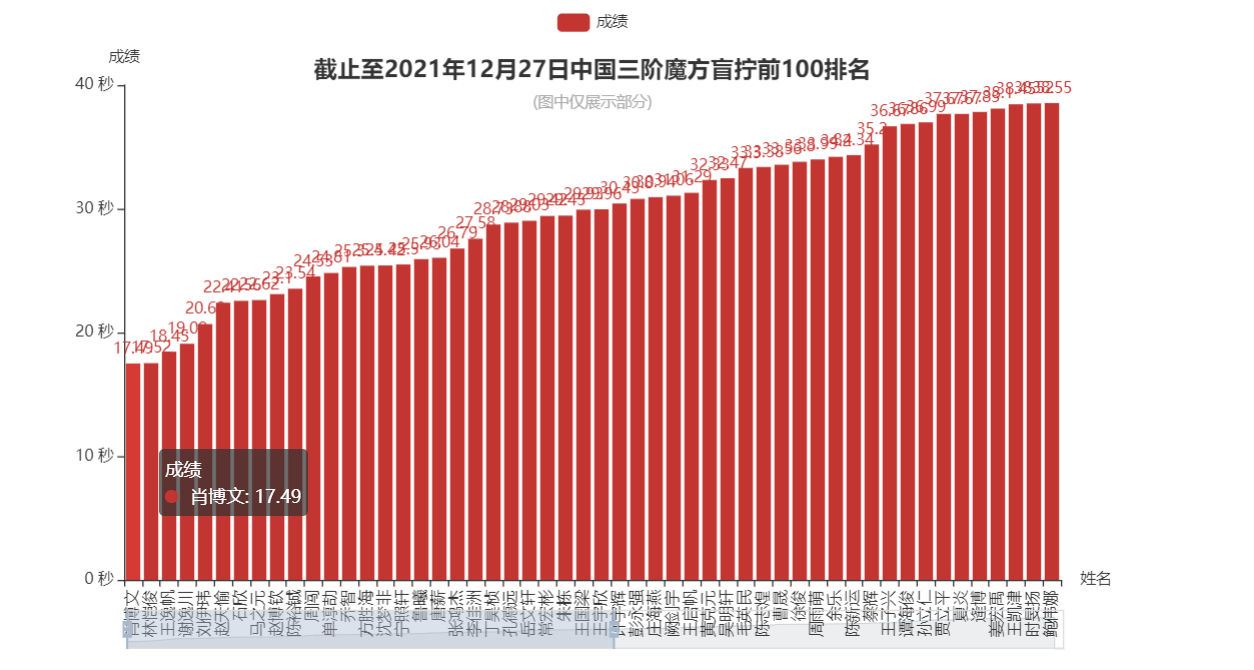
 1 #utilize pyecharts Draw the top 100 ranking histogram of China's third-order magic cube blind twist by December 27, 2021#
 2 #Import library#
 3 import time
 4 import json
 5 import pandas as pd
 6 import numpy as np
 7 from pyecharts import options as opts
 8 data=df2
 9 bar = (
10     Bar()
11     .add_xaxis(df2["full name"].tolist())
12     .add_yaxis("achievement", df2["achievement"].tolist())
13     .set_global_opts(
14         #Setting of drawing title#
15         title_opts=opts.TitleOpts(
16             title="By December 27, 2021, China's top 100 third-order magic cube blind twist",
17             subtitle="(Only part is shown in the figure)",
18             pos_left="center",
19             pos_top="7%"),
20          #'shadow': Shadow indicator#
21         tooltip_opts=opts.TooltipOpts(
22             is_show=True,
23             trigger="axis",
24             axis_pointer_type="shadow"
25             ),
26         #x Axis coordinate configuration item,x Shaft label, 90 degrees clockwise#
27         xaxis_opts=opts.AxisOpts(name="full name",axislabel_opts={"interval":"0","rotate":90}),
28         #y Axis configuration item#
29         yaxis_opts=opts.AxisOpts(
30             name="achievement",min_=0,
31             type_="value",axislabel_opts=opts.LabelOpts(formatter="{value} second"),),
32         #Area scaling configuration item#
33         datazoom_opts=opts.DataZoomOpts(range_start=0,range_end=10),
34     )
35 )
36 bar.render_notebook()
Operation results:
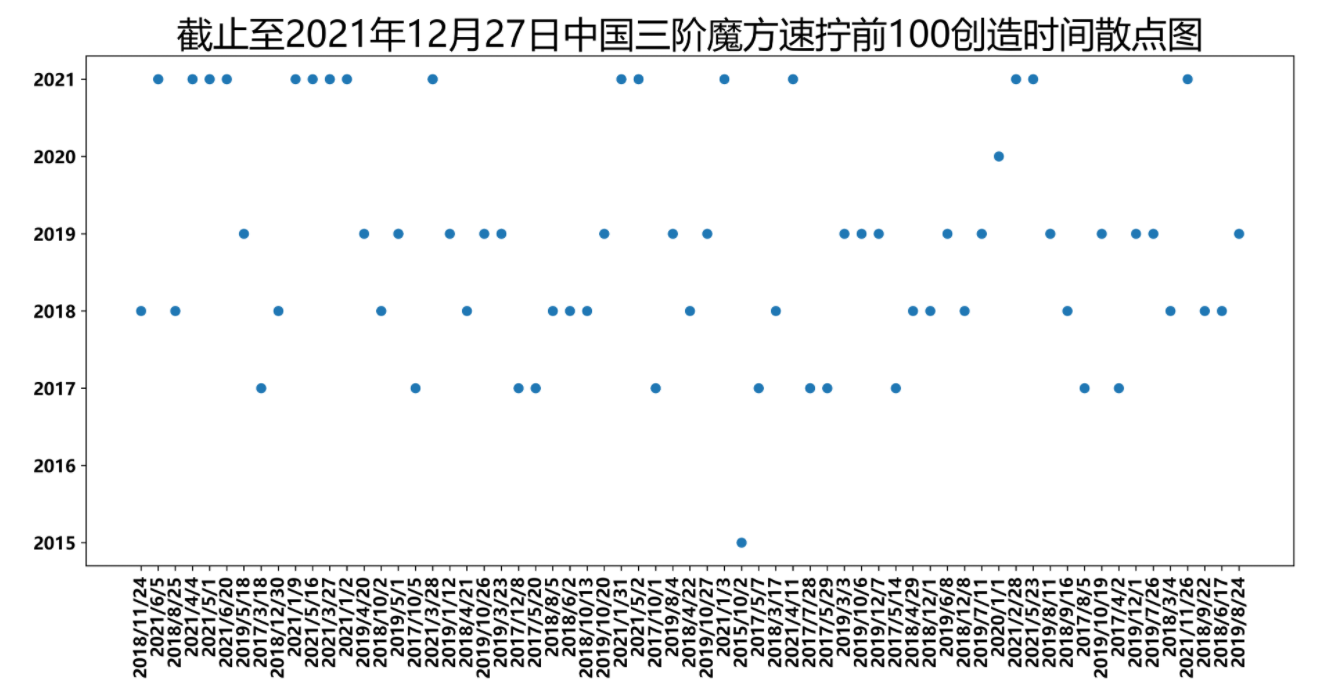
 1 #utilize Matplotlib Draw the scatter chart of the creation time of the top 100 of China's third-order magic cube by December 27, 2021#
 2 import pandas as pd
 3 import matplotlib.pyplot as plt
 4 plt.figure(figsize=(15, 6.5),dpi=600)
 5 plt.title('As of December 27, 2021, China's top 100 creation time scatter chart of third-order magic cube',size=25,color="black")
 6 #Draw a scatter diagram#
 7 plt.scatter(df['date'], df['Year of creation'])
 8 plt.xticks(rotation=90)
 9 #Data persistence#
10 plt.savefig('As of December 27, 2021, China's top 100 creation time scatter chart of third-order magic cube.jpg')
11 #Display the scatter chart
12 plt.show()
Operation results:
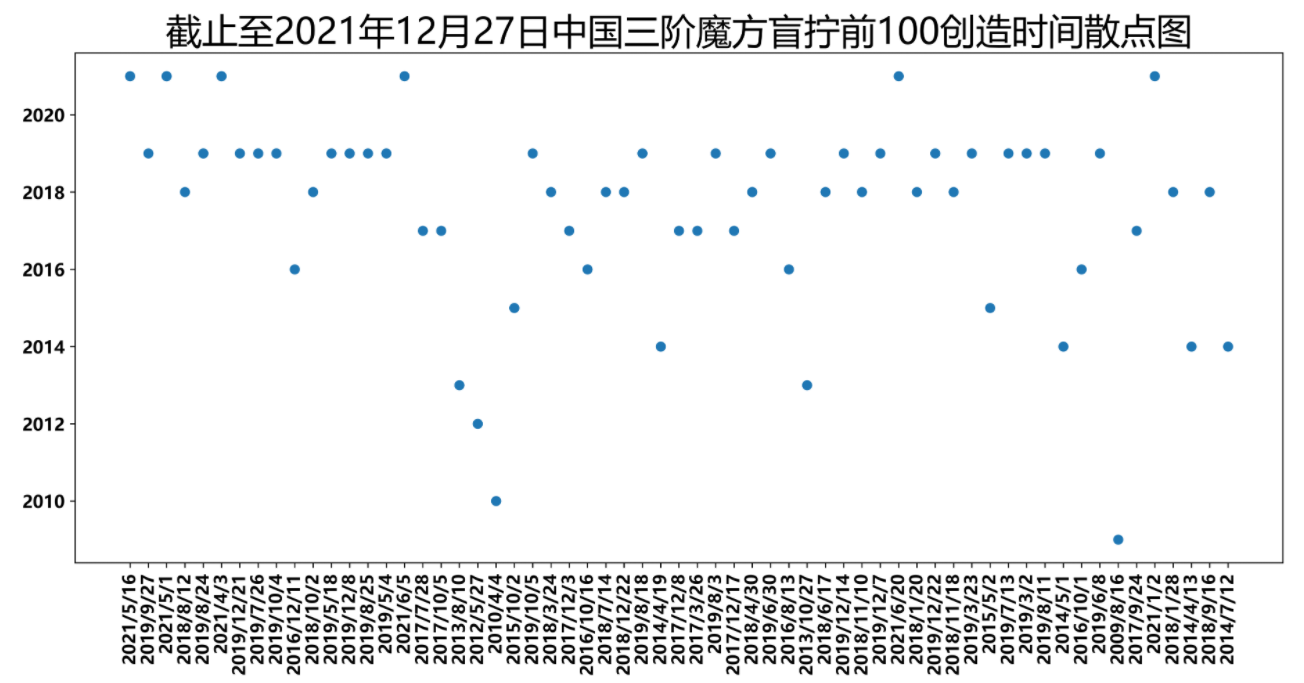
 1 #utilize Matplotlib Draw the scatter chart of the creation time of the first 100 of China's third-order magic cube blind twist by December 27, 2021#
 2 import pandas as pd
 3 import matplotlib.pyplot as plt
 4 plt.figure(figsize=(15, 6.5),dpi=600)
 5 plt.title('As of December 27, 2021, the first 100 creation time scatter of China's third-order magic cube blind twist',size=25,color="black")
 6 #Draw a scatter diagram#
 7 plt.scatter(df2['date'], df2['Year of creation'])
 8 plt.xticks(rotation=90)
 9 #Data persistence#
10 plt.savefig('As of December 27, 2021, the first 100 creation time scatter of China's third-order magic cube blind twist.jpg')
11 #Display the scatter chart
12 plt.show()
Operation results:
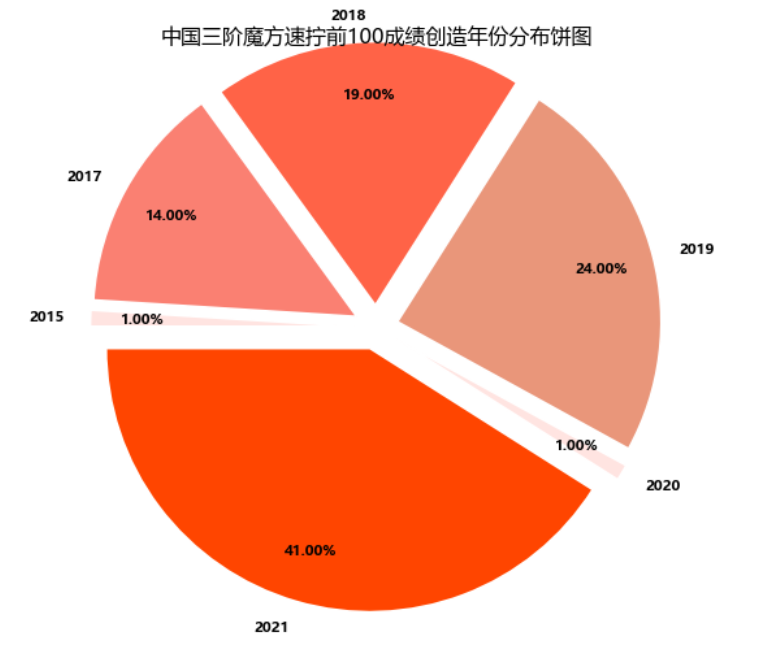
 1 #utilize Matplotlib Draw the time distribution map of the top 100 achievements of China's third-order magic cube by December 27, 2021#
 2 #Import library#
 3 import pandas as pd
 4 import matplotlib
 5 import matplotlib.pyplot as plt
 6 #Set drawing size#
 7 plt.figure(figsize=(15,7),dpi=80)
 8 #Set the display scale of each part#
 9 finance=[len(df[df["Year of creation"]==2015]["Year of creation"]),
10          len(df[df["Year of creation"]==2017]["Year of creation"]),
11          len(df[df["Year of creation"]==2018]["Year of creation"]),
12          len(df[df["Year of creation"]==2019]["Year of creation"]),
13          len(df[df["Year of creation"]==2020]["Year of creation"]),
14          len(df[df["Year of creation"]==2021]["Year of creation"])]
15
16 #Set up Chinese display to solve the problem of garbled code#
17 font = {'family' : 'MicroSoft YaHei',
18         'weight': 'bold',
19         'size': '12'}
20 matplotlib.rc("font",**font)
21 matplotlib.rc("font",
22               family='MicroSoft YaHei',
23               weight="bold")
24 labels = ["2015",
25           "2017",
26           "2018",
27           "2019",
28           "2020",
29           "2021"]
30 explode = [0.1, 0.1, 0.1, 0.1,0.1,0.1]
31 colors = ['mistyrose', 'salmon', 'tomato', 'darksalmon','mistyrose','orangered']
32 #Set pie chart related parameters#
33 plt.pie(finance, explode=explode, labels=labels,
34         colors=colors,autopct='%.2f%%',
35         pctdistance=0.8, labeldistance=1.1,
36         startangle=180,  radius=1.2,
37         counterclock=False,
38         wedgeprops={'linewidth':1.5, 'edgecolor':'white'},
39         textprops={'fontsize':10, 'color':'black'} )
40 #Set title#
41 plt.title('Pie chart of year distribution of top 100 achievements in China's third-order magic cube')
42 #Data persistence#
43 plt.savefig('Pie chart of year distribution of top 100 achievements in China's third-order magic cube.jpg')
44 #Display visual image#
45 plt.show()
Operation results:
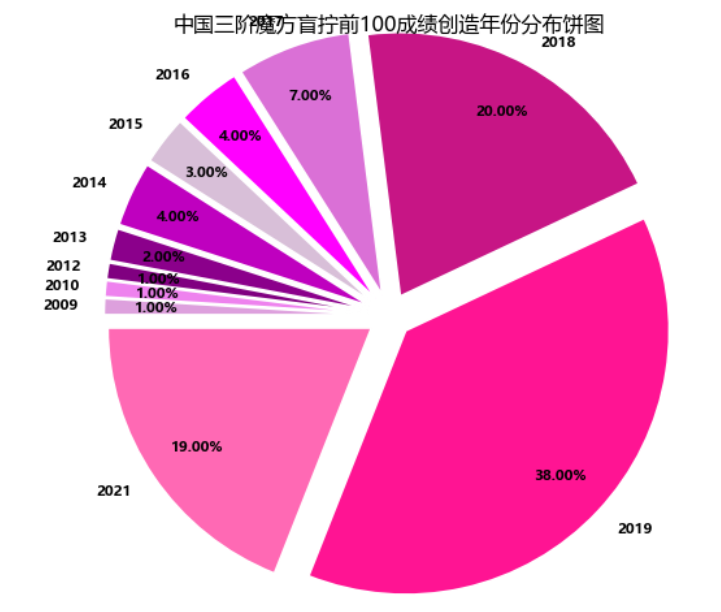
 1 #utilize Matplotlib Draw the time distribution map of the top 100 achievements of China's third-order magic cube blind twist by December 27, 2021#
 2 #Import library#
 3 import pandas as pd
 4 import matplotlib
 5 import matplotlib.pyplot as plt
 6 #Set drawing size#
 7 plt.figure(figsize=(15,7),dpi=80)
 8 #Set the display scale of each part#
 9 finance=[len(df2[df2["Year of creation"]==2009]["Year of creation"]),
10          len(df2[df2["Year of creation"]==2010]["Year of creation"]),
11          len(df2[df2["Year of creation"]==2012]["Year of creation"]),
12          len(df2[df2["Year of creation"]==2013]["Year of creation"]),
13          len(df2[df2["Year of creation"]==2014]["Year of creation"]),
14          len(df2[df2["Year of creation"]==2015]["Year of creation"]),
15          len(df2[df2["Year of creation"]==2016]["Year of creation"]),
16          len(df2[df2["Year of creation"]==2017]["Year of creation"]),
17          len(df2[df2["Year of creation"]==2018]["Year of creation"]),
18          len(df2[df2["Year of creation"]==2019]["Year of creation"]),
19          len(df2[df2["Year of creation"]==2021]["Year of creation"])]
20
21 #Set up Chinese display to solve the problem of garbled code#
22 font = {'family' : 'MicroSoft YaHei',
23         'weight': 'bold',
24         'size': '12'}
25 matplotlib.rc("font",**font)
26 matplotlib.rc("font",
27               family='MicroSoft YaHei',
28               weight="bold")
29 #Set pie chart display#
30 labels = ["2009",
31           "2010",
32           "2012",
33           "2013",
34           "2014",
35           "2015",
36           "2016",
37           "2017",
38           "2018",
39           "2019",
40           "2021"]
41 explode = [0.1, 0.1, 0.1, 0.1,0.1,0.1,0.1, 0.1, 0.1, 0.1,0.1]
42 colors = ['plum', 'violet', 'purple', 'darkmagenta','m','thistle','magenta','orchid','mediumvioletred','deeppink','hotpink']
43 #Set pie chart related parameters#
44 plt.pie(finance, explode=explode, labels=labels,
45         colors=colors,autopct='%.2f%%',
46         pctdistance=0.8, labeldistance=1.1,
47         startangle=180,  radius=1.2,
48         counterclock=False,
49         wedgeprops={'linewidth':1.5, 'edgecolor':'white'},
50         textprops={'fontsize':10, 'color':'black'} )
51 #Set title#
52 plt.title('Pie chart of the year of creation of the top 100 achievements of China's third-order magic cube blind twist')
53 #Data persistence#
54 plt.savefig('Pie chart of year distribution of top 100 achievements of China's third-order blind screw speed.jpg')
55 #Display visual image#
56 plt.show()
Operation results:
4. Data persistence
1 #Data persistence#
2 plt.savefig('By December 27, 2021, China's top 100 third-order Rubik's Cube.jpg')
3 plt.savefig('As of December 27, 2021, China's top 100 creation time scatter chart of third-order magic cube.jpg')
4 plt.savefig('As of December 27, 2021, the first 100 creation time scatter of China's third-order magic cube blind twist.jpg')
5 plt.savefig('Pie chart of year distribution of top 100 achievements in China's third-order magic cube.jpg')
6 plt.savefig('Pie chart of year distribution of top 100 achievements of China's third-order blind screw speed.jpg')
Operation results:

5. Attach the complete code
  1 #Import the library we need#
  2 import requests
  3 from bs4 import BeautifulSoup
  4 import csv
  5 main_url = 'https://cubingchina.com'
  6 def get_html(url):
  7 #according to url Return the corresponding html object#
  8 #Write request header#
  9     headers = {'User-Agent': 'Mozilla/5.0 (Windows NT 10.0; WOW64) AppleWebKit/537.36 (KHTML, like Gecko) Chrome/86.0.4240.198 Safari/537.36'}
 10     response = requests.get(url, headers=headers)
 11     response.encoding='utf-8-sig'
 12     html = response.text
 13     return html
 14 def get_soup(html):
 15 #according to HTML return beautifulsoup object#
 16     soup = BeautifulSoup(html, 'lxml')
 17     return soup
 18 def get_rank_list(soup):
 19 #use beautifulsoup Analyze the web page, obtain the player information, and return the player information list#
 20     rank_text_list = soup.find('table', {'class': 'table table-bordered table-condensed table-hover table-boxed'})
 21     rank_text_list = rank_text_list.find_all('tr')[1:]
 22     rank_list = []
 23     for rank_text in rank_text_list:
 24         rank_text = rank_text.find_all('td')
 25         rank = rank_text[1].extract().text
 26         name = rank_text[2].extract().text
 27         region = rank_text[3].extract().text
 28         result = rank_text[4].extract().text
 29         competitive = rank_text[5].extract().text
 30         date = rank_text[6].extract().text
 31         item = (rank, name, region, result, competitive, date)
 32         rank_list.append(item)
 33     return rank_list
 34 def writer_file(rank_list, flag=''):
 35 #Write the data of the third-order quick tightening csv file#
 36     header = ('ranking', 'full name','region', 'achievement', 'match', 'date')
 37     with open('333_single_china.csv', 'a',encoding='utf-8-sig',newline='') as file:
 38         writer = csv.writer(file)
 39         if flag == 'first':
 40             writer.writerow(header)
 41         for rank in rank_list:
 42             writer.writerow(rank)
 43 def main():
 44     start_url = 'https://cubing.com/results/rankings'
 45     html = get_html(start_url)
 46     soup = get_soup(html)
 47     # Write third-order single ranking to file#
 48     rank_list = get_rank_list(soup)
 49     writer_file(rank_list, 'first')
 50     print('The third-order single speed screw ranking data has been successfully crawled and saved!')
 51 if __name__=="__main__":
 52     main()
 53 def writer_file(rank_list, flag=''):
 54 #Write the data of the third-order blind screw csv file#
 55     header = ('ranking', 'full name','region', 'achievement', 'match', 'date')
 56     with open('333bf_single_china.csv', 'a',encoding='utf-8-sig',newline='') as file:
 57         writer = csv.writer(file)
 58         if flag == 'first':
 59             writer.writerow(header)
 60         for rank in rank_list:
 61             writer.writerow(rank)
 62 def main():
 63     start_url = 'https://cubing.com/results/rankings?region=China&event=333bf&gender=all&type=single'
 64     html = get_html(start_url)
 65     soup = get_soup(html)
 66     # Third order blind write file#
 67     rank_list = get_rank_list(soup)
 68     writer_file(rank_list, 'first')
 69     print('Third order blind twist single ranking data crawling succeeded, saved!')
 70 if __name__=="__main__":
 71     main()
 72
 73 #utilize Matplotlib Draw the top 100 ranking histogram of China's third-order magic cube by December 27, 2021#
 74 #Import library#
 75 import pandas as pd
 76 import matplotlib
 77 import matplotlib.pyplot as plt
 78 plt.figure(figsize=(15, 7),dpi=600)
 79
 80 # Solve Chinese and minus sign display problems#
 81 plt.rcParams['font.sans-serif']=['SimHei']
 82 plt.rcParams['axes.unicode_minus'] = False
 83
 84 #Read the first 100 data of Chinese third-order Rubik's cube in a single quick twist csv file#
 85 df = pd.read_csv("C:\\Users\\Lenovo\\Desktop\\Chinese third-order cube data\\333_single_china.csv")
 86
 87 #set up x Axis and y Axis display content#
 88 plt.bar(df['full name'], df['achievement'])
 89
 90 #Set title#
 91 plt.title(r'By December 27, 2021, China's top 100 third-order Rubik's Cube(Company:s)')
 92
 93 #set up x Axis label#
 94 plt.xlabel('Name of contestant')
 95
 96 #set up y Axis label#
 97 plt.ylabel(r'Player performance')
 98
 99 #take x Axis label font adjusted to 7#
100 plt.tick_params(labelsize=7)
101
102 #take x Axis label font rotates 90 degrees clockwise#
103 plt.xticks(rotation=90)
104
105 #Data persistence#
106 plt.savefig('By December 27, 2021, China's top 100 third-order Rubik's Cube.jpg')
107
108 #Display visualization results#
109 plt.show()
110
111 #utilize pyecharts Draw the top 100 ranking histogram of China's third-order magic cube blind twist by December 27, 2021#
112 #Import library#
113 import time
114 import json
115 import pandas as pd
116 import numpy as np
117 from pyecharts import options as opts
118
119 bar = (
120     Bar()
121     .add_xaxis(df2["full name"].tolist())
122     .add_yaxis("achievement", df2["achievement"].tolist())
123     .set_global_opts(
124         #Setting of drawing title#
125         title_opts=opts.TitleOpts(
126             title="By December 27, 2021, China's top 100 third-order magic cube blind twist",
127             subtitle="(Only part is shown in the figure)",
128             pos_left="center",
129             pos_top="7%"),
130          #'shadow': Shadow indicator#
131         tooltip_opts=opts.TooltipOpts(
132             is_show=True,
133             trigger="axis",
134             axis_pointer_type="shadow"
135             ),
136         #x Axis coordinate configuration item,x Shaft label, 90 degrees clockwise#
137         xaxis_opts=opts.AxisOpts(name="full name",axislabel_opts={"interval":"0","rotate":90}),
138         #y Axis configuration item#
139         yaxis_opts=opts.AxisOpts(
140             name="achievement",min_=0,
141             type_="value",axislabel_opts=opts.LabelOpts(formatter="{value} second"),),
142         #Area scaling configuration item#
143         datazoom_opts=opts.DataZoomOpts(range_start=0,range_end=10),
144     )
145 )
146 bar.render_notebook()
147
148 #utilize Matplotlib Draw the scatter chart of the creation time of the top 100 of China's third-order magic cube by December 27, 2021#
149 import pandas as pd
150 import matplotlib.pyplot as plt
151 plt.figure(figsize=(15, 6.5),dpi=600)
152 plt.title('As of December 27, 2021, China's top 100 creation time scatter chart of third-order magic cube',size=25,color="black")
153
154 #Draw a scatter diagram#
155 plt.scatter(df['date'], df['Year of creation'])
156 plt.xticks(rotation=90)
157
158 #Data persistence#
159 plt.savefig('As of December 27, 2021, China's top 100 creation time scatter chart of third-order magic cube.jpg')
160
161 #Display the scatter chart
162 plt.show()
163
164 #utilize Matplotlib Draw the scatter chart of the creation time of the first 100 of China's third-order magic cube blind twist by December 27, 2021#
165 import pandas as pd
166 import matplotlib.pyplot as plt
167 plt.figure(figsize=(15, 6.5),dpi=600)
168 plt.title('As of December 27, 2021, the first 100 creation time scatter of China's third-order magic cube blind twist',size=25,color="black")
169
170 #Draw a scatter diagram#
171 plt.scatter(df2['date'], df2['Year of creation'])
172 plt.xticks(rotation=90)
173
174 #Data persistence#
175 plt.savefig('As of December 27, 2021, the first 100 creation time scatter of China's third-order magic cube blind twist.jpg')
176
177 #Display the scatter chart
178 plt.show()
179
180 #utilize Matplotlib Draw the time distribution map of the top 100 achievements of China's third-order magic cube by December 27, 2021#
181 #Import library#
182 import pandas as pd
183 import matplotlib
184 import matplotlib.pyplot as plt
185
186 #Set drawing size#
187 plt.figure(figsize=(15,7),dpi=80)
188
189 #Set the display scale of each part#
190 finance=[len(df[df["Year of creation"]==2015]["Year of creation"]),
191          len(df[df["Year of creation"]==2017]["Year of creation"]),
192          len(df[df["Year of creation"]==2018]["Year of creation"]),
193          len(df[df["Year of creation"]==2019]["Year of creation"]),
194          len(df[df["Year of creation"]==2020]["Year of creation"]),
195          len(df[df["Year of creation"]==2021]["Year of creation"])]
196
197 #Set up Chinese display to solve the problem of garbled code#
198 font = {'family' : 'MicroSoft YaHei',
199         'weight': 'bold',
200         'size': '12'}
201 matplotlib.rc("font",**font)
202 matplotlib.rc("font",
203               family='MicroSoft YaHei',
204               weight="bold")
205 labels = ["2015",
206           "2017",
207           "2018",
208           "2019",
209           "2020",
210           "2021"]
211 explode = [0.1, 0.1, 0.1, 0.1,0.1,0.1]
212 colors = ['mistyrose', 'salmon', 'tomato', 'darksalmon','mistyrose','orangered']
213
214 #Set pie chart related parameters#
215 plt.pie(finance, explode=explode, labels=labels,
216         colors=colors,autopct='%.2f%%',
217         pctdistance=0.8, labeldistance=1.1,
218         startangle=180,  radius=1.2,
219         counterclock=False,
220         wedgeprops={'linewidth':1.5, 'edgecolor':'white'},
221         textprops={'fontsize':10, 'color':'black'} )
222
223 #Set title#
224 plt.title('Pie chart of year distribution of top 100 achievements in China's third-order magic cube')
225
226 #Data persistence#
227 plt.savefig('Pie chart of year distribution of top 100 achievements in China's third-order magic cube.jpg')
228
229 #Display visual image#
230 plt.show()
231
232 #utilize Matplotlib Draw the time distribution map of the top 100 achievements of China's third-order magic cube blind twist by December 27, 2021#
233 #Import library#
234 import pandas as pd
235 import matplotlib
236 import matplotlib.pyplot as plt
237
238 #Set drawing size#
239 plt.figure(figsize=(15,7),dpi=80)
240
241 #Set the display scale of each part#
242 finance=[len(df2[df2["Year of creation"]==2009]["Year of creation"]),
243          len(df2[df2["Year of creation"]==2010]["Year of creation"]),
244          len(df2[df2["Year of creation"]==2012]["Year of creation"]),
245          len(df2[df2["Year of creation"]==2013]["Year of creation"]),
246          len(df2[df2["Year of creation"]==2014]["Year of creation"]),
247          len(df2[df2["Year of creation"]==2015]["Year of creation"]),
248          len(df2[df2["Year of creation"]==2016]["Year of creation"]),
249          len(df2[df2["Year of creation"]==2017]["Year of creation"]),
250          len(df2[df2["Year of creation"]==2018]["Year of creation"]),
251          len(df2[df2["Year of creation"]==2019]["Year of creation"]),
252          len(df2[df2["Year of creation"]==2021]["Year of creation"])]
253
254 #Set up Chinese display to solve the problem of garbled code#
255 font = {'family' : 'MicroSoft YaHei',
256         'weight': 'bold',
257         'size': '12'}
258 matplotlib.rc("font",**font)
259 matplotlib.rc("font",
260               family='MicroSoft YaHei',
261               weight="bold")
262
263 #Set pie chart display#
264 labels = ["2009",
265           "2010",
266           "2012",
267           "2013",
268           "2014",
269           "2015",
270           "2016",
271           "2017",
272           "2018",
273           "2019",
274           "2021"]
275 explode = [0.1, 0.1, 0.1, 0.1,0.1,0.1,0.1, 0.1, 0.1, 0.1,0.1]
276 colors = ['plum', 'violet', 'purple', 'darkmagenta','m','thistle','magenta','orchid','mediumvioletred','deeppink','hotpink']
277
278 #Set pie chart related parameters#
279 plt.pie(finance, explode=explode, labels=labels,
280         colors=colors,autopct='%.2f%%',
281         pctdistance=0.8, labeldistance=1.1,
282         startangle=180,  radius=1.2,
283         counterclock=False,
284         wedgeprops={'linewidth':1.5, 'edgecolor':'white'},
285         textprops={'fontsize':10, 'color':'black'} )
286
287 #Set title#
288 plt.title('Pie chart of the year of creation of the top 100 achievements of China's third-order magic cube blind twist')
289
290 #Data persistence#
291 plt.savefig('Pie chart of year distribution of top 100 achievements of China's third-order blind screw speed.jpg')
292
293 #Display visual image#
294 plt.show()
V. summary
1. What conclusions can be drawn from the analysis and visualization of subject data? Is the expected goal achieved?
Conclusion: (1) in recent years, the results of China's third-order speed screwing and blind screwing have increased year by year, indicating that the strength of the players has increased year by year;
(2) compared with quick screwing, there is a large gap in the ranking of Qian 100 of blind screwing, and the time to create results is relatively scattered. China's blind screwing performance needs to be improved;
(3) generally speaking, the development of Chinese Rubik's cube industry shows a steady and good trend.
Achieved the expected goal.
2. What are the gains in the process of completing this design? And suggestions for improvement?
Harvest: during the design process, I learned a lot about Python crawlers and the powerful and convenient visualization function of Python. However, he also encountered some difficulties, exposing his unskilled knowledge of Python. I didn't study hard enough. I encountered some difficulties in the related content of crawler and visualization, but it was also solved after many attempts.
Suggestion: we still need to continue to work hard, learn more, try more and think more.