Prometheus: Prometheus is an open monitoring solution. Users can easily install and use Prometheus and expand it
The following will implement the whole process of a SpringBoot application accessing Prometheus
1.2 installation
Linux Installation
- Download package specified on the official website: https://prometheus.io/download/
Download local installation startup
wget https://github.com/prometheus/prometheus/releases/download/v2.26.0/prometheus-2.26.0.linux-amd64.tar.gz

tar -zxvf prometheus-2.26.0.linux-amd64.tar.gz
cd prometheus-2.26.0.linux-amd64

# Start command
./prometheus
After startup, local access http://127.0.0.1:9090/graph You can see the interface provided by default
2. SpringBoot application access
The SpringBoot we demonstrated is 2.0 +, so we directly choose io The implementation of micrometer depends on the package; Lower versions cannot use this pose, but can directly use the officially provided client; There is no extension here
2.1 dependency configuration
Provide extension endpoints with the help of spring boot's actor (so this article adopts Prometheus's pull working mode)
SpringBoot version is 2.2.1 RELEASE
Core dependency
<dependencies>
    <dependency>
        <groupId>org.springframework.boot</groupId>
        <artifactId>spring-boot-starter-actuator</artifactId>
    </dependency>

    <dependency>
        <groupId>org.springframework.boot</groupId>
        <artifactId>spring-boot-starter-web</artifactId>
    </dependency>

    <dependency>
        <groupId>io.micrometer</groupId>
        <artifactId>micrometer-registry-prometheus</artifactId>
    </dependency>
</dependencies>
For yaml configuration file, you need to specify parameters related to Prometheus. A demo is as follows
spring:
  application:
    name: prometheus-example
management:
  endpoints:
    web:
      exposure:
        include: "*"
  metrics:
    tags:
      application: ${spring.application.name}
be careful
- management.endpoints.web.exposure.include specifies here that all web interfaces will be reported
- metrics. tags. All reported metrics in the application will be tagged with the application tag
After the above configuration is completed, an endpoint of / Actor / prometheus will be provided for prometheus to pull Metrics information
2.2 application startup
For SpringBoot, you don't need to do anything else at this time to report the basic information of the application
A simple demo is as follows
@RestController
@SpringBootApplication
public class Application {
    private Random random = new Random();
true
    // An http interface for demonstration
    @GetMapping(path = "hello")
    public String hello(String name) {
        int sleep = random.nextInt(200);
        try {
            Thread.sleep(sleep);
        } catch (InterruptedException e) {
            e.printStackTrace();
        }
        return "hello sleep: " + sleep + " for " + name;
    }

    public static void main(String[] args) {
        SpringApplication.run(Application.class);
    }

    // Note that this is the core code block of the registration
    @Bean
    MeterRegistryCustomizer<MeterRegistry> configurer(@Value("${spring.application.name}") String applicationName) {
        return (registry) -> registry.config().commonTags("application", applicationName);
    }
}
At this point, the monitoring of springboot application is completed; Next, configure the server of prometheus
3. prometheus configuration and measurement
Under the package downloaded earlier, there is a configuration file Prometheus YML, add a new Job
- job_name: 'prometheus-example'
true# Grab frequency
  scrape_interval: 5s
  # Grab endpoint
  metrics_path: '/actuator/prometheus'
  static_configs:
  	# The target machine, array, supports cluster pull
    - targets: ['127.0.0.1:8080']
After modifying the configuration, you need to restart. After the service is started, you can our application information on the console
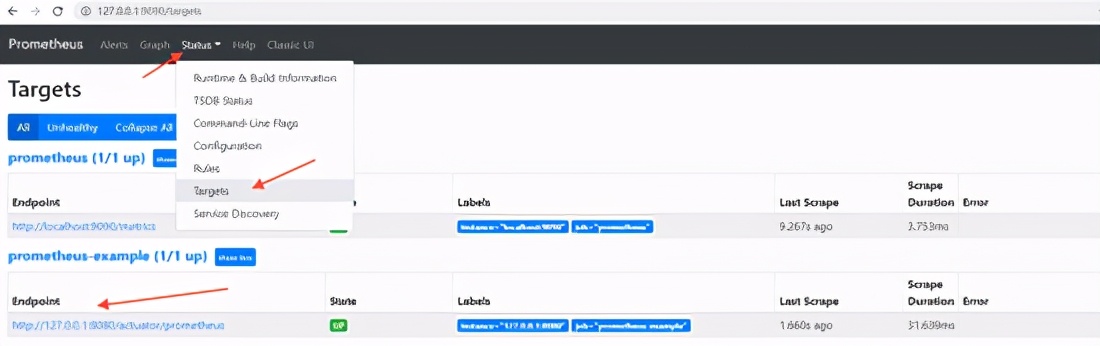
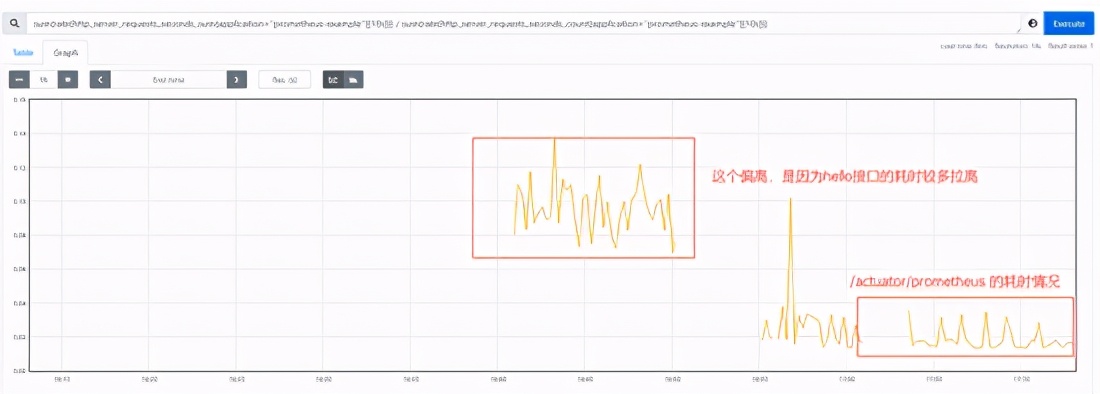
Next, visit Graph and select metric: http_server_requests_seconds_count can see a record of picking up metric
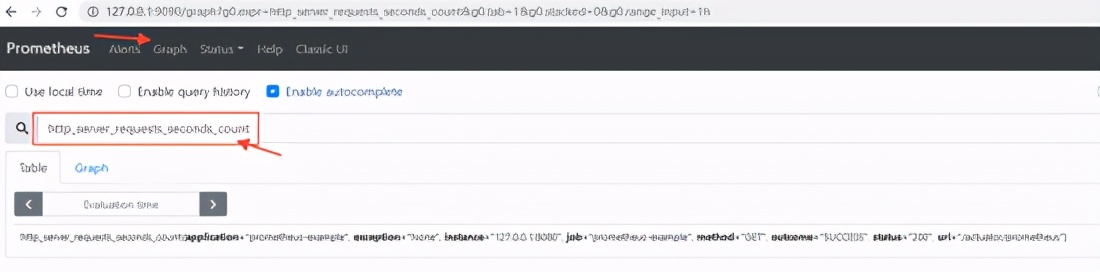
We defined a Controller earlier, and then simply access it several times, and then take a look, and you will find one more record
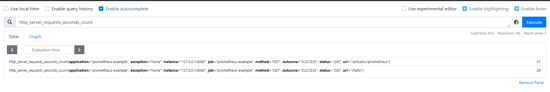
These data are directly integrated by the framework layer to report the relevant information of the REST interface. With this metric, we can realize the statistics of qps
3.1 qps statistics
sum(rate(http_server_requests_seconds_count{application="prometheus-example"}[10s]))
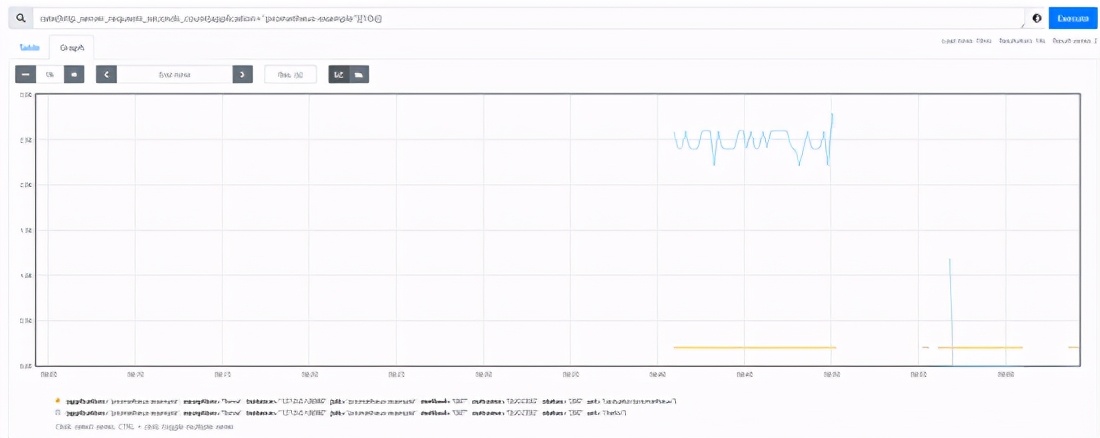
- rate: used to count the growth trend. The Metric to be reported is of Counter type (only increase but not decrease)
- irate: similar to rate, the difference is that rate counts the average growth rate over a period of time and cannot reflect the emergencies (i.e. instantaneous peak) in this time window. irate calculates the growth rate through the last two sample data in the interval vector, but when the selected interval range is large, it may cause a large deviation
- Sum: sum, applicable to statistical scenarios
For more built-in functions, please refer to PromQL built-in functions
3.2 time consuming statistics
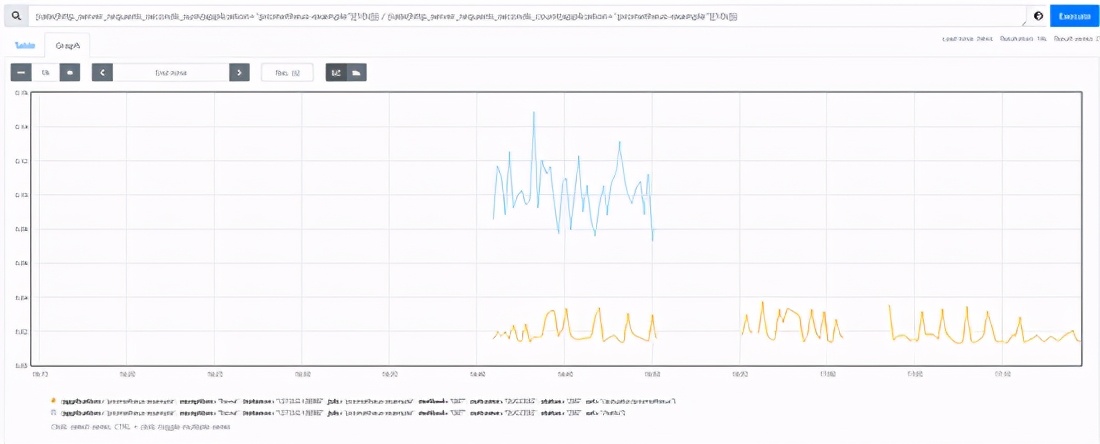
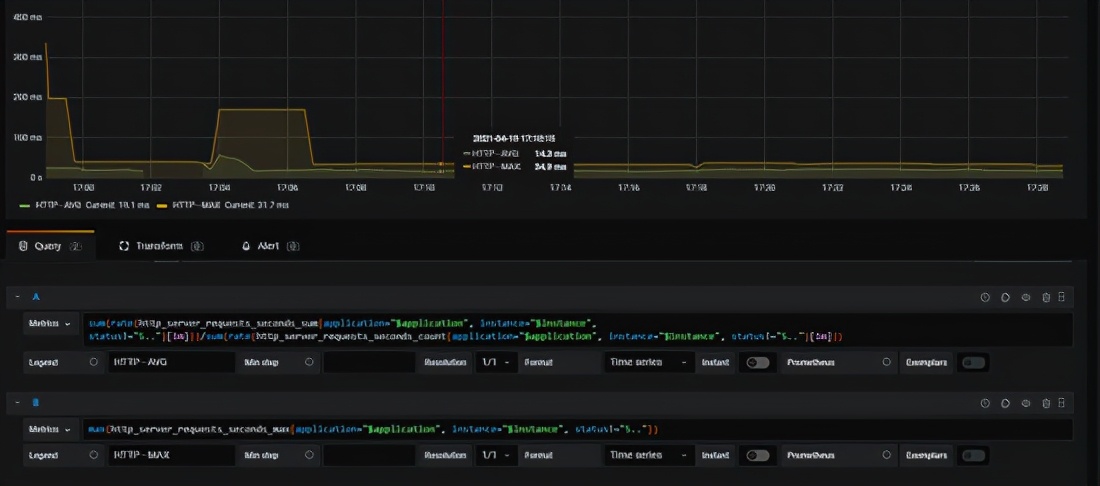
In addition to qps, another indicator that we often pay attention to is rt. for example, the average rt of the above interface is realized through the combination of two metrics
sum(rate(http_server_requests_seconds_sum{application="prometheus-example"}[10s])) / sum(rate(http_server_requests_seconds_count{application="prometheus-example"}[10s]))
After removing the sum aggregation, you can see the access of each interface
4. Grafana market configuration
Panel monitoring is more powerful than grafana. In particular, grafana itself provides many templates that can be imported directly
For installation, please refer to: 210318 Linux grafana large disk access mysql
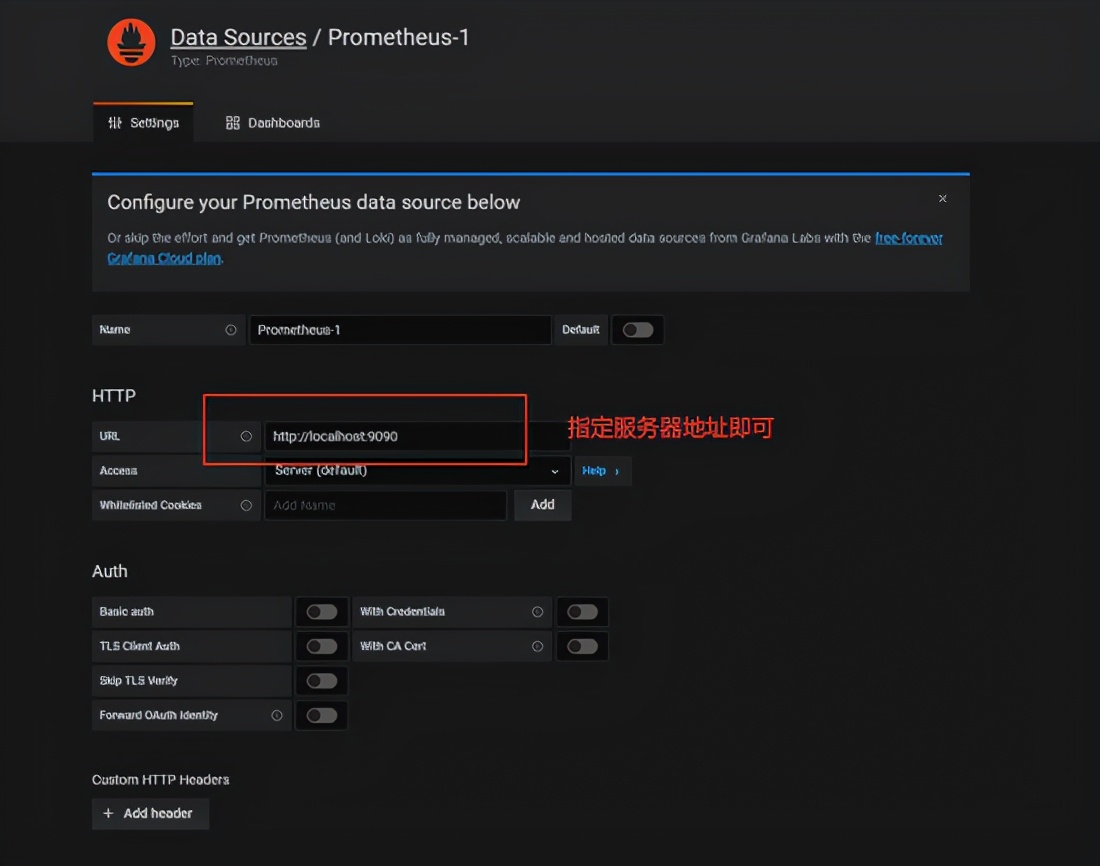
4.1 market configuration
After starting grafana, configure the data source Promethues
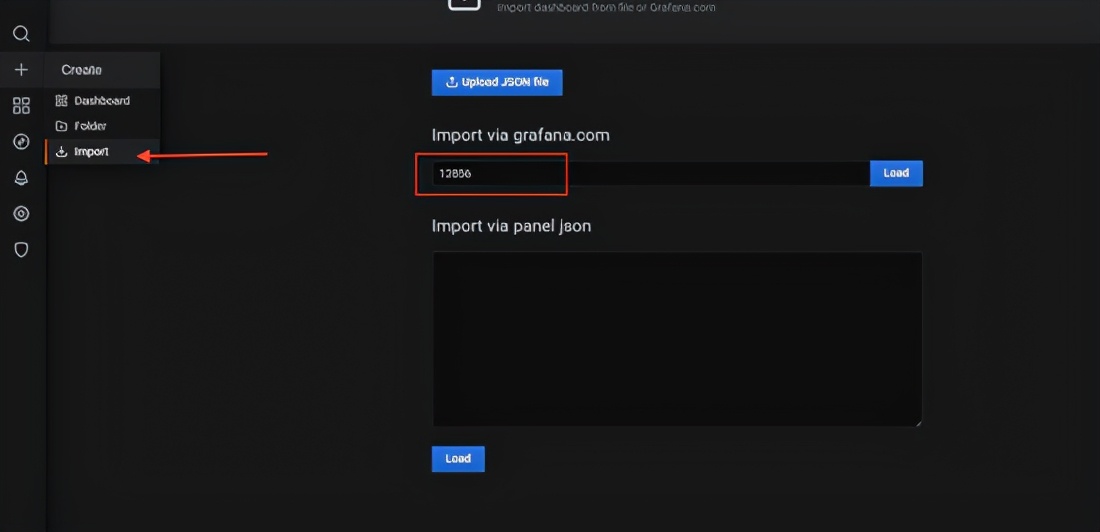
Next, configure the application configuration panel of SpringBoot, and you can directly use the ready-made template, such as 12856
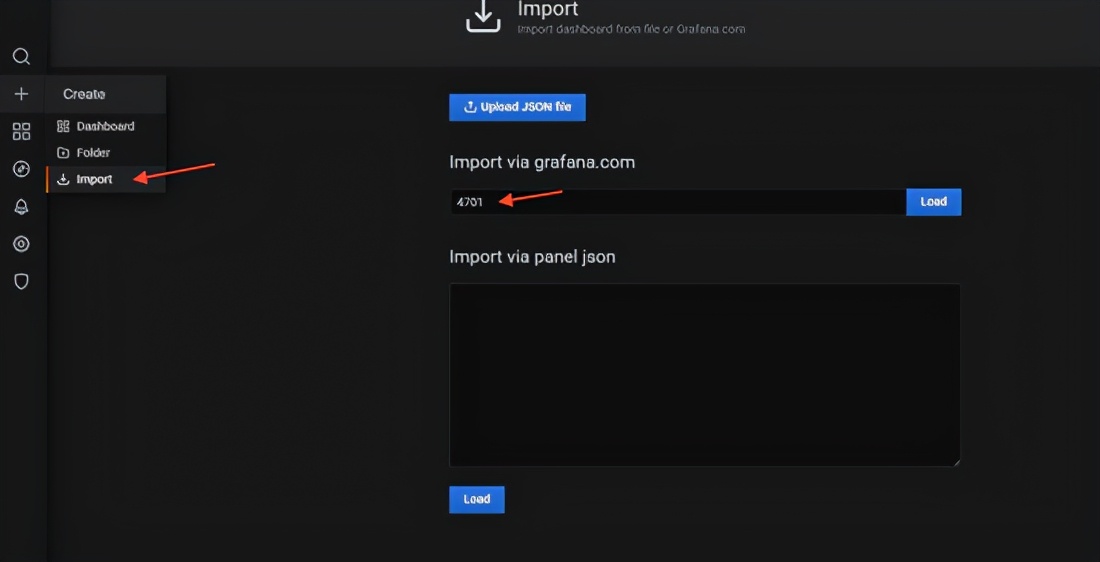
After importing, the market is shown as follows
Let's take a look at the statistics promql of request time-consuming
4.2 where can I find the large-scale formwork
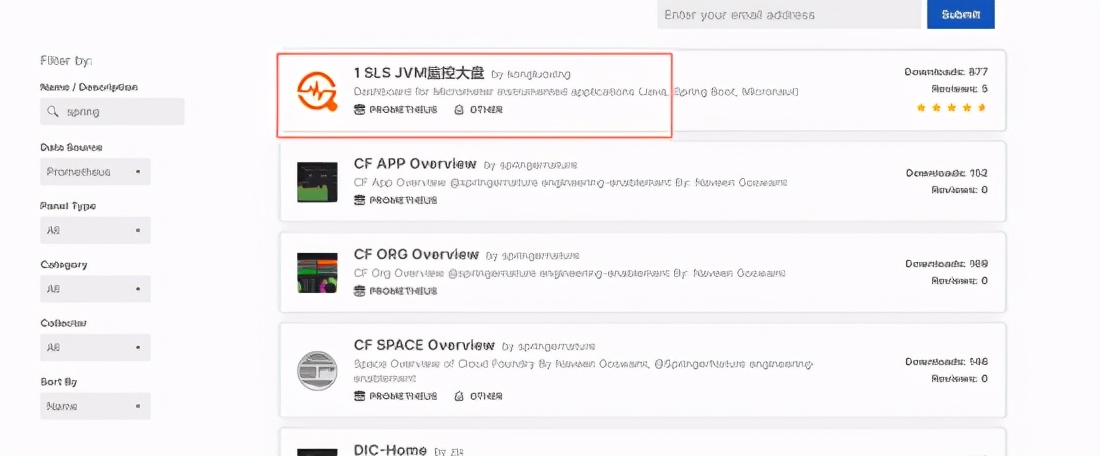
How to find the directly available market?
- Just search the market on the official website
- As https://grafana.com/grafana/dashboards?dataSource=prometheus&search=spring
- Select one and click in. The number corresponding to copy ID to clipboard on the right is what we need
5. Summary
When the whole process goes down, you will find that the cost of accessing Prometheus in SpringBoot project is very low. Basically, there is not much coding work. You can configure it to the monitoring market with a full set of functions. Don't be too high
The convenience of high encapsulation is very prominent here, but after doing it, think back, what did I get?
It seems that I haven't got anything. If my service only provides grpc/dubbo interface, now if we are allowed to access the monitoring, it seems that we are still blind. How should I play? (welcome to leave a message in the comment area)
Original link: http://spring.hhui.top/spring-blog/2021/04/19/210419-SpringBoot Integrating Prometheus to realize application monitoring/
If you think this article is helpful to you, you can pay attention to my official account and reply to the key words [interview] to get a Java core knowledge and arrange an interview gift! There are more technical dry goods articles and related materials to share. Let's learn and make progress together!