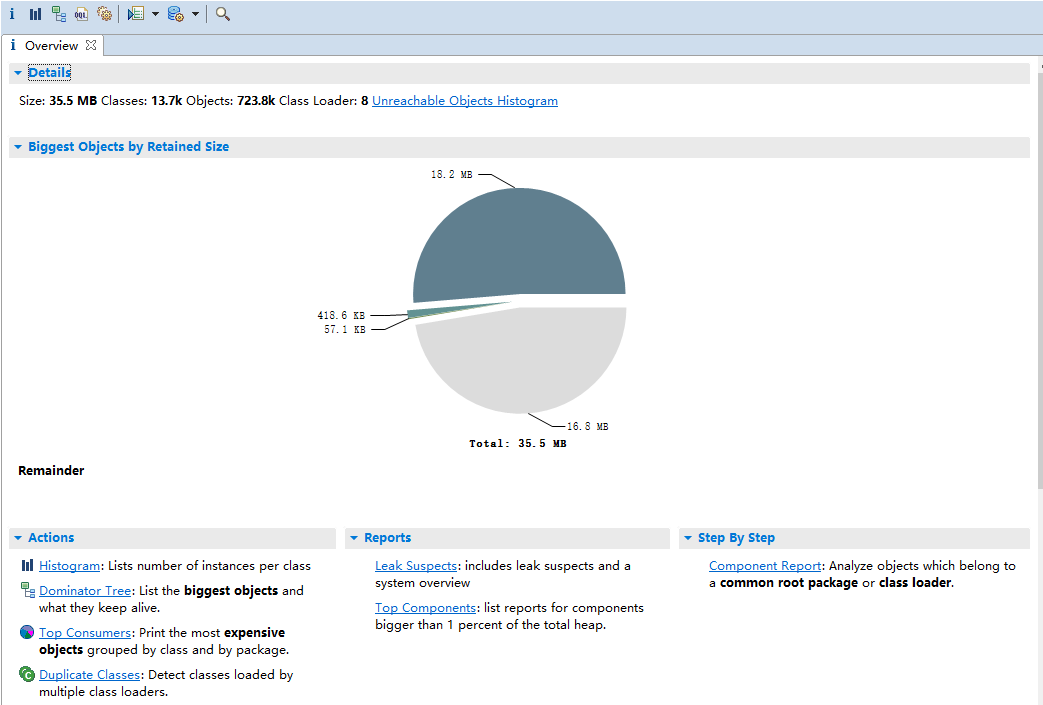
1. Memory problem
- Memory jitter: jagged, GC causing Caton
- Memory leak: available memory is reduced, frequent GC
- Memory overflow: OOM, program exception
2. Tool selection
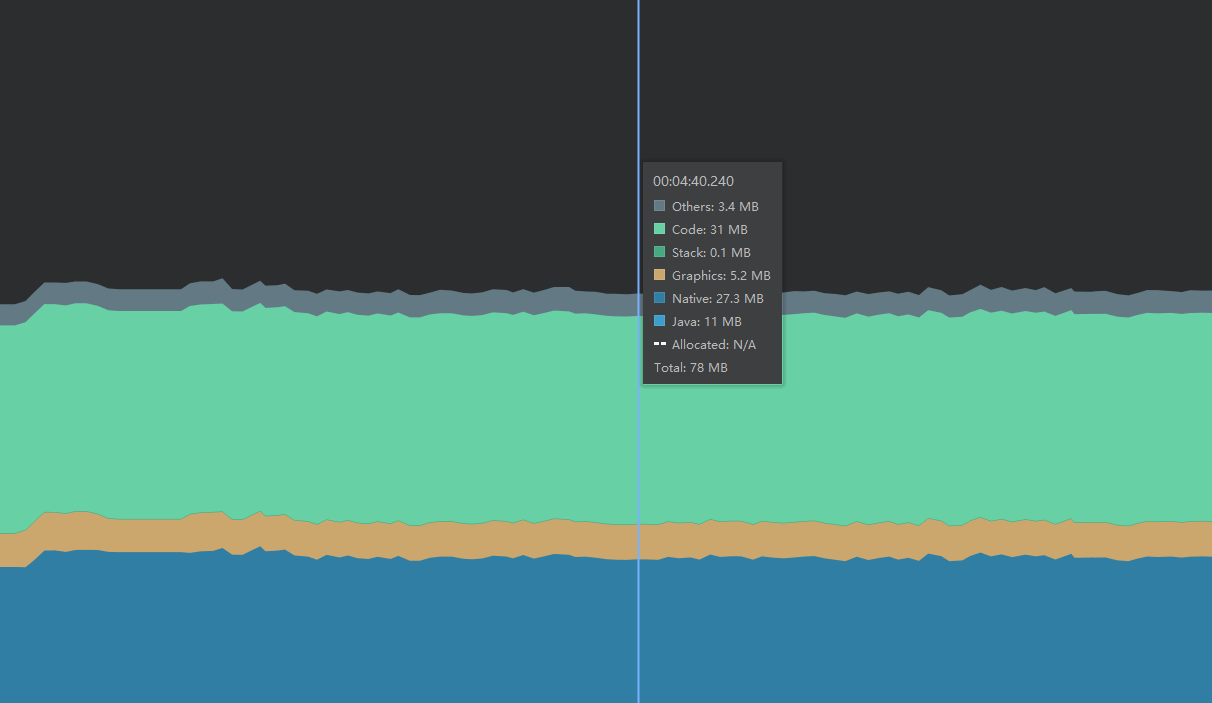
- Memory Profiler
Real time charts show application memory usage, identify memory leaks, jitters, etc., and provide the ability to capture heap dumps, force GC, and track memory allocation - Memory Analyzer
Powerful Java Heap analysis tool, find memory leaks and memory occupation, generate overall reports, analyze problems, etc., and use it in depth offline - LeakCanary
Automatic memory leak detection, which can only be used offline
3. Memory management mechanism
Java memory allocation
Method area: class information, constants, static variables, etc. are shared by all threads
Virtual machine stack: local variable table, operand stack, etc. the allocated references point to the real objects in the heap
Native method stack: native method
Heap: all threads share the memory allocated by the object on the heap. GC is mainly used in this area. Memory leakage also occurs on the heap
Program counter: what line did the thread execute to
Memory recovery algorithm
- Mark clearing algorithm: mark all objects that need to be recycled and recycle all marked objects uniformly. It is not efficient and will produce a large number of memory fragments
- Replication algorithm: divide the memory into two blocks of equal size. After one block of memory is used up, copy the living objects to the other block and clean up the other block of memory. Simple implementation, efficient operation, waste half of space and high cost
- Tag sorting algorithm: the tag process is the same as the "tag clearing algorithm". The living objects move to one end to clean up the remaining memory. Avoid memory fragmentation and space waste
- Generational collection algorithm: combined with the advantages of a variety of algorithms, the survival rate of new generation objects is low, the replication rate is high, and the survival rate of old age objects is high.
Android memory management mechanism - Memory is allocated flexibly, and the allocated value and maximum value are affected by specific devices
- OOM scenario: the memory is really insufficient, and the available memory is insufficient
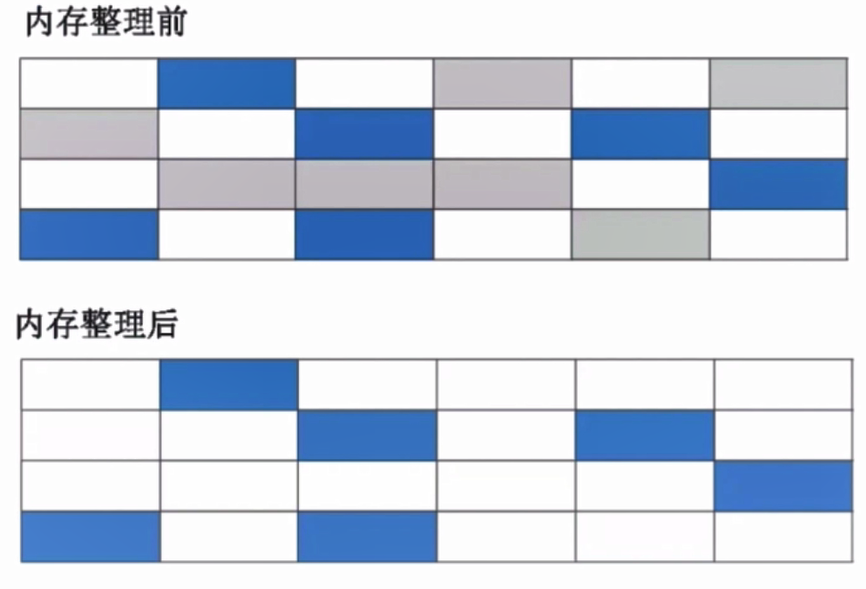
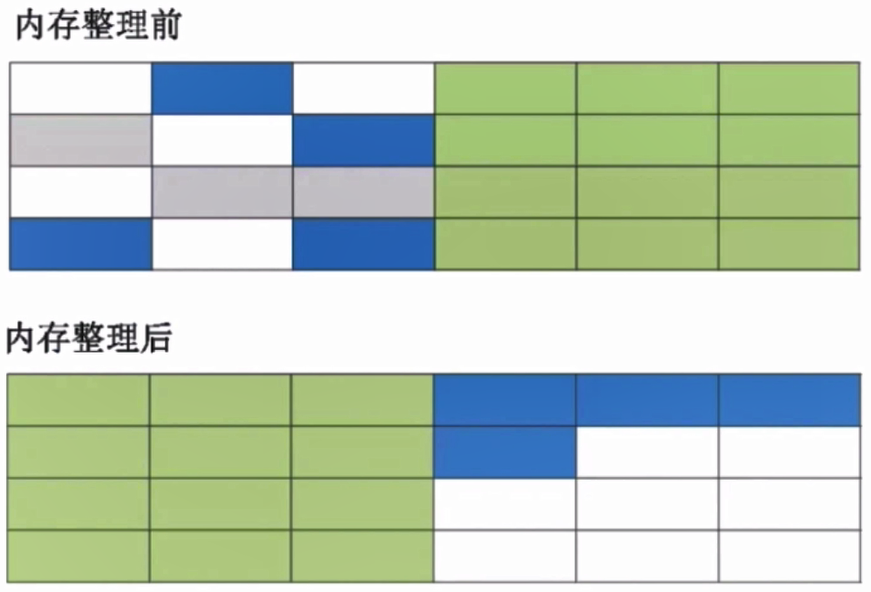
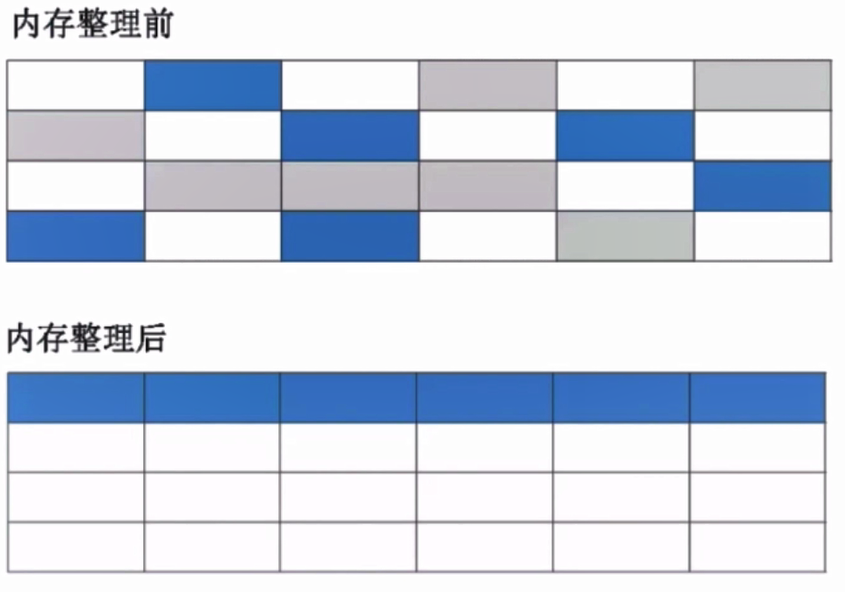
- Difference between Dalvak and Art: Dalvak only fixes one recycling algorithm, and art recycling algorithm can be selected during the running period (for example, when the application is applied in the foreground, the response speed is the most important, a simple algorithm should be selected, and the tag clearing algorithm can be used. When the application is switched to the background, the tag sorting algorithm can be used). Art has the ability of internal memory sorting to reduce memory holes
- Low Memory Killer: when the mobile phone is short of memory, it will recycle all processes according to the process classification priority and recycling revenue
####4. Memory jitter practice
Frequent memory allocation and recycling lead to memory instability, performance: frequent GC, memory curve is jagged, harm: lead to Caton and oom (frequent creation of objects leads to insufficient memory and fragments, and discontinuous memory fragments cannot be allocated, resulting in OOM)
Write an activity that simulates memory jitter
/**
 * Interface to simulate memory jitter
 */
public class MemoryShakeActivity extends AppCompatActivity implements View.OnClickListener {

    @SuppressLint("HandlerLeak")
    private static Handler mHandler = new Handler() {
        @Override
        public void handleMessage(Message msg) {
            super.handleMessage(msg);
            // Create memory jitter
            for (int index = 0; index <= 100; index++){
                String arg[] = new String[100000];
            }
            mHandler.sendEmptyMessageDelayed(0,30);
        }
    };

    @Override
    protected void onCreate(@Nullable Bundle savedInstanceState) {
        super.onCreate(savedInstanceState);
        setContentView(R.layout.activity_memory);
        findViewById(R.id.bt_memory).setOnClickListener(this);

    }

    @Override
    public void onClick(View v) {
        mHandler.sendEmptyMessage(0);
    }

    @Override
    protected void onDestroy() {
        super.onDestroy();
        mHandler.removeCallbacksAndMessages(null);
    }
}
After execution, it is found that memory allocation is very frequent
 You can record the memory allocation through the record function
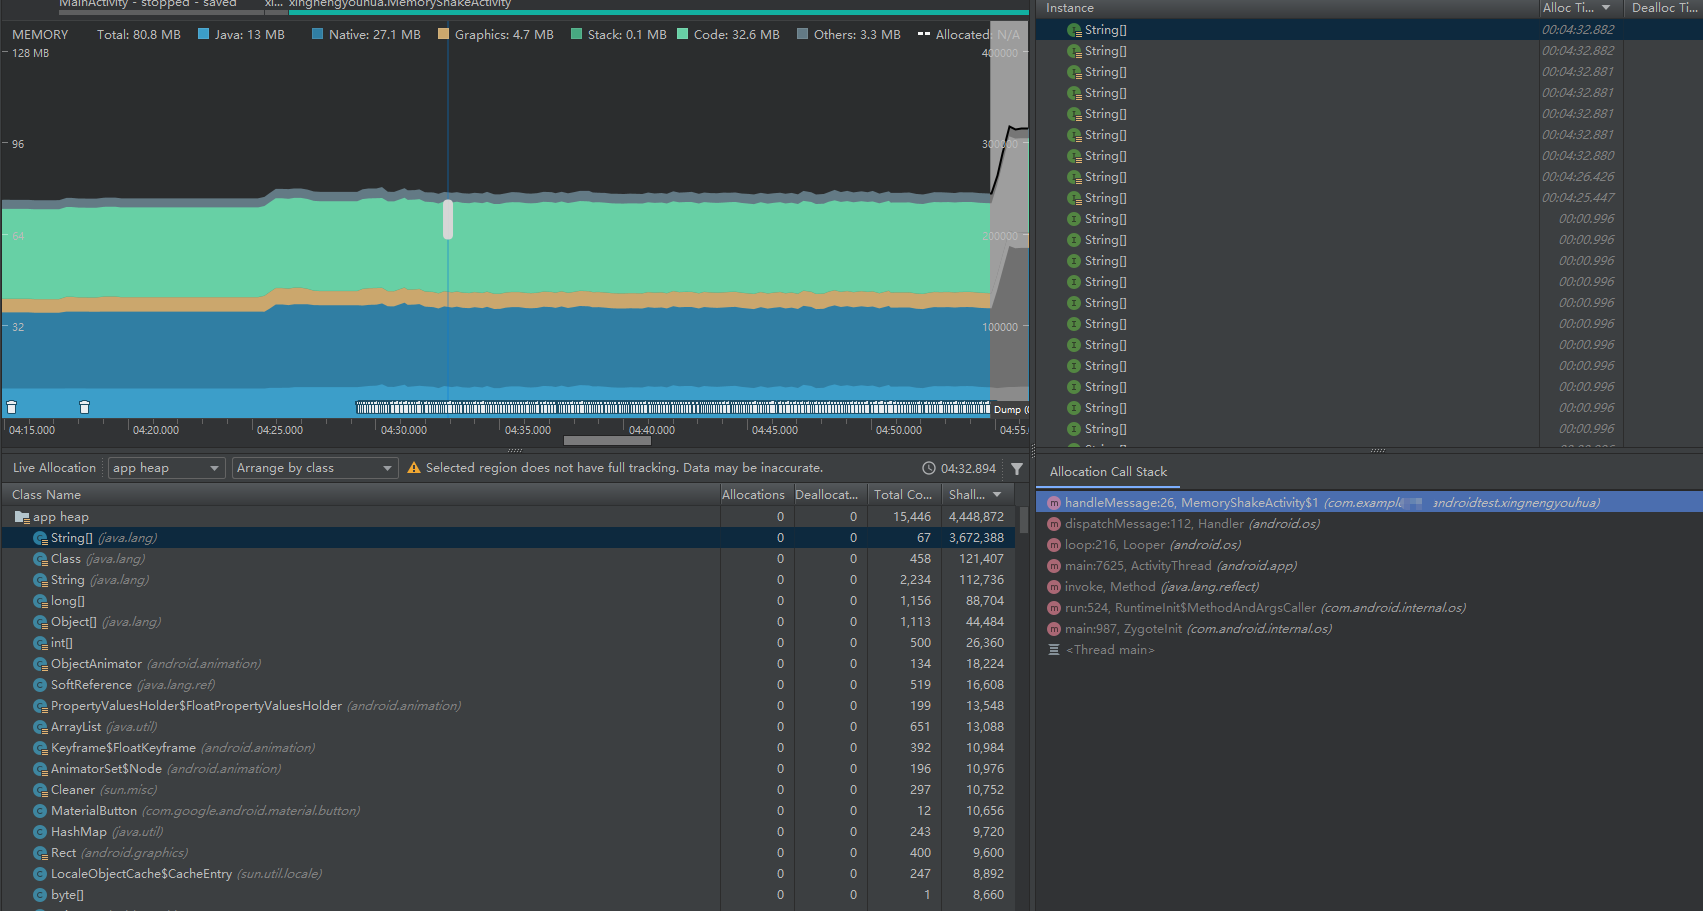 You can find that string is allocating a lot of memory, and you can see the location of the code
Memory jitter solving skills: find places where loops or frequent calls are made
5. Memory leak practice
There are useless objects in memory, which are manifested as memory jitter, less available memory, and harm: insufficient memory, frequent GC, and OOM
To confirm the problem, use Memory Analyzer to convert the format through hprof conv tool
Download address https://www.eclipse.org/mat/downloads.php
CallBackManager to hold a reference to the activity
public class CallBackManager {

    public static ArrayList<CallBack> sCallBacks = new ArrayList<>();

    public static void addCallBack(CallBack callBack) {
        sCallBacks.add(callBack);
    }

    public static void removeCallBack(CallBack callBack) {
        sCallBacks.remove(callBack);
    }

}
/**
 * Activity simulating memory leak
 */
public class MemoryLeakActivity extends AppCompatActivity implements CallBack{

    @Override
    protected void onCreate(@Nullable Bundle savedInstanceState) {
        super.onCreate(savedInstanceState);
        setContentView(R.layout.iv_memoryleak);
        ImageView imageView = findViewById(R.id.iv_memoryleak);
        Bitmap bitmap = BitmapFactory.decodeResource(getResources(), R.mipmap.splash);
        imageView.setImageBitmap(bitmap);

        CallBackManager.addCallBack(this);
    }

    @Override
    protected void onDestroy() {
        super.onDestroy();
       // CallBackManager.removeCallBack(this);
    }

    @Override
    public void dpOperate() {
        // do sth
    }
}
Because the callback is static, like the application life cycle, it does not release the reference of activity, resulting in memory leakage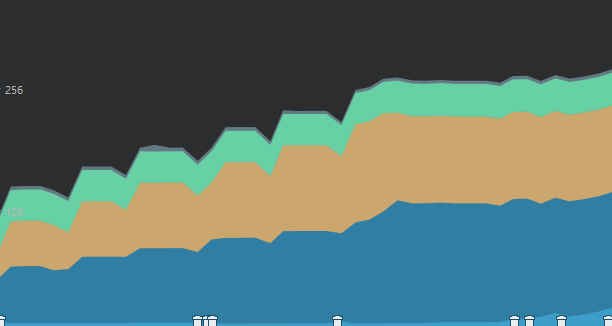
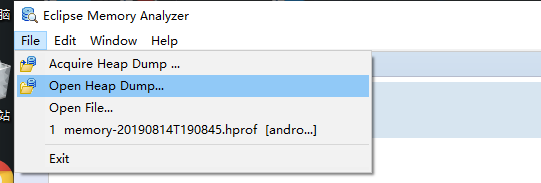
Use the heap dump function to save the file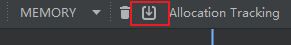 Use the commands in platform tools to convert the files
hprof-conv .\memory-20190814T190845.hprof memory_leak_1.hprof
Then use the tool to open the file
 Open Histogram, filter out MemoryLeakActivity, select a Class, right-click and select list objects > with incoming references to select which strong references point to me
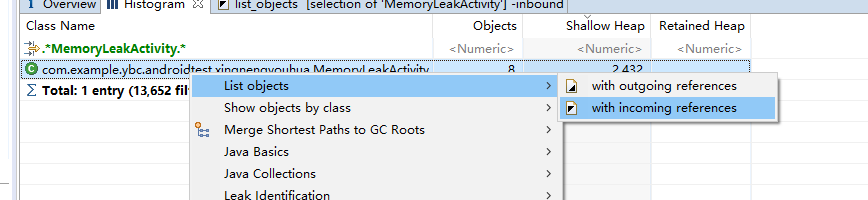
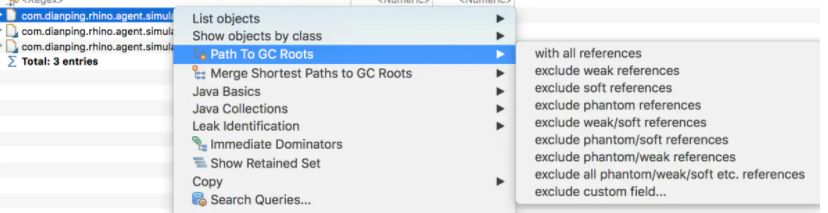
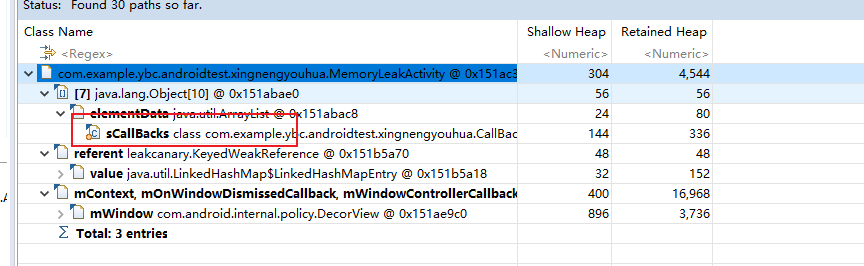
The object information created through this class will be displayed on the new page. Select an object and right-click to select path to GC roots > * * * *. Generally, when troubleshooting memory leaks, we will select exclude all phantom/weak/soft etc.references, which means to view the reference chain excluding virtual references, weak references, soft references, etc, Because objects that are falsely referenced / weakly referenced / soft referenced can be directly recycled by GC, what we need to see is whether an object still has a Strong reference chain (GC should be started manually before exporting HeapDump). If so, it indicates that there is a memory leak, and then check the specific references.
The location of the memory leak was found
6. Artbook detects unreasonable pictures
Bitmap memory model
- Before API10, the Bitmap was in the Dalvik Head heap and the pixels were in the Native heap. The advantage is that it does not occupy the memory allocated by the application. The disadvantage is that the Bitmap in Java is recycled, but the Native memory cannot be controlled
- Pixels after API10 are also in the Dalvik Head heap
- After API26 pixels are in Native, add a mechanism, and notify Native to recycle after the Bitmap in Java is recycled
Memory occupied by getting Bitmap
- getByteCount is calculated at run time
- W x H x 1 pixel memory occupied
Conventional mode
Pictures are very important for memory optimization. The width and height of pictures are greater than the width and height of controls. They inherit ImageView and overwrite to calculate the size
Artbook introduction
Hook, hook the additional code to the original method and execute the modification logic
Epic use
Epic is a runtime AOP Hook framework with Java Method granularity at the virtual machine level. In short, epic is Dexposed on ART (supporting Android 5.0 ~ 11). It can intercept almost any Java Method calls in the process, and can be used to realize AOP programming, runtime instrumentation, performance analysis, security audit, etc.
build. Add the following dependencies to gradle
compile 'com.github.tiann:epic:0.11.2'
Inherit XC_MethodHook implements logic and injects hook
DexposedBridge.findAndHookMethod
Create a new ImageHook class
public class ImageHook extends XC_MethodHook {
    @Override
    protected void afterHookedMethod(MethodHookParam param) throws Throwable {
        super.afterHookedMethod(param);
        ImageView imageView = (ImageView) param.thisObject;
        checkBitmap(imageView, ((ImageView) param.thisObject).getDrawable());

    }

    private static void checkBitmap(Object thiz, Drawable drawable) {
        if (drawable instanceof BitmapDrawable && thiz instanceof View) {
            final Bitmap bitmap = ((BitmapDrawable) drawable).getBitmap();
            if (bitmap != null) {
                final View view = (View) thiz;
                int width = view.getWidth();
                int height = view.getHeight();
                if (width > 0 && height > 0) {
                    //The width and height of the picture is more than twice the width and height of the control
                    if (bitmap.getWidth() >= (width << 1) && bitmap.getHeight() >= (height << 1)) {
                        Log.d("ImageHookb", bitmap.getWidth() + " " + bitmap.getHeight() + " " + width + " " + height);
                    } else {
                        final Throwable stackTrace = new RuntimeException();
                        view.getViewTreeObserver().addOnPreDrawListener(() -> {
                            int w = view.getWidth();
                            int h = view.getHeight();
                            if (w > 0 && h > 0) {
                                if (bitmap.getWidth() >= (w << 1) && bitmap.getHeight() >= (h << 1)) {
                                    Log.d("ImageHookb", bitmap.getWidth() + " " + bitmap.getHeight() + " " + w+ " " + h);
                                }
                                //view.getViewTreeObserver().removeOnPreDrawListener(this);
                            }
                            return true;
                        });

                    }
                }
            }
        }
    }

}
In onCreate of application
DexposedBridge.hookAllConstructors(ImageView.class, new XC_MethodHook() {
            @Override
            protected void afterHookedMethod(MethodHookParam param) throws Throwable {
                super.afterHookedMethod(param);
                DexposedBridge.findAndHookMethod(ImageView.class, "setImageBitmap", Bitmap.class, new ImageHook());
            }
        });
In MemoryLeakActivity
ImageView imageView = findViewById(R.id.iv_memoryleak);
        Bitmap bitmap = BitmapFactory.decodeResource(getResources(), R.mipmap.splash);
        imageView.setImageBitmap(bitmap);
		//The width and height of the ImageView layout are very small
The log will be printed after running
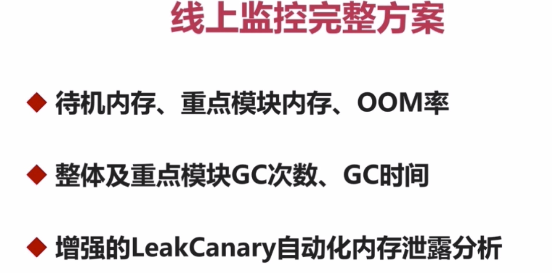
7. Online memory monitoring scheme
1. Set dump: debug dumpHprofData(). More than 80% memory, dump memory, upload files, MAT tool analysis
Problem: dump file is too large, which is related to the number of objects and can be clipped. The upload failure rate is high and it is difficult to analyze problems
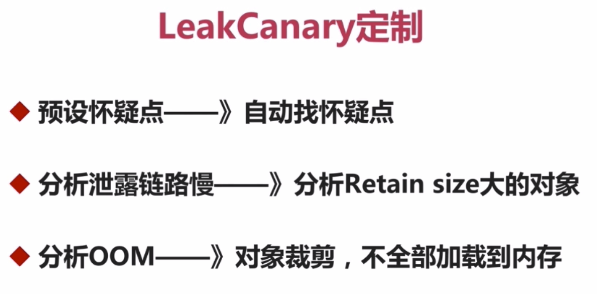
2. Take LeakCanary to the line, preset the suspected leakage point, and send it back if it is found
Problem: it is not suitable for all situations, and the analysis is slow, which may cause OOM
General direction of optimization
1. Memory leak, 2. Memory jitter, 3. bitmap
Optimization details
1. LargeHeap attribute 2. onTrimMemory 3. Optimized collection, sparearray 4. Use SharedPreferences cautiously 5. Use external libraries cautiously 6. Business architecture is reasonable