This article mainly talks about building a log collection and analysis system. For how to deploy ELK using docker, please refer to my previous article https://blog.csdn.net/qq_36534560/article/details/119954728
Log collection system
brief introduction
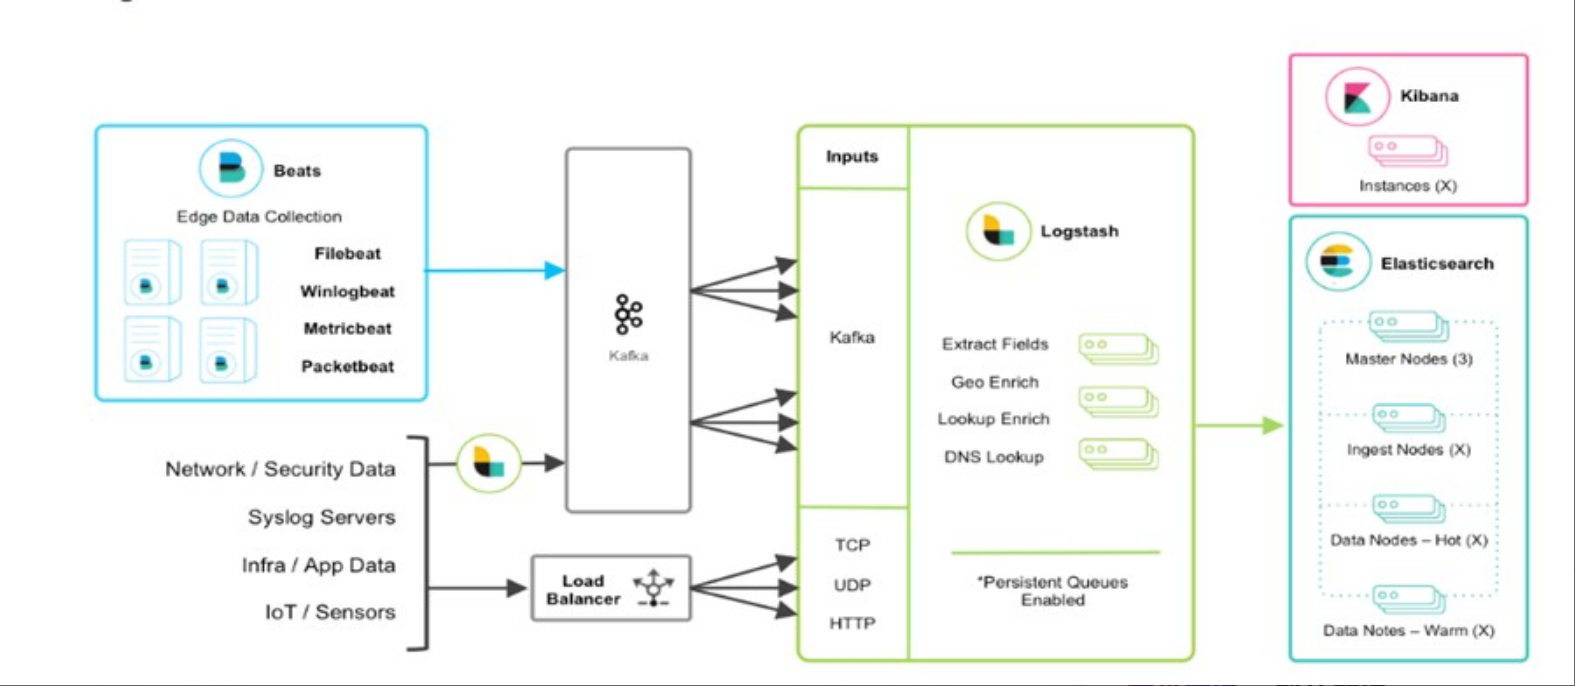
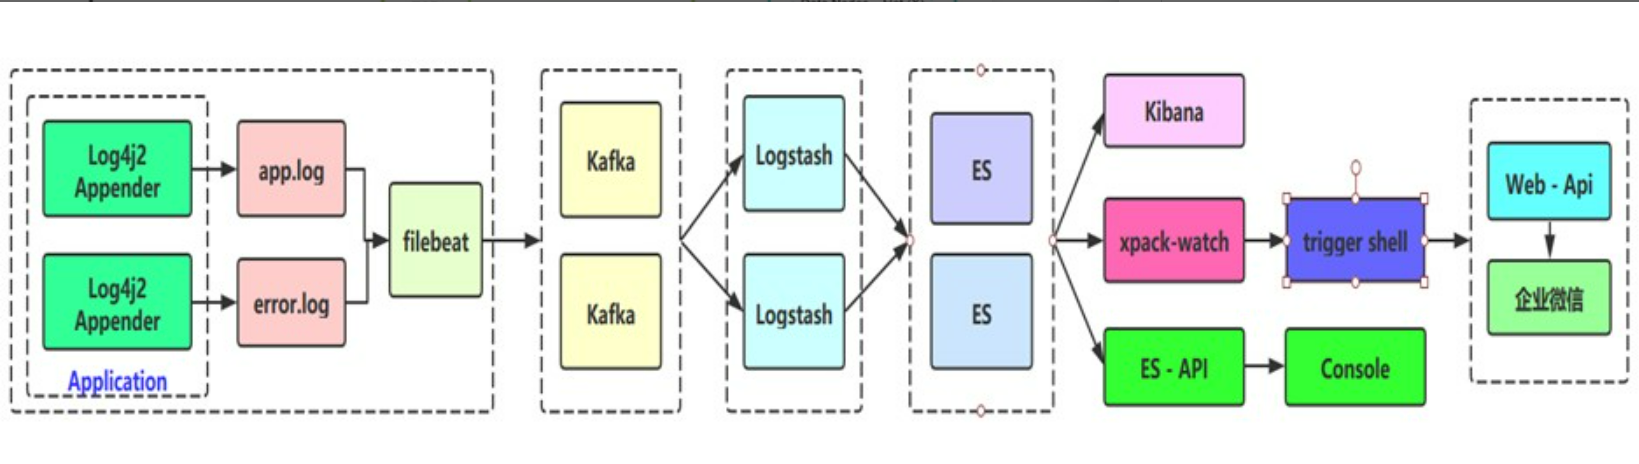
Integrate the application with SpringBoot, and then extend to ELK technology stack to realize log output (Log4j2), data capture (Filebeat) and data dump (Kafka Broker); then to Logstash consumption, and then Sink to Elasticsearch platform for display through Kibana
ELK technical architecture
ELK actual combat flow chart
Using docker to build filebeat
Pull image
docker pull elastic/filebeat:7.13.2
filebeat is consistent with the best version of Elasticsearch. To view the es version, go to the Kibana page or go to the es bin directory and use / opt/elasticsearch/bin/elasticsearch --version
Create container
docker run -d \
  --name=filebeat \
  --user=root \
  --volume="/usr/local/filebeat/filebeat.yml:/usr/share/filebeat/filebeat.yml:ro" \
  --volume="/usr/local/logs:/usr/local/logs" \
  elastic/filebeat:7.13.2 filebeat -e -strict.perms=false
When creating a filebeat container, you first need to create filebeat YML, mount the logs of the host to the filebeat container to facilitate log collection -- volume="/usr/local/logs:/usr/local/logs"
filebeat.yml file
###################### Filebeat Configuration Example #########################
filebeat.prospectors:

- input_type: log

  paths:
    ## app - service name log, why is the write dead to prevent rotation from capturing historical data
    - /usr/local/logs/app-collector.log
  #Define when writing to ES_ type value
  document_type: "app-log"
  multiline:
    #pattern: '^\s*(\d{4}|\d{2})\-(\d{2}|[a-zA-Z]{3})\-(\d{2}|\d{4})'   # Specify the matching expression (match the string beginning with the time format of 2017-11-15 08:04:23:889)
    pattern: '^\['                              # Specify a matching expression (matching a string starting with '{')
    negate: true                                # Match to
    match: after                                # Merge to the end of the previous line
    max_lines: 2000                             # Maximum number of rows
    timeout: 2s                                 # If there is no new log event within the specified time, it will not wait for the subsequent log
  fields:
    logbiz: collector
    logtopic: app-log-collector   ## Used as kafka topic by service
    evn: dev

- input_type: log

  paths:
    - /usr/local/logs/error-collector.log
  document_type: "error-log"
  multiline:
    #pattern: '^\s*(\d{4}|\d{2})\-(\d{2}|[a-zA-Z]{3})\-(\d{2}|\d{4})'   # Specify the matching expression (match the string beginning with the time format of 2017-11-15 08:04:23:889)
    pattern: '^\['                              # Specify a matching expression (matching a string starting with '{')
    negate: true                                # Match to
    match: after                                # Merge to the end of the previous line
    max_lines: 2000                             # Maximum number of rows
    timeout: 2s                                 # If there is no new log event within the specified time, it will not wait for the subsequent log
  fields:
    logbiz: collector
    logtopic: error-log-collector   ## Used as kafka topic by service
    evn: dev

output.kafka:
  enabled: true
  #Replace with your own es address
  hosts: ["localhost:9092"]
  topic: '%{[fields.logtopic]}'
  partition.hash:
    reachable_only: true
  compression: gzip
  max_message_bytes: 1000000
  required_acks: 1
logging.to_files: true
When filebeat uses kafka, it needs to build its own kafka environment. How to use kafka will be provided later. First, build the kafka environment and the log configuration environment of the project
Docker compose build filebeat
docker-filebeat.yml
version: '2'
services:
  filebeat:
    image: "elastic/filebeat:7.13.2"
    container_name: filebeat
    volumes:
      - "/usr/local/filebeat/filebeat.yml:/usr/share/filebeat/filebeat.yml:ro"
      - "/usr/local/logs:/usr/local/logs"
    environment:
      strict.perms: false
Create container
docker-compose apply -f docker-filebeat.yml
Use of filebeat and logstash basic syntax
filebeat usage
## file plug-in
input {
    file {
        path => ["/var/log/*.log", "/var/log/message"]
        type => "system"
        start_position => "beginning"
    }
}
## Other parameters:
discover_interval ## Indicates how often files are detected. The default is 15 seconds
exclude ## Indicates that those files are excluded
close_older ## If the file has not been updated for more than a long time, turn off listening. The default is 3600s
ignore_older ## Check the file list every time. If the last modification time of a file exceeds this value, the file 86400s will be ignored
sincedb_path ## sincedb is the location where the file is saved. By default, it exists in home (/ dev/null)
sincedb_write_interval ## How often do you record it? The default is 15 seconds
stat_interval ## How often do you query the file status? The default is 1 second
start_position ## Read from the beginning or from the end
logstash usage
- Logstash designed its own DSL, including region, annotation, data type (Boolean, string, value, array, hash), conditional judgment, field reference.
- Logstash uses {} to define areas. The area can include plug-in area definitions. You can define multiple plug-ins in one area. Key value pair settings can be defined in the plug-in area.
- Format, syntax and usage:
## Description of configuration file under conf:
# Logstash configuration file: / config / logstash yml
# JVM parameter file: / config / JVM options
# Log format configuration file: log4j2 properties
# Create Linux service parameters: / config / startup options

## Profile description:
vim /usr/local/logstash-6.6.0/config/logstash.yml

--path.config or –f : logstash Profile used at startup
--configtest or –t: test Logstash Whether the syntax of the read configuration file can be parsed normally
--log or-l: Log output storage location
--pipeline.workers or –w: function filter and output of pipeline Number of threads. The default is CPU Number of cores.
--pipeline.batch.size or –b: each Logstash pipeline Thread, in the execution of specific filter and output The maximum number of log entries that can be accumulated before the function.
--pipeline.batch.delay or –u: each Logstash pipeline Thread, wait for a few milliseconds at most when packaging batch logs.
--verbose: Output debug log
--debug: Output more debug logs

## Virtual machine configuration
vim /usr/local/logstash-6.6.0/config/jvm.options

## Startup configuration, such as java location at startup, LS home, etc
vim /usr/local/logstash-6.6.0/config/startup.options

## Data collection Directory: / usr / local / logstash-6.6 0/data
## Plug in directory: / usr / local / logstash-6.6 0/vendor/bundle/jruby/1.9/gems
## View plug-in commands:
/usr/local/logstash-6.6.0/bin/logstash-plugin list
## Update plug-in command:
/usr/local/logstash-6.6.0/bin/logstash-plugin update logstash-xxxx-xxxxx
## Install plug-in command:
/usr/local/logstash-6.6.0/bin/logstash-plugin install logstash-xxxx-xxxxx
## Plug in address: https://github.com/logstash-plugins
logstash.conf configuration file
## The multiline plug-in can also be used for other similar stack information, such as linux kernel logs.
input {
  kafka {
    ## App log service name
    topics_pattern => "app-log-.*"
    bootstrap_servers => "localhost:9092"
	codec => json
	consumer_threads => 1	## Increase the number of parallel consumption threads of consumer
	decorate_events => true
    #auto_offset_rest => "latest"
	group_id => "app-log-group"
   }

   kafka {
    ## Error log - service name
    topics_pattern => "error-log-.*"
    bootstrap_servers => "localhost:9092"
	codec => json
	consumer_threads => 1
	decorate_events => true
    #auto_offset_rest => "latest"
	group_id => "error-log-group"
   }

}

filter {

  ## Time zone conversion
  ruby {
	code => "event.set('index_time',event.timestamp.time.localtime.strftime('%Y.%m.%d'))"
  }

  if "app-log" in [fields][logtopic]{
    grok {
        ## expression
        match => ["message", "\[%{NOTSPACE:currentDateTime}\] \[%{NOTSPACE:level}\] \[%{NOTSPACE:thread-id}\] \[%{NOTSPACE:class}\] \[%{DATA:hostName}\] \[%{DATA:ip}\] \[%{DATA:applicationName}\] \[%{DATA:location}\] \[%{DATA:messageInfo}\] ## (\'\'|%{QUOTEDSTRING:throwable})"]
    }
  }

  if "error-log" in [fields][logtopic]{
    grok {
        ## expression
        match => ["message", "\[%{NOTSPACE:currentDateTime}\] \[%{NOTSPACE:level}\] \[%{NOTSPACE:thread-id}\] \[%{NOTSPACE:class}\] \[%{DATA:hostName}\] \[%{DATA:ip}\] \[%{DATA:applicationName}\] \[%{DATA:location}\] \[%{DATA:messageInfo}\] ## (\'\'|%{QUOTEDSTRING:throwable})"]
    }
  }

}

## Test output to console:
output {
  stdout { codec => rubydebug }
}


## elasticsearch:
output {

  if "app-log" in [fields][logtopic]{
	## es plug-in
	elasticsearch {
  	    # es service address
        hosts => ["localhost:9200"]
        # Username and password
        user => "elastic"
        password => "123456"
        ## If the index name starts with the + sign, it will be automatically regarded as followed by the time format:
        ## javalog-app-service-2019.01.23
        index => "app-log-%{[fields][logbiz]}-%{index_time}"
        # Sniff cluster ip: generally set to true; http://localhost:9200/_nodes/http?pretty
        # Load balancing of es cluster through sniffing mechanism and sending log messages
        sniffing => true
        # logstash comes with a mapping template by default to overwrite the template
        template_overwrite => true
    }
  }

  if "error-log" in [fields][logtopic]{
	elasticsearch {
        hosts => ["localhost:9200"]
        user => "elastic"
        password => "123456"
        index => "error-log-%{[fields][logbiz]}-%{index_time}"
        sniffing => true
        template_overwrite => true
    }
  }


}
logstash uses kafka and needs to build its own kafka environment. How to use kafka will be provided later. First, build the kafka environment and the log configuration environment of the project
Building kafka environment with docker
Pull image
docker pull hlebalbau/kafka-manager:stable
Create container
docker run -d --name=kafka 9092:9092 -e KAFKA_ADVERTISED_HOST_NAME=localhost -e KAFKA_ZOOKEEPER_CONNECT=localhost:2181
KAFKA_ADVERTISED_HOST_NAME: Internet access configuration, and the ECS fills in the public ip address
KAFKA_ZOOKEEPER_CONNECT zookeeper connection address
docker run -d --name=zookeeper -p 2181:2181 zookeeper docker create zookeeper
Using docker compose to build kafka environment
version: '1'
services:
  zookeeper:
    image: zookeeper
    ports:
      - "2181:2181"
  kafka:
    image: wurstmeister/kafka
    ports:
      - "9092:9092"
    environment:
      KAFKA_ADVERTISED_HOST_NAME: localhost
      KAFKA_ZOOKEEPER_CONNECT: zookeeper:2181
springboot project log file configuration
log4j2.xml configuration
<?xml version="1.0" encoding="UTF-8"?>
<Configuration status="INFO" schema="Log4J-V2.0.xsd" monitorInterval="600" >
    <Properties>
        <Property name="LOG_HOME">logs</Property>
        <property name="FILE_NAME">collector</property>
        <property name="patternLayout">[%d{yyyy-MM-dd'T'HH:mm:ss.SSSZZ}] [%level{length=5}] [%thread-%tid] [%logger] [%X{hostName}] [%X{ip}] [%X{applicationName}] [%F,%L,%C,%M] [%m] ## '%ex'%n</property>
    </Properties>
    <Appenders>
        <Console name="CONSOLE" target="SYSTEM_OUT">
            <PatternLayout pattern="${patternLayout}"/>
        </Console>
        <RollingRandomAccessFile name="appAppender" fileName="${LOG_HOME}/app-${FILE_NAME}.log" filePattern="${LOG_HOME}/app-${FILE_NAME}-%d{yyyy-MM-dd}-%i.log" >
          <PatternLayout pattern="${patternLayout}" />
          <Policies>
              <TimeBasedTriggeringPolicy interval="1"/>
              <SizeBasedTriggeringPolicy size="500MB"/>
          </Policies>
          <DefaultRolloverStrategy max="20"/>
        </RollingRandomAccessFile>
        <RollingRandomAccessFile name="errorAppender" fileName="${LOG_HOME}/error-${FILE_NAME}.log" filePattern="${LOG_HOME}/error-${FILE_NAME}-%d{yyyy-MM-dd}-%i.log" >
          <PatternLayout pattern="${patternLayout}" />
          <Filters>
              <ThresholdFilter level="warn" onMatch="ACCEPT" onMismatch="DENY"/>
          </Filters>
          <Policies>
              <TimeBasedTriggeringPolicy interval="1"/>
              <SizeBasedTriggeringPolicy size="500MB"/>
          </Policies>
          <DefaultRolloverStrategy max="20"/>
        </RollingRandomAccessFile>
    </Appenders>
    <Loggers>
        <!-- Business related asynchronous logger -->
        <AsyncLogger name="com.qiangge.*" level="info" includeLocation="true">
          <AppenderRef ref="appAppender"/>
        </AsyncLogger>
        <AsyncLogger name="com.qiangge.*" level="info" includeLocation="true">
          <AppenderRef ref="errorAppender"/>
        </AsyncLogger>
        <Root level="info">
            <Appender-Ref ref="CONSOLE"/>
            <Appender-Ref ref="appAppender"/>
            <AppenderRef ref="errorAppender"/>
        </Root>
    </Loggers>
</Configuration>
last
Set logstash Copy conf to the elk container / etc/logstash/conf.d/ directory, restart elk, and filebeat sends the log file information to the kakfa queue. Logstash consumes the messages in the kafka queue, and then collects them in the es for Kibana to display. If you don't understand anything, you can comment and leave a message.
Follow up will continue to update the use of ELK nearby friends function, pay attention to my technical official account.