
What is Arthas
Excerpt from a profile on the official Github
Arthas is an open source Java diagnostic tool of Alibaba, which is deeply loved by developers.
When you encounter the following similar problems and are helpless, Arthas can help you solve them:
- Which jar package is this class loaded from? Why are all kinds of related exceptions reported?
- Why didn't the code I changed execute? Am I not commit ted? Wrong branch?
- You can't debug online when you encounter a problem. Can you only republish it by adding a log?
- There is a problem with the data processing of a user online, but it is also impossible to debug online and reproduce offline!
- Is there a global perspective to view the health of the system?
- Is there any way to monitor the real-time running status of the JVM?
Arthas supports JDK 6 +, Linux/Mac/Windows, adopts command-line interaction mode, and provides rich Tab automatic completion functions to further facilitate problem location and diagnosis.
What tools is Arthas based on
- Greys anatomy: the Arthas code is based on the secondary development of greys. Thank you very much for all the previous work of greys and the comments and suggestions put forward by the original author of greys on Arthas!
- termd: Arthas's command line implementation is based on termd development. It is an excellent command line program development framework. Thank termd for providing an excellent framework.
- Crash: the text rendering function of Arthas is developed based on the text rendering function in crash. You can see the source code here. Thank crash for its excellent work in this regard.
- CLI: the command line interface of Arthas is based on vert X provides cli library for development, thank vert X has done excellent work in this regard.
- Compiler: code source of memory compiler in Arthas
- Apache commons net: Telnet Client code source in Arthas
- JavaAgent: an interceptor running before the main method. Its internal method is called premain, that is, execute the premain method first and then the main method
- ASM: a general Java bytecode operation and analysis framework. It can be used to modify existing classes or dynamically generate classes directly in binary form. ASM provides some common bytecode conversion and analysis algorithms from which you can build custom complex conversion and code analysis tools. ASM provides functionality similar to other Java bytecode frameworks, but focuses on performance. Because it is designed and implemented as small and fast as possible, it is very suitable for use in dynamic systems (of course, it can also be used statically, such as in compilers)
The only pity is that arthas does not have jmap histo function, which can print the number and memory size of all objects online
start-up
Start command
java -jar arthas-boot.jar
- 1
You must exit normally when arthas is not used. The command is as follows:
- quit: just exit the current connection. The arthas attached to the target process will continue to run, and the port will remain open. Execute Java - jar arthas boot when connecting next time Jar can be directly connected to.
- exit: the same function as the quit command;
- stop: completely exit arthas,
If it is an abnormal exit, the following error will be reported, indicating that the port is occupied. The reason is that a process was connected last time and did not exit normally.
[ERROR] The telnet port 3658 is used by process 3804 instead of target process 15043, you will connect to an unexpected process.
[ERROR] 1. Try to restart arthas-boot, select process 3804, shutdown it first with running the 'stop' command.
[ERROR] 2. Or try to stop the existing arthas instance: java -jar arthas-client.jar 127.0.0.1 3658 -c "stop"
[ERROR] 3. Or try to use different telnet port, for example: java -jar arthas-boot.jar --telnet-port 9998 --http-port -1
- 1
- 2
- 3
- 4
Note: arthas depends on jdk environment variables and some jdk built-in tools, such as jps. If there is only jre environment but no jdk environment on the server, there is no jps, so arthas will also report an error;
arthas all commands
After starting arthas, enter help on the command line to view the command help information, the instructions supported by the current arthas version, or the instructions for specific instructions. All commands are as follows:
Basic command
| command | explain |
|---|---|
| cls | Clear the current screen area. |
| session | View the information of the current session, and display the currently bound pid and session id. |
| reset | Reset the enhanced classes to restore all the classes enhanced by Arthas. When Arthas server stop s, all the enhanced classes will be reset |
| version | Output the version number of Arthas loaded by the current target Java process |
| history | Print the history command, and print out which commands you entered in the process of using arthas. |
| keymap | Shortcut key mapping table of output arthas: |
Advanced command
| command | explain |
|---|---|
| dashboard | View the real-time data panel of the current system, such as server thread information, memory, GC recycling, etc |
| thread | View the stack information of the thread |
| jvm | Print out the jvm information, including parameters and variables, as well as the jvm name, system, etc |
| sysprop | View the system property of the current JVM |
| sysenv | View the environment properties of the current JVM (System Environment Variables) |
| vmoption | View and update parameters related to VM diagnosis |
| perfcounter | View Perf Counter information of the current JVM |
| logger | View the logger information and update the logger level |
| mbean | This command can easily view or monitor the attribute information of MBeans. |
| getstatic | You can easily view the static properties of a class through the getstatic command. The use method is getstatic class_name field_name, it is recommended to use the ognl command directly, which is more flexible. |
| ognl | Execute ognl expression, which can execute code dynamically |
| sc | View the class information loaded by the JVM to see which jar package the class is in |
| sm | View the method information of the loaded class |
| dump | dump has loaded the bytecode of the class to a specific directory |
| heapdump | dump java heap, similar to the heap dump function of jmap command. |
| vmtool | vmtool uses the JVMTI interface to query memory objects and force GC. |
| jad | Decompile the source code of the specified loaded class |
| classloader | View the inheritance tree, urls, and class loading information of the classloader |
| mc | Memory Compiler / Memory Compiler, compiling java file generation class. |
| retransform | Load external class file to dynamically reload the classes loaded by the jvm. |
| redefine | Load external Class file, redefine the loaded classes of the JVM. This method only modifies the runtime memory. If the class file is not changed, the service restart will fail. It is recommended to use the retransform command |
| monitor | Method execution monitoring |
| watch | Method to perform data observation, so that you can easily observe the call of the specified method. The observed range is: return value, throw exception and enter parameter. View the corresponding variables by writing OGNL expression. |
| trace | The internal call path of the method and output the time-consuming on each node on the method path. The trace command can actively search the method call path corresponding to class pattern / method pattern, render and count all the performance overhead on the whole call link and track the call link. |
| stack | Output the call path where the current method is called |
| tt | Method executes the spatiotemporal tunnel of data, records the input and return information of each call of the specified method, and can observe these different time calls |
| profiler | The profiler command supports the generation of flame diagrams of application hotspots. In essence, it is through continuous sampling, and then the collected sampling results are generated into a flame diagram. |
| cat | Print the contents of the file, similar to the cat command in linux. |
| echo | Print parameters, similar to echo command in linux |
| grep | Similar to the traditional grep command |
| base64 | Base64 encoding conversion is similar to the base64 command in linux. |
| tee | Similar to the traditional tee command, it is used to read the standard input data and output its contents to a file. |
| pwd | Returns the current working directory, similar to the linux command |
| auth | Verify current session |
| options | The configuration switch of the system can be turned on and off |
Command introduction
Here we mainly introduce the commonly used arthas commands, not every command. Some commands are inherited from linux, and there is no need to introduce them.
Session view the information of the current session
This command is very simple. It just prints the pid and session id of the process. Note that it is the process id of java, not the process id of arthas;
[arthas@12771]$ session
 Name        Value
--------------------------------------------------
 JAVA_PID    12771
 SESSION_ID  41d19baa-2064-442a-acf1-b8ac11801265
- 1
- 2
- 3
- 4
- 5
History print command history
After starting arthas, all the commands you have entered will be recorded, and history will print out your input history
- history 5: view the 5 recently executed instructions
- history -c: clear the entered history instruction
quit quits the current arthas client
Only exit the current Arthas client, and other Arthas clients will not be affected. It is equivalent to the exit, logout and q instructions.
stop close the Arthas server
After the stop command is executed, all Arthas clients exit. All enhancement classes will be reset before shutting down the Arthas server. However, the class content reloaded with redefine will not be reset.
dashboard command to view the real-time data panel of the current system
View the real-time data panel of the current system, such as server thread information, memory memory, GC recycling, etc
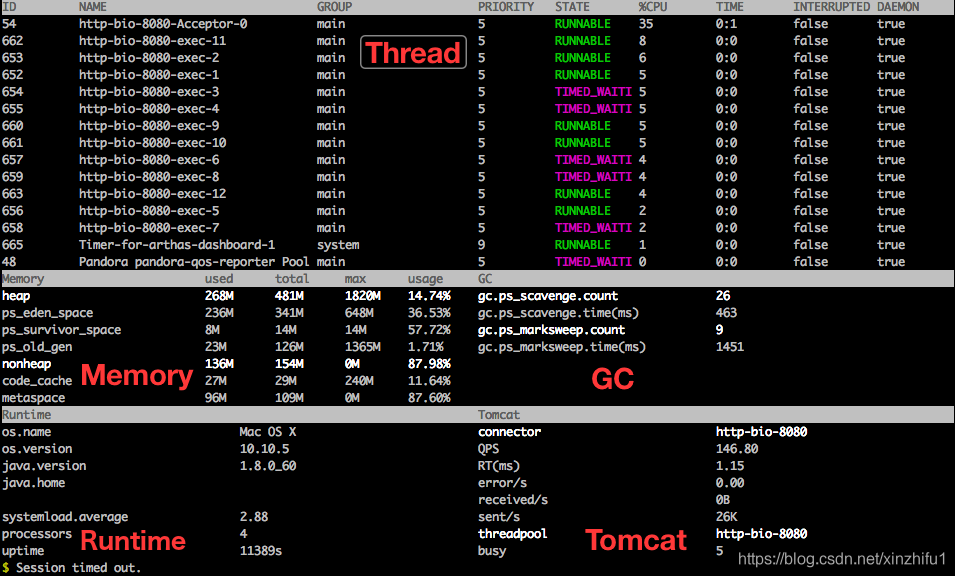
Data column description
- ID: Java level thread ID. note that this ID cannot correspond to the nativeID in jstack one by one.
- NAME: thread NAME
- GROUP: thread GROUP name
- PRIORITY: thread PRIORITY, a number between 1 and 10. The higher the PRIORITY, the higher the PRIORITY
- STATE: the STATE of the thread
- cpu%: cpu utilization of threads. For example, if the sampling interval is 1000ms and the incremental cpu time of a thread is 100ms, the cpu utilization rate = 100 / 1000 = 10%
- DELTA_TIME: the incremental CPU time of the thread since the last sampling. The data format is seconds
- TIME: the total CPU TIME of the thread. The data format is minutes: seconds
- INTERRUPTED: the current interrupt bit status of the thread
- daemon: is it a daemon thread
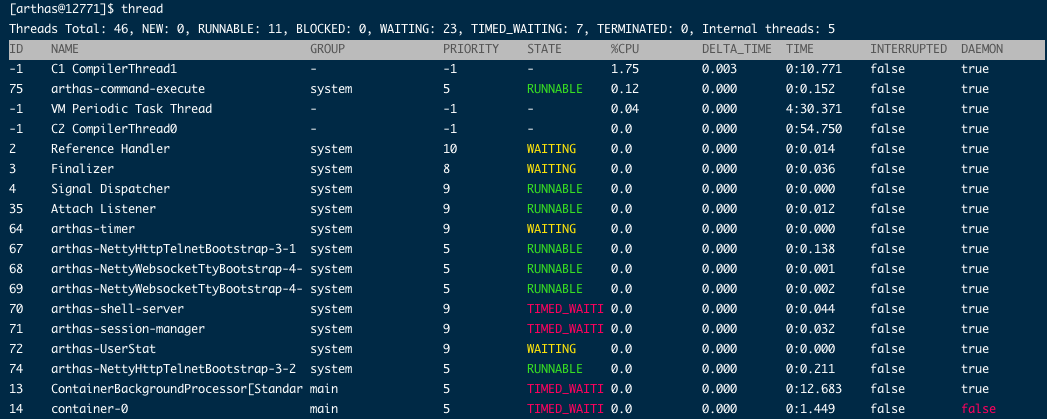
JVM internal thread
After Java 8, it supports obtaining the CPU time of JVM internal threads. These threads only have name and CPU time, and do not have ID and status information (the display ID is - 1). Through internal threads, you can observe the CPU consumption of JVM activities, such as GC and JIT compilation, so as to understand the overall running status of the JVM.
Set refresh interval and times
In addition, the panel will be refreshed every 5 seconds by default, and will be refreshed all the time. If you want to specify the refresh times and interval, you can write this:
dashboard dashboard -i 1000 -n 2
- 1
-i represents the refresh interval, unit (MS), - n table represents the number of queries. After reaching the specified number of times, it will automatically exit the dashboard panel;
Thread view the stack information of the thread
When there are no parameters, the thread information on the first page is displayed by default: thread
View the stack of a thread: thread 13, 13 is the id of the thread
[arthas@12771]$ thread 13
"ContainerBackgroundProcessor[StandardEngine[Tomcat]]" Id=13 TIMED_WAITING
    at java.lang.Thread.sleep(Native Method)
    at org.apache.catalina.core.ContainerBase$ContainerBackgroundProcessor.run(ContainerBase.java:1368)
at java.lang.Thread.run(Thread.java:748)- 1
- 2
- 3
- 4
- 5
In addition, thread has other uses
- thread -n 5: print the first five busiest threads and print the stack
- thread -all: displays all matching threads
- thread -n 3 -i 1000: list the 3 busiest thread stacks within 1000ms
- thread – state WAITING to view the threads in the specified state (TIMED_WAITI, WAITING, RUNNABLE, etc.)
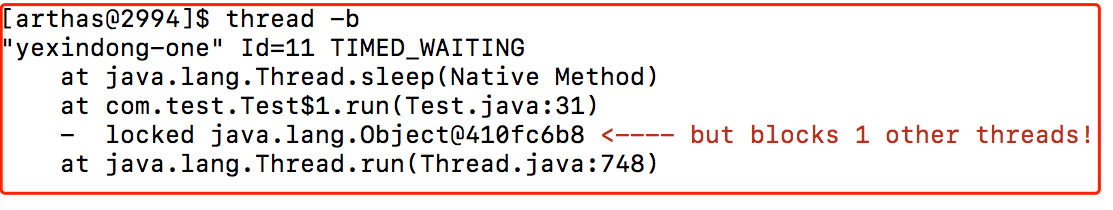
- thread -b: find out the thread blocking other threads. When a deadlock occurs, you will be prompted where the deadlock occurs. The code is as follows
    static Object obj = new Object();
    public static void main(String[] args) throws InterruptedException, IOException {
        new Thread(new Runnable() {
            @Override
            public void run() {
                try {
                    synchronized (obj) {
                        System.out.println("I'm the first thread");
                        Thread.sleep(100000);
                    }
                } catch (InterruptedException e) {
                    e.printStackTrace();
                }
            }
        },"yexindong-one").start();

        Thread.sleep(1000);
        new Thread(new Runnable() {
            @Override
            public void run() {
                synchronized (obj) {
                    System.out.println("I'm the second thread");
                }
            }
        },"yexindong-two").start();
}- 1
- 2
- 3
- 4
- 5
- 6
- 7
- 8
- 9
- 10
- 11
- 12
- 13
- 14
- 15
- 16
- 17
- 18
- 19
- 20
- 21
- 22
- 23
- 24
- 25
- 26
JVM view current JVM information
jvm displays the data summary of the jvm, which is divided into the following sections
- runtime: including jvm start time, startup parameters, and class_path et al
- Class loading: the number of loaded classes, the total number of loaded classes, and the number of unloaded classes
- Garbage collectors: displays the garbage collectors used and the number of garbage collections
- Memory: heap memory space usage
- thread: total number of threads, number of daemon threads, and number of deadlocks
The thread related information is as follows
- Count: the number of threads currently active in the JVM
- Daemon-count: the number of daemon threads currently active in the JVM
- PEAK-COUNT: the maximum number of threads that have been alive since the JVM was started
- STARTED-COUNT: the total number of threads started since the JVM was started
- Deadlock-count: the number of threads currently deadlocked by the JVM
vmoption view / update virtual machine parameters
This command can see which parameters our java project has set at runtime. If the command has no parameters, all vm parameters will be printed
[arthas@12771]$ vmoption
 KEY                                  VALUE                                ORIGIN                               WRITEABLE
----------------------------------------------------------------------------------------------------------------------------------------------------
 HeapDumpBeforeFullGC                 false                                DEFAULT                              true
 HeapDumpAfterFullGC                  false                                DEFAULT                              true
 HeapDumpOnOutOfMemoryError           false                                DEFAULT                              true
 HeapDumpPath                                                              DEFAULT                              true
 CMSAbortablePrecleanWaitMillis       100                                  DEFAULT                              true
 CMSWaitDuration                      2000                                 DEFAULT                              true
 CMSTriggerInterval                   -1                                   DEFAULT                              true
 PrintGC                              false                                DEFAULT                              true
 PrintGCDetails                       false                                DEFAULT                              true
 PrintGCDateStamps                    false                                DEFAULT                              true
 PrintGCTimeStamps                    false                                DEFAULT                              true
 PrintGCID                            false                                DEFAULT                              true
 PrintClassHistogramBeforeFullGC      false                                DEFAULT                              true
 PrintClassHistogramAfterFullGC       false                                DEFAULT                              true
 PrintClassHistogram                  false                                DEFAULT                              true
 MinHeapFreeRatio                     40                                   DEFAULT                              true
 MaxHeapFreeRatio                     70                                   DEFAULT                              true
 PrintConcurrentLocks                 false                                DEFAULT                              true
- 1
- 2
- 3
- 4
- 5
- 6
- 7
- 8
- 9
- 10
- 11
- 12
- 13
- 14
- 15
- 16
- 17
- 18
- 19
- 20
- 21
In addition, you can also view single parameters and dynamically set parameters. Here, you can dynamically update parameters without restarting the java process;
- vmoption PrintGCDetails view the specified vm parameters
- vmoption PrintGCDetails true updates the specified vm parameters
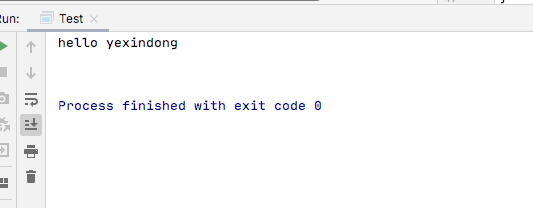
ognl dynamic code execution
Call static method: ognl '@ Java lang. System@out.println ("Hello yexindong") ", after execution, you can see that hello yexindong is printed on the console;
sc view the class information loaded by the jvm
Simple usage sc.com test. Test, if the jvm has loaded this class, it will print out the full class name of the class,
[arthas@3568]$ sc com.test.Test
com.test.Test
Affect(row-cnt:1) cost in 4 ms.
- 1
- 2
- 3
However, such information is too simple. With the - d parameter, you can print the details of the class, and you can also see which jar package your class is in. The command is as follows
sc -d com.test.Test
- 1
The printing results are as follows
[arthas@3568]$ sc -d *.Test
 class-info        com.test.Test
 code-source       /Users/yexindong/Documents/java/java_project/Test/target/cla
                   sses/
 name              com.test.Test
 isInterface       false
 isAnnotation      false
 isEnum            false
 isAnonymousClass  false
 isArray           false
 isLocalClass      false
 isMemberClass     false
 isPrimitive       false
 isSynthetic       false
 simple-name       Test
 modifier          public
 annotation
 interfaces
 super-class       +-java.lang.Object
 class-loader      +-sun.misc.Launcher$AppClassLoader@18b4aac2
                     +-sun.misc.Launcher$ExtClassLoader@3df8ac7c
 classLoaderHash   18b4aac2

Affect(row-cnt:1) cost in 17 ms.- 1
- 2
- 3
- 4
- 5
- 6
- 7
- 8
- 9
- 10
- 11
- 12
- 13
- 14
- 15
- 16
- 17
- 18
- 19
- 20
- 21
- 22
- 23
- 24
In addition, you can use fuzzy queries
- sc -d *.Test: query all classes named test
- sc -d com.*: Query all classes under the com package and traverse all sub packages
sm view loaded class method information
Query all methods under a class
[arthas@3568]$ sm com.test.Test
com.test.Test <init>()V
com.test.Test main([Ljava/lang/String;)V
Affect(row-cnt:2) cost in 4 ms.
- 1
- 2
- 3
- 4
The results show that there are two methods, one is the main method and the other is the construction method. If you do not use the construction method, the construction method will be automatically generated during compilation;
In addition, you can add details of the - d printing method: SM - d com test. Test
[arthas@3568]$ sm -d com.test.Test
 declaring-class   com.test.Test
 constructor-name  <init>
 modifier          public
 annotation
 parameters
 exceptions
 classLoaderHash   18b4aac2

 declaring-class  com.test.Test
 method-name      main
 modifier         public,static
 annotation
 parameters       java.lang.String[]
 return           void
 exceptions       java.lang.InterruptedException
                  java.io.IOException
 classLoaderHash  18b4aac2

Affect(row-cnt:2) cost in 6 ms.- 1
- 2
- 3
- 4
- 5
- 6
- 7
- 8
- 9
- 10
- 11
- 12
- 13
- 14
- 15
- 16
- 17
- 18
- 19
- 20
In addition, you can print a method in the class: SM - D com test. Test main
# The main method information is printed here
[arthas@3568]$ sm -d com.test.Test main
 declaring-class  com.test.Test
 method-name      main
 modifier         public,static
 annotation
 parameters       java.lang.String[]
 return           void
 exceptions       java.lang.InterruptedException
                  java.io.IOException
 classLoaderHash  18b4aac2

Affect(row-cnt:1) cost in 4 ms.- 1
- 2
- 3
- 4
- 5
- 6
- 7
- 8
- 9
- 10
- 11
- 12
- 13
dump exports the class bytecode file of a class to the specified directory
The biggest advantage of this function is that it can export a specified class. For example, I want to export test Class file to the specified directory. It can be written like this
dump -d /Users/yexindong/Downloads com.test.Test
- 1
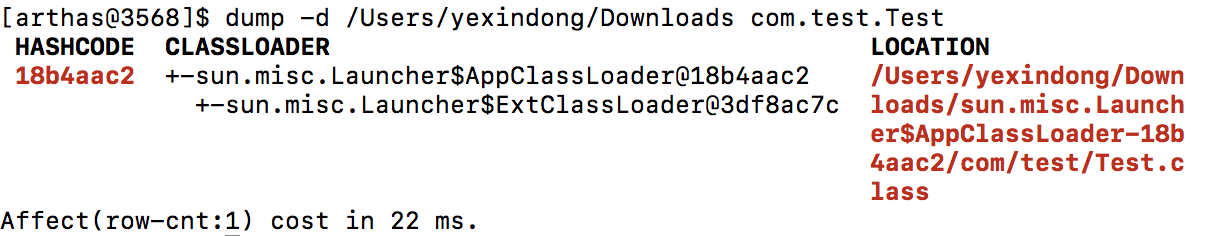
Then you can see the class file just exported in the specified directory
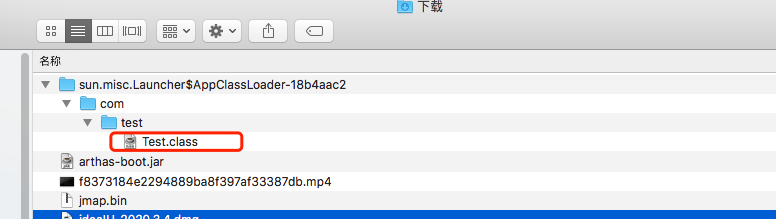
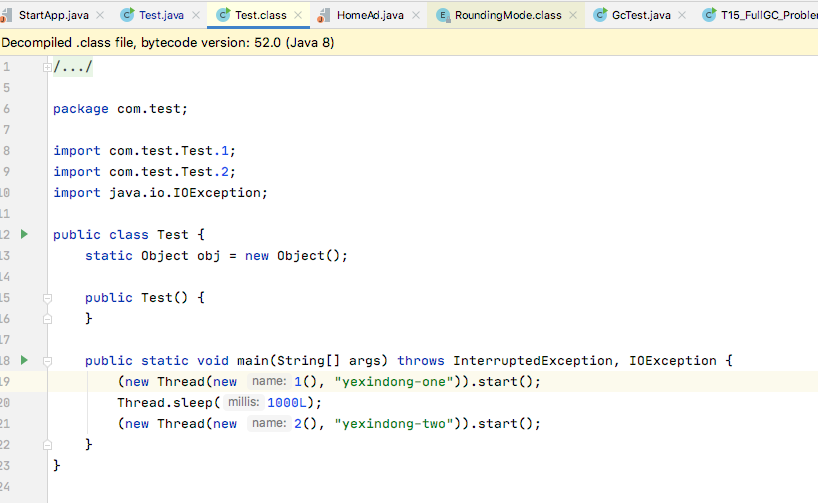
The decompiled class file is like this
In addition, you can also use - c or -- classLoaderClass to export the class loaded by the class loader of the specified hashcode
dump -c 3d4eac69 demo.* Or dump -- classloaderclass sun misc. Launcher$AppClassLoader demo.*
heapdump export heap dump file
This command is similar to the jmap of jdk. The exported file is a binary file. The export command: heapdump. When no parameters are specified, all classes will be exported, and a temporary directory will be automatically created somewhere on the disk, where the binary file is located;
[arthas@28747]$ heapdump
Dumping heap to /var/folders/yq/mz0mh34s2s58zpj3sf7c9d800000gn/T/heapdump2021-07-19-16-321079309703341992219.hprof ...
Heap dump file created
- 1
- 2
- 3
If you want to export only surviving objects and store them in the specified directory, you can write this
heapdump --live /tmp/dump.hprof
- 1
- --live means that only surviving objects are exported
- /tmp/dump.hprof indicates which directory to export to and specifies the file name;
jad decompile class file
The decompilation here is relatively simple. You only need to enter the full class name to decompile the source code: jad com test. Test, after executing the jad command, it will also print out the directory of the class loader and class file
[arthas@3568]$ jad com.test.Test

ClassLoader:
+-sun.misc.Launcher$AppClassLoader@18b4aac2
  +-sun.misc.Launcher$ExtClassLoader@3df8ac7c

Location:
/Users/yexindong/Documents/java/java_project/Test/target/classes/

       /*
        * Decompiled with CFR.
        */
       package com.test;

       import java.io.IOException;

       public class Test {

           public static void main(String[] args) throws InterruptedException, IOException {
               System.out.println("hello would");
           }
       }

Affect(row-cnt:3) cost in 643 ms.- 1
- 2
- 3
- 4
- 5
- 6
- 7
- 8
- 9
- 10
- 11
- 12
- 13
- 14
- 15
- 16
- 17
- 18
- 19
- 20
- 21
- 22
- 23
- 24
In addition, jad can decompile a method in the class. The following code only compiles the main method and does not display the line number. The default value of lineNumber is true. Now we set it to false to not display the line number;
jad com.test.Test main --lineNumber false
- 1
mc memory compiler, compiler java file generation class.
It is also very simple to use. Just add the java file to be compiled after mc
mc /tmp/Test.java
- 1
You can also use the -- classLoaderClass parameter to specify the class loader and the - d command to specify the output directory
mc --classLoaderClass org.springframework.boot.loader.LaunchedURLClassLoader /tmp/UserController.java -d /tmp
- 1
Compile and generate class file, you can implement the hot update code in combination with the retransform command.
retransform loads external class file
The following command loads the specified class file
retransform /tmp/Test.class
- 1
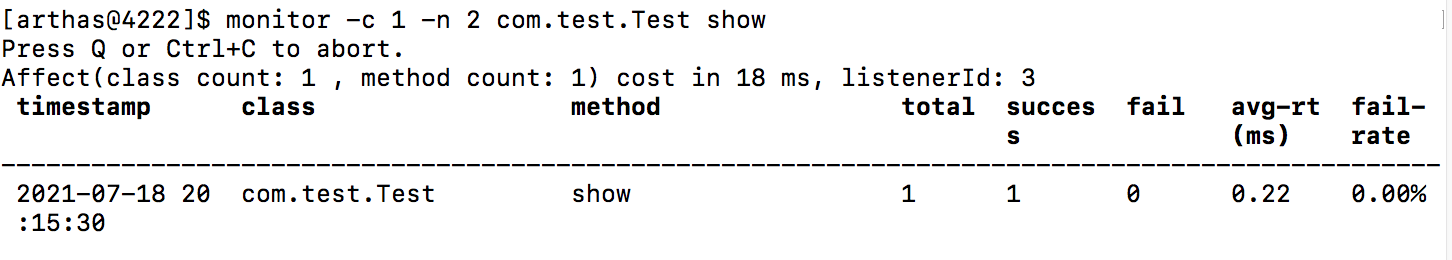
The monitor method performs monitoring
Execute the following command to start monitoring the method,
monitor -c 1 -n 2 com.test.Test show
- 1
- Where - c 1 indicates the monitoring cycle, which is monitored every second. If it is not specified, the default is 120 second cycle
- -n 2 means monitoring twice in total. The monitoring method is the show() method in the Test class. If it is not specified, it will be monitored all the time
The monitoring results are as follows:
Description of monitoring results
| Monitoring item | explain |
|---|---|
| timestamp | time stamp |
| class | Java class |
| method | Method (construction method, general method) |
| total | Number of calls |
| success | Success times |
| fail | Number of failures |
| rt | Average RT |
| fail-rate | Failure rate |
The watch method performs data observation
The watch command allows users to easily observe the call of the specified method. The observed range is: return value, throw exception and enter parameter. View the corresponding variables by writing OGNL expression.
1. The following commands are used to observe the return value of the method,
watch com.test.Test show "{params,returnObj}" -x 2 -b -e -s -f- 1
- The observed method is the show() method under the Test class,
- "{params,returnObj}" is an observation expression and an ognl expression,
- -x 2 is the attribute traversal depth of the specified output result. The default value is 1. When it is 1, you can't see the specific value of the parameter, but only the type;
- -b: Observe before the method is called. Use this command to view the input parameters of the method
- -e: Observe after the method is abnormal. Use this command to view the exceptions thrown by the method
- -s: After the method returns, you can view the return value of the method
- -f: After the method ends (normal return and exception return), you can view the return value and exception information of the method. By default, - F is turned on

trace method call chain
The trace command can actively search the method call path, output the time-consuming on each node on the method path, render and count all the performance overhead on the whole call link and track the call link.
Listen to the call chain of the show method under the test class: trace com test. Test show
[arthas@4805]$ trace com.test.Test show
Press Q or Ctrl+C to abort.
Affect(class count: 1 , method count: 1) cost in 28 ms, listenerId: 2
`---ts=2021-07-18 21:41:52;thread_name=main;id=1;is_daemon=false;priority=5;TCCL=sun.misc.Launcher$AppClassLoader@18b4aac2
    `---[0.884064ms] com.test.Test:show()
`---[0.135646ms] com.test.Test:showChild() #38- 1
- 2
- 3
- 4
- 5
- 6
It can be seen from the results that in the main thread, the show() method calls the showChild() method. The previous ms is the time spent calling the method,
Description of call chain properties
- thread_name: thread name
- id: internal thread id
- is_daemon: is it a daemon thread
- Priority: thread priority
- TCCL: class loader
stack outputs the call path where the current method is called
Similar to the trace command, the difference is that stack only outputs the call path, and stack can be filtered through expressions. Just like the following command, only the methods with the first parameter value of the show method greater than 320 are filtered, - n 2 means filtering twice
stack com.test.Test show 'params[0]>320' -n 2
- 1
results of enforcement
stack com.test.Test show 'params[0]>320' -n 2
Press Q or Ctrl+C to abort.
Affect(class count: 1 , method count: 1) cost in 17 ms, listenerId: 5
ts=2021-07-18 21:52:01;thread_name=main;id=1;is_daemon=false;priority=5;TCCL=sun.misc.Launcher$AppClassLoader@18b4aac2
    @com.test.Test.show()
        at com.test.Test.main(Test.java:27)

....One printing information is omitted here

Command execution times exceed limit: 2, so command will exit. You can set it with -n option.- 1
- 2
- 3
- 4
- 5
- 6
- 7
- 8
- 9
- 10
tt records the input and return information of each call of the specified method
Although watch is very convenient and flexible, it needs to think clearly in advance and observe the spelling of the expression, which is too demanding for troubleshooting problems, because we often don't know where the problem comes from and can only guess by clues.
At this time, if you can record all the input parameters, return values and exceptions thrown by the method call at that time, it will be very helpful to think and judge the whole problem.
So the TimeTunnel command was born. The implementation method is as follows
tt -t -n 3 com.test.Test show
- 1
- -t indicates the of this parameter, indicating that you want to record each execution of the show() method of Test class.
- -n 3: when you execute a method with low call volume, you may have enough time to interrupt the tt command recording process with CTRL+C. However, if you encounter a method with very large call volume, your JVM memory will burst in an instant. At this time, you can specify the number of times you need to record through the - n parameter. When the number of times you need to record is reached, Arthas will actively interrupt the recording process of tt command to avoid the situation that manual operation cannot be stopped.
The execution result of the command is as follows
[arthas@4805]$ tt  -t -n 3 com.test.Test show
Press Q or Ctrl+C to abort.
Affect(class count: 1 , method count: 1) cost in 16 ms, listenerId: 8
 INDE  TIMESTAMP      COST(  IS-R  IS-E  OBJECT     CLASS                  METHOD
 X                    ms)    ET    XP
------------------------------------------------------------------------------------------------
 1045  2021-07-18 21  0.327  true  fals  NULL       Test                   show
       :57:15         033          e
 1046  2021-07-18 21  0.100  true  fals  NULL       Test                   show
       :57:17         478          e
 1047  2021-07-18 21  0.160  true  fals  NULL       Test                   show
:57:19 673 e- 1
- 2
- 3
- 4
- 5
- 6
- 7
- 8
- 9
- 10
- 11
- 12
Result field description
| Table fields | Field interpretation |
|---|---|
| INDEX | Time segment record number. Each number represents a call. Many subsequent tt commands specify record operations based on this number, which is very important. |
| TIMESTAMP | Method, which records the local time of this time segment |
| COST(ms) | Time consuming method execution |
| IS-RET | Whether the method ends as a normal return |
| IS-EXP | Whether the method ends with an exception thrown |
| OBJECT | Execute the hashCode() of the object. Note that someone once mistakenly thought it was the memory address of the object in the JVM, but unfortunately it was not. But it can help you simply mark the class entity of the current execution method |
| CLASS | Class name of execution |
| METHOD | The name of the method to execute |
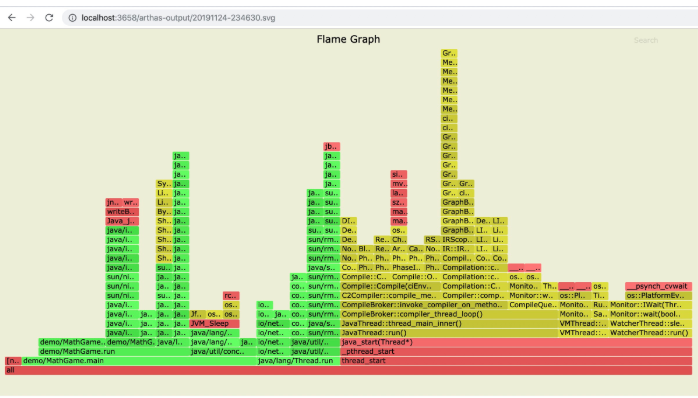
The profiler generates a flame diagram
Start profiler
 $ profiler start
 Started [cpu] profiling
- 1
- 2
Get the number of sample s collected
$ profiler getSamples
23
- 1
- 2
By viewing the profiler status, you can view which event and sampling time the current profiler is sampling
$ profiler status
[cpu] profiling is running for 4 seconds
- 1
- 2
Stop profiler - generate svg format results
$ profiler stop
profiler output file: /tmp/demo/arthas-output/20191125-135546.svg
OK
- 1
- 2
- 3
By default, the generated results are saved to the Arthas output directory under the working directory of the application. You can specify the output result path through the -- file parameter. For example:
$ profiler stop --file /tmp/output.svg
profiler output file: /tmp/output.svg
OK
- 1
- 2
- 3
Generate html format results
By default, the result file is in svg format. If you want to generate html format, you can use the – format parameter to specify:
$ profiler stop --format html
profiler output file: /tmp/test/arthas-output/20191125-143329.html
OK
- 1
- 2
- 3
Or use the file name to specify the name format in the – file parameter. For example – file / TMP / result html .
View the profiler results under Arthas output through the browser
By default, Arthas uses port 3658 to open: http://localhost:3658/arthas-output / view the profiler result under the Arthas output directory:
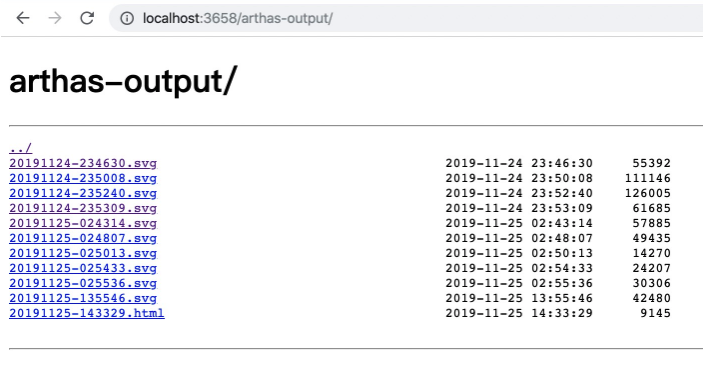
Click to view the specific results:
options global configuration switch
View all options
[arthas@4805]$ options
 LEVEL  TYPE   NAME         VALUE  SUMMARY              DESCRIPTION
------------------------------------------------------------------------------------------------
 0      boole  unsafe       false  Option to support s  This option enables to proxy functional
        an                         ystem-level class    ity of JVM classes. Due to serious secu
                                                        rity risk a JVM crash is possibly be in
                                                        troduced. Do not activate it unless you
                                                         are able to manage.
 1      boole  dump         false  Option to dump the   This option enables the enhanced classe
        an                         enhanced classes     s to be dumped to external file for fur
                                                        ther de-compilation and analysis.
 1      boole  batch-re-tr  true   Option to support b  This options enables to reTransform cla
        an     ansform             atch reTransform Cl  sses with batch mode.
                                   ass
 2      boole  json-format  false  Option to support J  This option enables to format object ou
        an                         SON format of objec  tput with JSON when -x option selected.
                                   t output
 1      boole  disable-sub  false  Option to control i  This option disable to include sub clas
        an     -class              nclude sub class wh  s when matching class.
                                   en class matching
 1      boole  support-def  true   Option to control i  This option disable to include default
        an     ault-method         nclude default meth  method in interface when matching class
                                   od in interface whe  .
                                   n class matching
 1      boole  save-result  false  Option to print com  This option enables to save each comman
        an                         mand's result to lo  d's result to log file, which path is $
                                   g file               {user.home}/logs/arthas-cache/result.lo
                                                        g.
 2      Strin  job-timeout  1d     Option to job timeo  This option setting job timeout,The uni
        g                          ut                   t can be d, h, m, s for day, hour, minu
                                                        te, second. 1d is one day in default
 1      boole  print-paren  true   Option to print all  This option enables print files in pare
        an     t-fields             fileds in parent c  nt class, default value true.
                                   lass
 1      boole  verbose      false  Option to print ver  This option enables print verbose infor
        an                         bose information     mation, default value false.
[arthas@4805]$- 1
- 2
- 3
- 4
- 5
- 6
- 7
- 8
- 9
- 10
- 11
- 12
- 13
- 14
- 15
- 16
- 17
- 18
- 19
- 20
- 21
- 22
- 23
- 24
- 25
- 26
- 27
- 28
- 29
- 30
- 31
- 32
- 33
- 34
- 35
- 36
- 37
Result field description
| name | Default value | describe |
|---|---|---|
| unsafe | false | Whether to support the enhancement of system level classes. Turning on this switch may cause the JVM to hang. Please choose carefully! |
| dump | false | Whether the enhanced classes can be dumped into external files. If the switch is turned on, the class files will be dumped into the / ${application working dir} / Arthas class dump / directory. See the console output for the specific location |
| batch-re-transform | true | Does it support batch retransform operations on matched classes |
| json-format | false | Whether json output is supported |
| disable-sub-class | false | Whether to disable subclass matching. By default, the subclass will be matched when matching the target class. If you want to accurately match, you can turn off this switch |
| support-default-method | true | Whether matching to the default method is supported. By default, the interface will be found to match the default method in it. Reference #1105 |
| save-result | false | Whether to open the function of saving execution results in log. After opening, the running results of all commands will be saved to ~ / logs / Arthas cache / result Log |
| job-timeout | 1d | The default timeout of asynchronous background task. If it exceeds this time, the task will stop automatically; For example, set 1D, 2h, 3M and 25s to represent days, hours, minutes and seconds respectively |
| print-parent-fields | true | Print filed in parent class |
Gets the value of option
[arthas@4805]$ options json-format
 LEVEL  TYPE   NAME         VALUE  SUMMARY              DESCRIPTION
------------------------------------------------------------------------------------------------
 2      boole  json-format  false  Option to support J  This option enables to format object ou
        an                         SON format of objec  tput with JSON when -x option selected.
t output- 1
- 2
- 3
- 4
- 5
- 6
Sets the specified option
[arthas@4805]$ options save-result true
 NAME         BEFORE-VALUE  AFTER-VALUE
----------------------------------------
 save-result  false         true
- 1
- 2
- 3
- 4
finish
At present, arthas is used by many people. It is said that people inside Alibaba are using this tool to find errors. At present, most companies are still using jdk's own tools such as jinfo, jmap, jstack and jhat to find errors. The tools are not good or bad. It depends on how you use them. As long as you can achieve your goal! The emergence of arthas tool has added another method to help us find faults;
Reprinted from: https://yexindong.blog.csdn.net/article/details/118875205