1. auc meaning
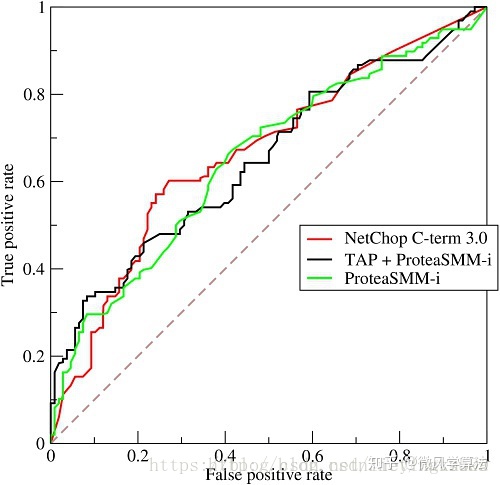
AUC (Area under curve) is a commonly used two classification evaluation method for machine learning. It directly means the area under the ROC curve, as shown in the following figure


- The column in the table represents the forecast classification, and the row represents the actual classification:
- Actual 1, forecast 1: real class (tp)
- Actual 1, forecast 0: false negative class (fn)
- Actual 0, forecast 1: false positive class (fp)
- Actual 0, predicted 0: true negative class (tn)
- Total number of true negative samples = n=fp+tn
- Total number of real positive samples = p=tp+fn
- In the first picture,
- The abscissa false positive rate represents the false positive rate, which is calculated by fp/n,
- It means the probability of predicting positive samples in actual negative samples.
- The ordinate true positive rate represents the true class rate, which is calculated by tp/p,
- It means the probability of occurrence of predicted positive samples in actual positive samples.
2. Calculate auc by statistical sorting value
2.1 calculation formula
● rank the prediction probability from high to low
● set a rank value for each probability value (the rank of the highest probability is n, and the second highest is n-1)
● rank actually represents the number of samples exceeded by the score (when the prediction probability is equal, take the mean value)
In order to find that the score value of the positive sample in the combination is greater than that of the negative sample, if the score value of all positive samples is greater than that of the negative sample, the score value of the first and any combination should be greater, and we take its rank value as n, However, M-1 in n-1 is a combination of positive examples and positive examples, which is not within the statistical range (for the convenience of calculation, we take n groups, and there are m corresponding non conformances). Therefore, if it is to be subtracted, similarly, for n-1 in the second place, there will be M-1 unsatisfied, and so on, so the following formula M*(M+1)/2 is obtained, We can verify that the AUC value is 1 under the assumption that the score of positive samples is greater than that of negative samples
● divide by M*N

2.2. python implementation
import numpy as np
from sklearn.metrics import roc_curve
from sklearn.metrics import auc

#---Implement it according to the formula
def auc_calculate(labels,preds,n_bins=100):
    postive_len = sum(labels)
    negative_len = len(labels) - postive_len
    total_case = postive_len * negative_len
    pos_histogram = [0 for _ in range(n_bins)]
    neg_histogram = [0 for _ in range(n_bins)]
    bin_width = 1.0 / n_bins
    for i in range(len(labels)):
        nth_bin = int(preds[i]/bin_width)
        if labels[i]==1:
            pos_histogram[nth_bin] += 1
        else:
            neg_histogram[nth_bin] += 1
    accumulated_neg = 0
    satisfied_pair = 0
    for i in range(n_bins):
        satisfied_pair += (pos_histogram[i]*accumulated_neg + pos_histogram[i]*neg_histogram[i]*0.5)
        accumulated_neg += neg_histogram[i]

    return satisfied_pair / float(total_case)

if __name__ == '__main__':

    y = np.array([1,0,0,0,1,0,1,0,])
    pred = np.array([0.9, 0.8, 0.3, 0.1,0.4,0.9,0.66,0.7])


    fpr, tpr, thresholds = roc_curve(y, pred, pos_label=1)
    print("-----sklearn:",auc(fpr, tpr))
    print("-----py script:",auc_calculate(y,pred))
3. Calculate auc by counting positive and negative samples
3.1 calculation formula
In a data set with m positive samples and N negative samples. There are M*N pairs of samples (a pair of samples, i.e. a positive sample and a negative sample). Count the number of M*N pairs of samples in which the prediction probability of positive samples is greater than that of negative samples.
If the probability of enumerating all samples (i.e. the probability of positive and negative auc) is greater than that of all samples, then the prediction probability of all samples is greater than 1-0; If the prediction probability of the positive sample is equal to the prediction probability of the negative sample, then + 0.5; if the prediction probability of the positive sample is less than the prediction probability of the negative sample, then + 0; Finally, divide the number of statistical processing by M × N to get our auc. The formula is described as follows:

3.2. python implementation
def AUC(label, pre):
  """
  Apply topython3.0 Above version
   """
  #Calculate the indexes of positive samples and negative samples so as to extract the subsequent probability value
    pos = [i for i in range(len(label)) if label[i] == 1]
    neg = [i for i in range(len(label)) if label[i] == 0]

    auc = 0
    for i in pos:
        for j in neg:
            if pre[i] > pre[j]:
                auc += 1
            elif pre[i] == pre[j]:
                auc += 0.5

    return auc / (len(pos)*len(neg))


if __name__ == '__main__':
    label = [1,0,0,0,1,0,1,0]
    pre = [0.9, 0.8, 0.3, 0.1, 0.4, 0.9, 0.66, 0.7]
    print(AUC(label, pre))

    from sklearn.metrics import roc_curve, auc
    fpr, tpr, th = roc_curve(label, pre , pos_label=1)
    print('sklearn', auc(fpr, tpr))
reference resources
https://zhuanlan.zhihu.com/p/84035782 (auc principle and calculation logic)
https://blog.csdn.net/lieyingkub99/article/details/81266664 (including detailed examples)