Sometimes you may have some crazy ideas and want to test your trading strategy. By using historical market data for backtesting, you can assess risk, profit and measure performance, so as to gain confidence in using this trading strategy. Of course, if you are a skilled programmer, you have no problem writing complex and heavily loaded programs to deal with the retrieved data analysis. Due to the strong ability of Elasticsearch in search, data analysis and machine learning, it is worth writing a series of articles about Elasticsearch back testing different trading strategies for reference.
Written before< RSI BB or RSI & BB? Very simple, let's use Elasticsearch to implement it! >In this paper, we introduce how to use elasticsearch to achieve relative strength index (RSI). In this article, we will make a simple tool to test the RSI trading strategy in elasticsearch. Since most of the work is done in the elasticsearch cluster, the client will not have a heavy workload. Elasticsearch will provide buy or sell signals, and then write a simple Python program integration to further analyze the signals and generate reports. It is recommended that readers quickly browse the previous articles to have a basic understanding of RSI and the implementation details of using elasticsearch.
RSI is a momentum indicator that provides information about price changes to support opportunities to buy and sell assets. Price changes are converted into two types of data: recent total income and recent total loss, usually with a cycle of 14. The RSI equation can be written as follows, where SMAgain,n and SMAloss,n are the moving average of recent total income and recent total loss. For the Elasticsearch moving average function SMA with the corresponding window n, it is necessary to move one data right to include the current data.

The RSI crossover strategy defines where RSI is considered a crossover to indicate overbought (> = 70) and oversold (< = 30) signals. For other RSI values, no signal is generated. In this paper, we apply the backtesting to the equity public funds provided by Tushare big data open community, and focus on Elasticsearch as an analysis tool. The following example randomly selects "selected stocks of ICBC research" (Code: 000803.OF), and another 10 equity funds are selected for operation. The final results will be summarized and displayed in the last paragraph. The data is selected from the provided time range from January 1, 2021 to April 30, 2021. The window of RSI is 14. In the figure below, RSI is drawn together with the Daily closing price. In the Daily price curve, the RSI value > = 70 is marked in red and the RSI value < = 30 is marked in blue.
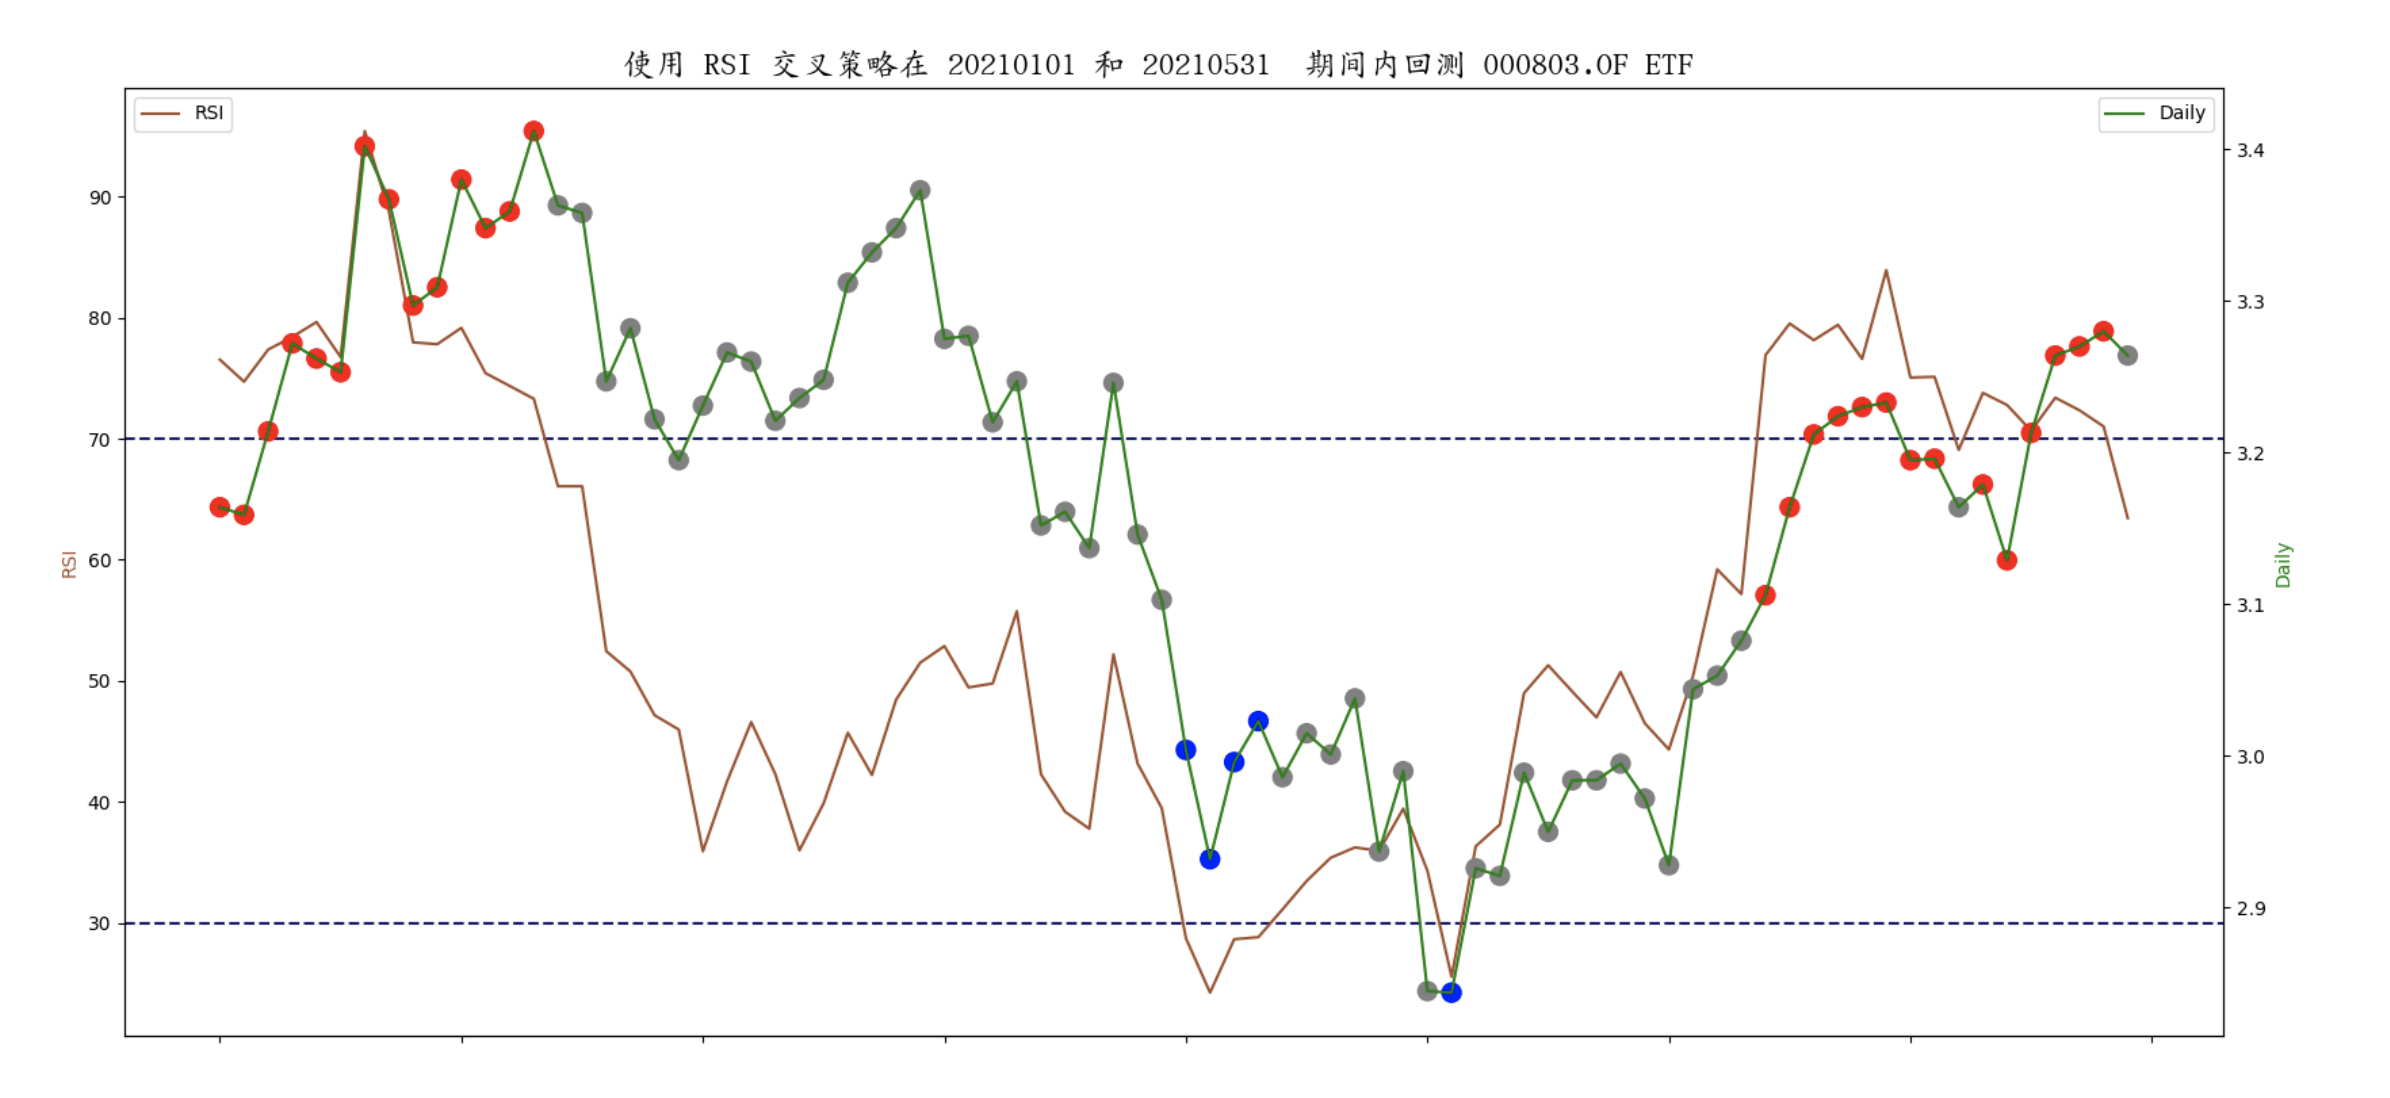
Here, we use a simple RSI crossover strategy.
- It is assumed that due to cost constraints, only one share can be purchased and held at a time, and no transaction can occur before the held fund is sold.
- When RSI value < = 30, buy 1 copy.
- When RSI value > = 70, sell 1 copy.
- At the end of the test period, the funds held are cashed at the current price.
There are many blue and red dots in the daily price curve, but only one buy and one sell are allowed according to the above strategy. The following explains how to implement RSI cross strategy using Elasticsearch. Suppose you have an Elasticsearch index filled with data, which uses the same data mapping as previously published articles. The following steps demonstrate the code for the REST API request body.
Collect all relevant documents through the search operation
Use a bool query with a must clause to collect fund code 000803 Of, and documents with announcement deadline from January 1, 2021 to May 31, 2021. Due to the need to calculate the moving average, one month's data is added (from December 1, 2020 to December 31, 2020). All data are transaction day data, and interpolation steps are not performed on non transaction days.
{
    "query": {
        "bool": {
		     "must": [
		         {"range": {"end_date": {"gte": "20201201", "lte": "20210531"}}},
		         {"term": {"ts_code": "000803.OF"}}
		     ]
		}
	},
Withdraw the daily compound unit net value and unit net value
Use the name Backtest_RSI date_histogram bucket aggregation, and the parameter field is end_ The date and interval (interval) are 1d (1 day), and the Daily compound unit net value (adj_nav) and unit net value (unit_nav) are extracted. The net value of the compound unit is used to calculate the profit, and the net value of the unit is used to calculate the maximum purchase price. Because the sub aggregation uses pipeline aggregation and cannot directly adopt document fields, the average value (avg) aggregation is additionally used to obtain the Daily net value of compound weight unit, and the aggregation name is Daily. In the same way, you can get the Daily unit net value, and the aggregate name is Daily_unit_nav.
    "aggs": {
        "Backtest_RSI": {
             "date_histogram": {
                "field": "end_date",
                "interval": "1d",
                "format": "yyyyMMdd"
             },
             "aggs": {
                "Daily": {
                    "avg": {"field": "adj_nav"}
                },
                "Daily_unit_nav": {
                    "avg": {"field": "unit_nav"}
                },
Date the bucket was extracted
Since one month's data is added and additional documents need to be filtered out in subsequent operations, the date of the bucket is used as the filtering limit. We can use the minimum value aggregation named DateStr to indirectly obtain the date. The date of Elasticsearch is expressed in epoch time, in milliseconds, and the time zone is UTC.
                "DateStr": {
                    "min": {"field": "end_date"}
                },
Calculate Daily variance
Use the name price_ The derivative of diff is aggregated and matched with the parameter buckets_path specifies the value of the Daily aggregate to determine its value from the previous timestamp.
                "Price_Diff": {
                    "derivative": {
                        "buckets_path": "Daily"
                     }
                },
Determine the price of the day_ Is the result of diff aggregation a gain or a loss
Use two bucket_scripts to aggregate, named Gain and Loss, and cooperate with the parameter buckets_path specifies price_ The results of diff aggregation are used to calculate the values of Gain and Loss. When one is positive, the other is zero.
                "Gain": {
                    "bucket_script": {
                        "buckets_path": {"Price_Diff": "Price_Diff"},
                        "script": "(params.Price_Diff > 0) ? params.Price_Diff : 0"
                    }
                },
                "Loss": {
                    "bucket_script": {
                        "buckets_path": {"Price_Diff": "Price_Diff"},
                        "script": "(params.Price_Diff < 0) ? -params.Price_Diff : 0"
                    }
                },
Calculate the simple moving average of daily total revenue and total loss
Two "moving_fn" aggregations are used, named GainSMA and LossSMA respectively. The parameter window is 14 and the parameter "buckets_path" is the result of Gain and Loss respectively. The parameter "shift" is set to 1 to include the data of the current day and the past 13 trading days. SMA is calculated using the unweighted average function (MovingFunctions.unweightedAvg).
                "GainSMA": {
                    "moving_fn": {
                        "script": "MovingFunctions.unweightedAvg(values)", "window": 14, "buckets_path": "Gain", "shift":1
                    }
                },
                "LossSMA": {
                    "moving_fn": {
                        "script": "MovingFunctions.unweightedAvg(values)", "window": 14, "buckets_path": "Loss", "shift":1
                    }
                },
Calculate RSI value
Use the bucket script named RSI to aggregate and cooperate with the parameter buckets_path specifies the results of GainSMA and LossSMA. Then calculate the RSI index according to the formula in the script.
                "RSI": {
                    "bucket_script": {
                        "buckets_path": {"GainSMA": "GainSMA", "LossSMA": "LossSMA"},
                        "script": "100 - 100/(1+params.GainSMA/params.LossSMA)"
                    }
                },
Identifies the type of RSI value
Use the name RSI_ The bucket script of type is aggregated with the parameter buckets_path specifies the value of the RSI aggregate to determine the type. If RSI value > = 70, set the type to 2. If RSI value < = 30, set the type to 1. For other RSI values, set the type to 0.
                "RSI_Type": {
                    "bucket_script": {
                        "buckets_path": {"RSI": "RSI"},
                        "script": "params.RSI >= 70 ? 2 : params.RSI <= 30 ? 1 : 0"
                    }
                },
Filter out additional documents before output
Use the name buy_ Sell_ The "bucket_selector" of signal is aggregated, and the bucket selection conditions are specified in the "buckets_path" and "script" statements with the parameters "buckets_path" as "DateStr" and "RSI_Type". The selection criteria are buckets dated January 1, 2021 and later (specify the era time 1609459200000 in milliseconds). Since RSI involves the current closing price, the buy or sell transaction will be postponed to the next trading day. Therefore, all results will be reported and processed in the python program, and the buy or sell transactions will be processed according to the strategy.
                "Buy_Sell_Signal": {
                    "bucket_selector": {
                        "buckets_path": {"DateStr": "DateStr", "RSI_Type": "RSI_Type"},
                        "script": "params.DateStr >= 1609459200000L"
                    }
                }
            }
        }
     },
     "size": 0
}
After collecting the results, you can draw as shown in the previous figure.
The execution result will send a buy or sell signal; However, these signals only satisfy the second and third cases of the aforementioned RSI trading strategy. For the first and fourth cases, you need to write the program in Python programming language. The main program consists of four parts.
- Read two command line parameters. One for the selected code and the other for the file name containing the transaction policy written in the body of the Elasticsearch REST API request using JSON format.
- Get data from Elasticsearch server.
- Analyze response data and optimize buy and sell signals.
- Report back test statistics (for simplicity, the profit does not deduct transaction expenses).
The main functions are as follows:
def main(argv):
    inputfile, symbol = get_opt(argv)
    resp = get_data(inputfile, symbol)
    transactions = parse_data(resp)
    report(transactions)
In this article, only the code snippet of the refinement of the buying and selling signal is shown. Readers can further refer to the open source project on Gitee( Backtest_rsi ). To ensure that only one share is bought and held at a time and that no transaction occurs before selling the held shares, we use the boolean variable "hold" to ensure that the transaction meets the following conditions.
- When hold is False, the buy signal is accepted
- When hold is True, the sell signal is accepted
Function parse_data() is shown below. Finally, the transaction array contains only valid signals. However, these signals will process buy or sell according to the trading strategy in the report. The profit is calculated using the difference between the net value of the compound unit. The purchase price and profit percentage are calculated using unit_nav.
# parse the response data and refine the buy/sell signal
def parse_data(resp):
    result = json.loads(resp)
    aggregations = result['aggregations']
    if aggregations and 'Backtest_RSI' in aggregations:
        Backtest_RSI = aggregations['Backtest_RSI']

    transactions = []
    hold = False
    if Backtest_RSI and 'buckets' in Backtest_RSI:
        for bucket in Backtest_RSI['buckets']:
            transaction = {}
            transaction['date'] = bucket['key_as_string']
            transaction['Daily'] = bucket['Daily']['value']
            transaction['Daily_unit_nav'] = bucket['Daily_unit_nav']['value']
            # honor buy signal if there is no share hold
            if bucket['RSI_Type']['value'] == 1 and not hold:
                transaction['buy_or_sell'] = 'buy'
                hold = True
            # honor sell signal if there is a share hold
            elif bucket['RSI_Type']['value'] == 2 and hold:
                transaction['buy_or_sell'] = 'sell'
                hold = False
            # for other situations, just hold the action
            else:
                transaction['buy_or_sell'] = 'hold'
            transactions.append(transaction)

    return transactions
The back test report of RSI cross strategy is as follows:
Number of purchases:             1
 Number of sales:             1
 Winning times:             1
 Number of losses:             0
 Total profit:           0.232
 Total profit/Number of purchases:    0.232
 Maximum purchase price:         2.932
 Profit percentage:        7.91%
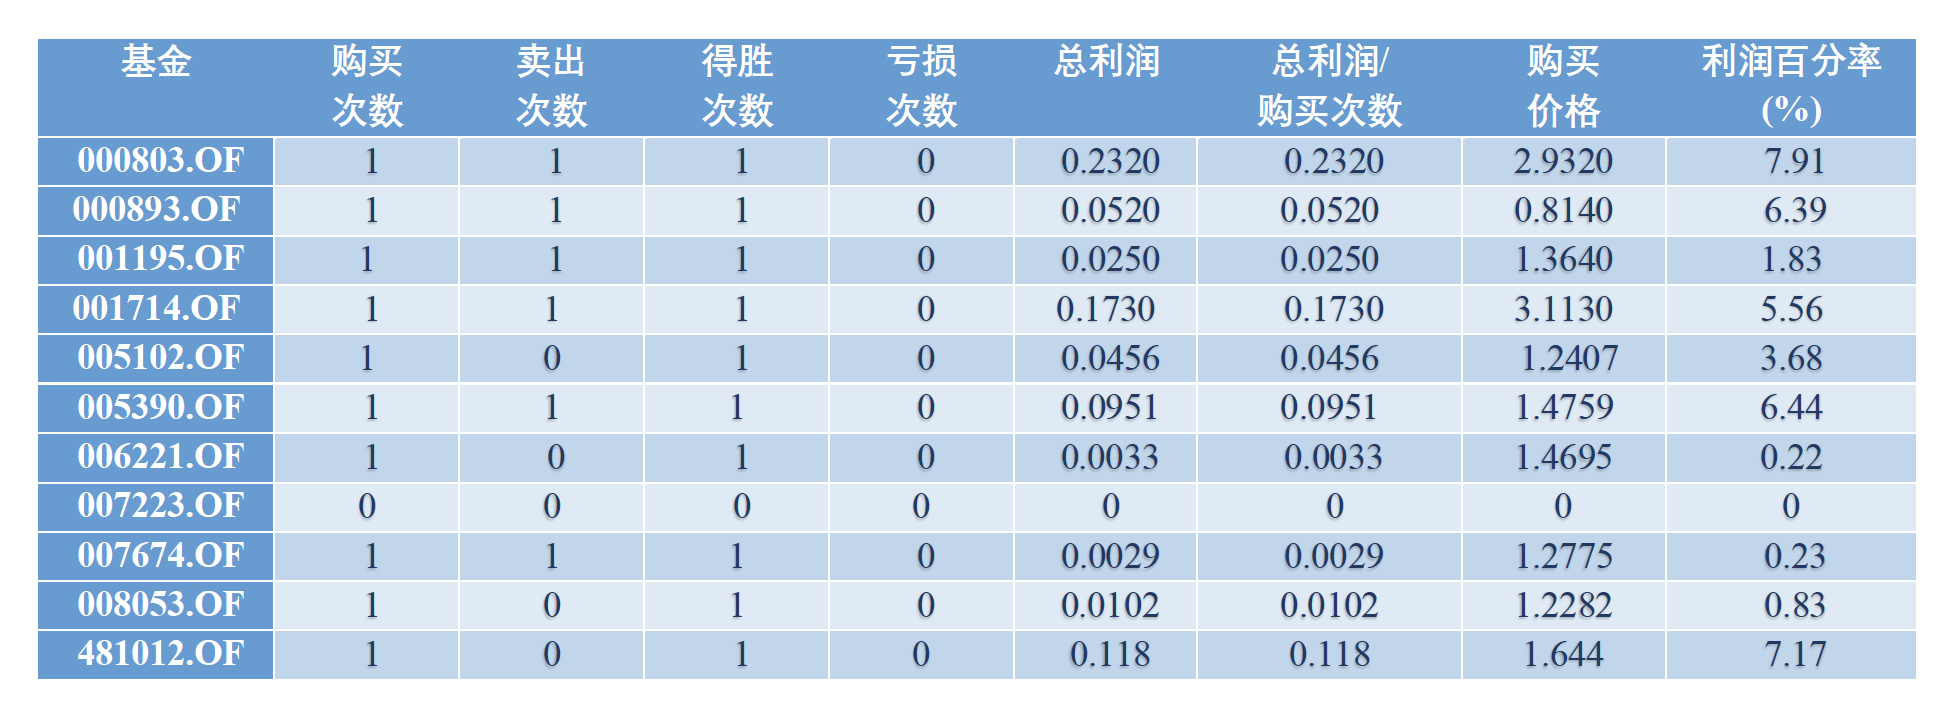
From January 1, 2021 to May 31, 2021, the results of 11 equity funds running simple RSI trading strategy are summarized and displayed in the table below. Although none of the 11 Funds lost money, the trading results were not so satisfactory. One fund did not generate trading signals. The profits of three funds were less than 1%, and the profits of four funds could reach 6 ~ 7%. Therefore, as most traders suggest, do not trade on a single indicator. Using RSI signal alone is not a good strategy, and it is impossible to have a better chance of winning for all funds in all periods. However, Elasticsearch used in this article shows seamless integration and easy to understand with Python programming examples.
Remarks:
1. Thank Tushare big data open community for providing relevant data and Gitee open source community for providing storage open source projects.
II. This article is based on publicly released technology and research views and does not constitute any investment suggestions. Readers must bear their own responsibility when using it.
3. There may still be omissions and mistakes in the article. I urge the readers to criticize and correct.
4. The author's Chinese book Elasticsearch data analysis and practical application (ISBN 978-7-113-27886-1) will be published in July 2021.
5. The author's English Book Advanced Elasticsearch 7.0 (ISBN 978-1-789-95775-4) was rated by bookauthority as one of the four most readable Elasticsearch new books in 2021.