Basic tutorial of Xamarin chart development (6) OxyPlot framework
Drawing line in Xamamin iOS OxyPlotiOSDemo
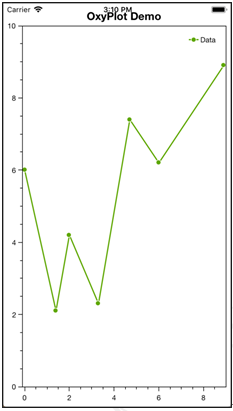
[example OxyPlotiOSDemo] the display of line chart will be realized below. The specific operation steps are as follows:
(1) open the Xamarin.iOS project.
(2) add the OxyPlot.Xamarin.iOS component to the introduction of the project.
(3) open the ViewController.cs file and complete the remaining steps, that is, create the PlotView, draw the chart, set the display mode and display the PlotView. The code is as follows:
using Foundation;

using System;

using UIKit;

using OxyPlot.Xamarin.iOS;

using OxyPlot;

using OxyPlot.Axes;

using OxyPlot.Series;

namespace OxyPlotiOSDemo

{

    public partial class ViewController : UIViewController

    {

        public ViewController (IntPtr handle) : base (handle)

        {

        }

        public override void ViewDidLoad ()

        {

            base.ViewDidLoad ();

            // Perform any additional setup after loading the view, typically from a nib.

            //Create a PlotView view

            PlotView plotView = new PlotView

            {

                Frame = this.View.Frame

            };

            plotView.Model=CreatePlotModel();                                                    //Set display mode

            this.View.Add(plotView);                                                                        //Add a PlotView view to the home view

        }

        //Drawing charts

        private PlotModel CreatePlotModel()

        {

            //Create chart mode

            var plotModel = new PlotModel

            {

                Title = "OxyPlot Demo"

            };

            //Add axis

            plotModel.Axes.Add(new LinearAxis { Position = AxisPosition.Bottom });

            plotModel.Axes.Add(new LinearAxis { Position = AxisPosition.Left, Maximum = 10, Minimum = 0 });

            //Create data column

            var series1 = new LineSeries

            {

                Title = "Data",

                MarkerType = MarkerType.Circle,

                MarkerSize = 4,

                MarkerStroke = OxyColors.White

            };

            //Add data point

            series1.Points.Add(new DataPoint(0.0, 6.0));

            series1.Points.Add(new DataPoint(1.4, 2.1));

            series1.Points.Add(new DataPoint(2.0, 4.2));

            series1.Points.Add(new DataPoint(3.3, 2.3));

            series1.Points.Add(new DataPoint(4.7, 7.4));

            series1.Points.Add(new DataPoint(6.0, 6.2));

            series1.Points.Add(new DataPoint(8.9, 8.9));

            //Add data column

            plotModel.Series.Add(series1);

            return plotModel;

        }

        ......

    }

}
Run the program and you will see the effect shown in Figure 1.2.

Figure 1.2 line map effect of Xamarin.iOS platform