Generally speaking, the basic process of data analysis includes the following steps:
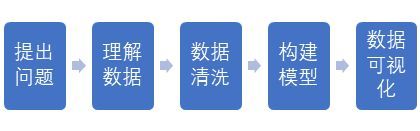
1. Ask questions - the metrics we want to know (average consumption, age distribution of customers, turnover trends, etc.)
2. Import Data - Import the original data source into Jupyter Notebook (web crawlers, data reads, etc.)
3. Data cleaning - Data cleaning refers to discovering and correcting identifiable errors in data files (checking data consistency, handling invalid and missing values, etc.)
4. Building models (advanced model building uses machine learning algorithms)
5. Data visualization - matplotib library, etc.
Specific numpy libraries and other basic knowledge have been described in previous articles:
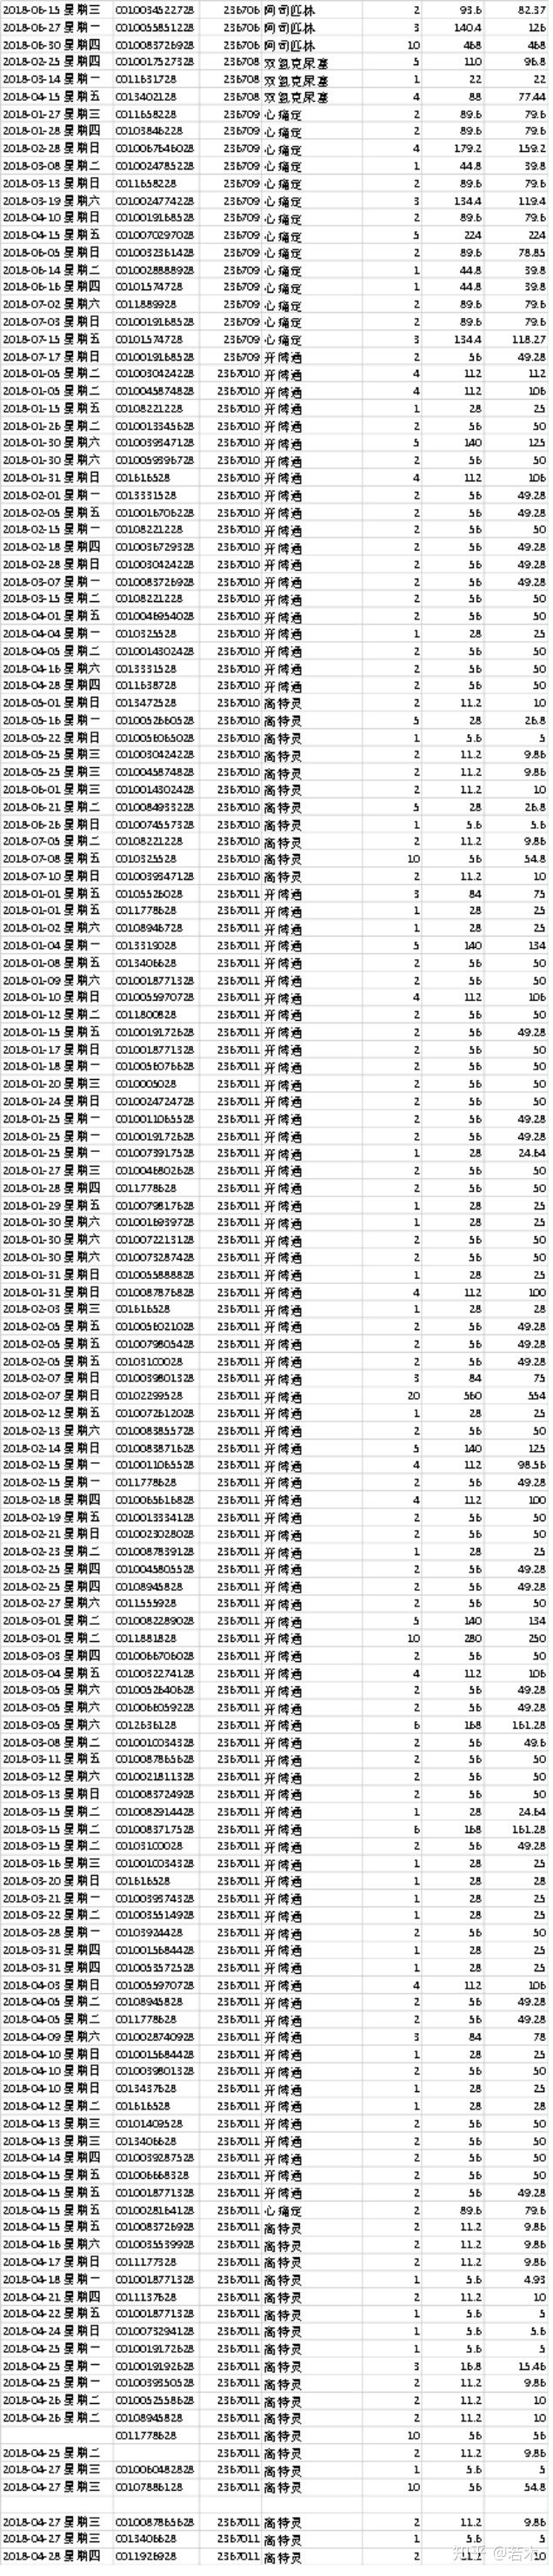
Now let's take an example--analysis of hospital drugstore sales data
Raw data connection:
https://pan.baidu.com/s/1zklAFKSCQOi_xxTGNgeRXQpan.baidu.com
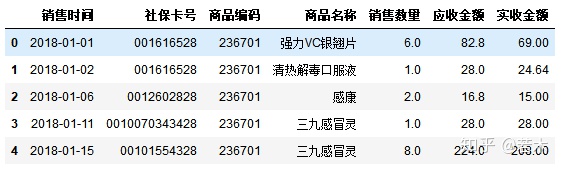
Preview of raw data (partial):
Ask questions:
What we want to know is - average monthly consumption, average monthly consumption, unit price, consumption trends
Understanding data:
1. Read Excel data (the best way to do this is not to use Chinese, or special symbols, otherwise the path will prompt you to find the error.
It's best to put the file in a simple English path)
import pandas as pd
fileNameStr='D:\Sales Data of Chaoyang Hospital in 2018.xlsx' #Read Ecxcel data
xls = pd.ExcelFile(fileNameStr, dtype='object')
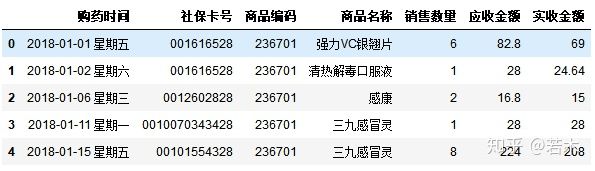
salesDf = xls.parse('Sheet1',dtype='object')Let's first look at the basic information about the data:
salesDf.head() #Print out the first 5 lines to ensure the data is working properly
salesDf.shape #How many rows, how many columns

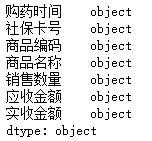
salesDf.dtypes #View data types for each column
Data cleaning:
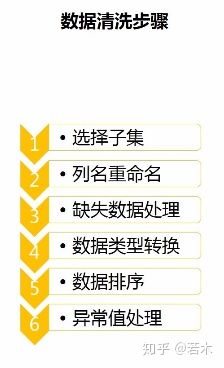
1. Select a subset (not used in this case):
Select a subset using the loc method
#subSalesDf=salesDf.loc[0:4,'Drug Purchase Time':'Sales Quantity']
2. Column name rename:
colNameDict = {'Drug Purchase Time':'Time of Sale'}                  #Change'Drug Purchase Time'to'Sales Time'
salesDf.rename(columns = colNameDict,inplace=True)
salesDf.head()                                       #View the first five lines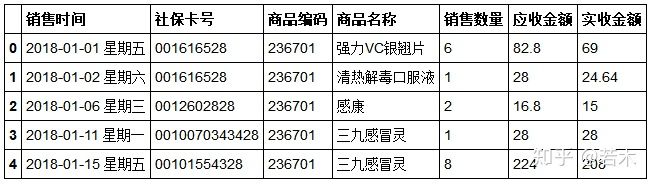
inplace=False, the data frame itself will not change, but a new data frame will be created after the change. The default inplace is False, inplace=True, and the data frame itself will change
3. Missing data processing:
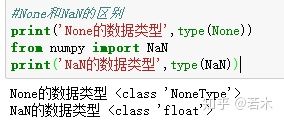
There are three python missing values: None, NA, NaN
1) Python's built-in Nune value
2) In pandas, the missing value is expressed as NA, indicating that it is not available.
3) For numeric data, pandas uses a floating-point value of NaN (Not a Number) to represent missing data.
If you encounter an error in the following data:... foloat error, there are missing values that need to be dealt with
print('Size before deleting missing values',salesDf.shape)
salesDf=salesDf.dropna(subset=['Time of Sale','social security number'],how='any') #Delete empty lines in column (Time of Sale, Social Security Card Number)
print('Delete missing size',salesDf.shape)
how='any'means deleting a missing value in any given column
If there is too much missing data, we can build a model to supplement the data by inserting values (described in a future article on machine learning)
4. Data Type Conversion
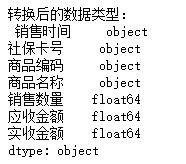
When we started importing, we imported all the data as string type. Now we need to change the data type of sales quantity, receivable amount and actual amount to numeric type.
salesDf['Sales volumes'] = salesDf['Sales volumes'].astype('float')
salesDf['Amount Receivable'] = salesDf['Amount Receivable'].astype('float')
salesDf['Amount received'] = salesDf['Amount received'].astype('float')
print('Converted data type:\n',salesDf.dtypes)
Type conversion using astype () method
Let's change the date format again
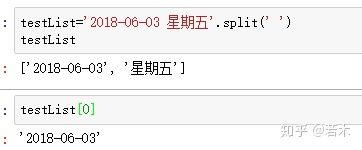
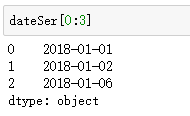
Use the split() method to split the string with''.Return the first element of the list, unify the Adult-Month-Day format, and remove the Days of Week.
Next, let's split the sales time by defining a function to split the string:
def splitSaletime(timeColSer):
    timeList=[]
    for value in timeColSer:           #For example, Friday, 2018-01-01, divided into: 2018-01-01
        dateStr=value.split(' ')[0]
        timeList.append(dateStr)

    timeSer=pd.Series(timeList)        #Convert a list to a one-dimensional data Series type
    return timeSer
Input: timeColSer - Sales time column, is a Series data type
Output: split time, return is also a Series data type
timeSer=salesDf.loc[:,'Time of Sale']    #Get the Sales Time column
dateSer=splitSaletime(timeSer)      #Split the string to get the sales date

salesDf.loc[:,'Time of Sale']=dateSer    #Modify the value of the Time of Sale column
salesDf.head()
(Note: If an error occurs after running: AttributeError:'float'object has no attribute'split' because an empty cell in Excel reads into a pandas as a null value (NaN), which is a floating point type and is generally treated as a null value.So first remove NaN from the delimiting string)
5. String Conversion Date
We usePd.to_The datetime method converts a string to a date format.The incoming format is the date format of the original data - format='%Y-%m-%d'fixed notation: Y for year, m for month, D for day.
salesDf.loc[:,'Time of Sale']=pd.to_datetime(salesDf.loc[:,'Time of Sale'],
                                    format='%Y-%m-%d',
                                    errors='coerce')
salesDf.dtypes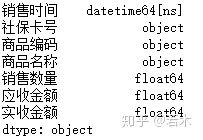
errors='coerce': If the original data does not conform to the format of the date, the converted value is a null NaT
So after the conversion we also run the code to delete null values once, because the date that does not conform to the format is converted to null values and needs to be deleted.
salesDf=salesDf.dropna(subset=['Time of Sale','social security number'],how='any')
6. Sorting data
UsePd.sort_The values method sorts the data, by means of sorting by those columns, ascending=True means ascending, ascending=False means descending
print('Pre-Sort Dataset')
salesDf.head()
salesDf=salesDf.sort_values(by='Time of Sale', #Sort ascending by sales date
ascending=True)
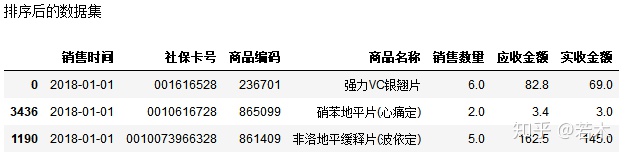
print('Sorted datasets')
salesDf.head(3)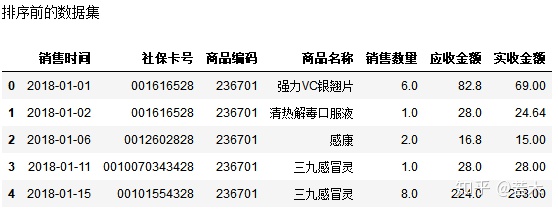
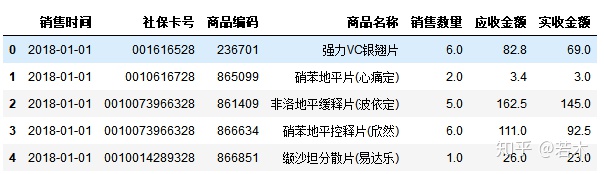
Next we rename the line number: reset_index method generates index values in order from 0 to N
salesDf=salesDf.reset_index(drop=True)
salesDf.head()
7. Handling of outliers
First, we use the describe() method to view descriptive statistics for each column of all the data in the data frame:
salesDf.describe()
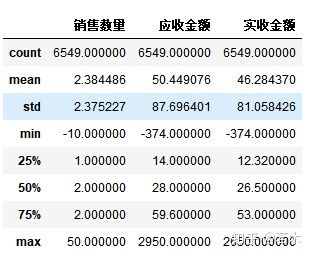
(count: total, mean: mean, std: standard deviation, min: minimum, 25%: lower quartile, 50%: median, 75%: upper quartile, max: maximum)
We found that the minimum value is less than 0. The analysis should be caused by errors in the recording process.
Next, we delete the outliers: Conditional judgment filters out data with sales greater than 0
#Set Query Conditions
querySer=salesDf.loc[:,'Sales volumes']>0
#Applying Query Conditions
print('Before deleting outliers:',salesDf.shape)
salesDf=salesDf.loc[querySer,:]
print('After deleting the outliers:',salesDf.shape)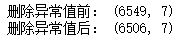
In this way, we have basically completed the data cleaning steps.
Building models:
First indicator: average monthly consumption = total consumption/month
Note: All expenditures incurred by the same person during the same day are counted as one expenditure. According to the column name (Time of Sale, Community Card Number), if the two column values are the same at the same time, only one is retained and drop_is usedDuplicates delete duplicate data
kpi1_Df=salesDf.drop_duplicates(
    subset=['Time of Sale', 'social security number']
)

totalI=kpi1_Df.shape[0]             #Total consumption --- how many lines

print('Total consumption=',totalI)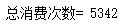
Calculate the number of months We need to know when the earliest consumption is and when the last consumption is:
#Step 1: Sort ascending by sales time
kpi1_Df=kpi1_Df.sort_values(by='Time of Sale',
                    ascending=True)
kpi1_Df=kpi1_Df.reset_index(drop=True)     #Rename row name (index)

#Step 2: Get the time range
startTime=kpi1_Df.loc[0,'Time of Sale']         #Minimum Time Value
endTime=kpi1_Df.loc[totalI-1,'Time of Sale']    #Maximum Time Value

#Step 3: Calculate the number of months
daysI=(endTime-startTime).days             #Days
monthsI=daysI//30 #Months: The operator'//'denotes an integer division and returns the integer part of the quotient, for example, 9//2 The output is 4
print('Months:',monthsI)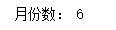
Calculate months in days/30 (discard remainder)
Final Calculated Average Monthly Consumptions = Total Consumptions/Months
kpi1_I=totalI // monthsI
print('Business Indicator 1: Average Monthly Consumption=',kpi1_I)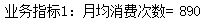
Second indicator: average monthly consumption = total consumption / number of months
The total consumption amount is equal to the sum of the actual receipts, which can be quickly obtained by using the sum function
totalMoneyF=salesDf.loc[:,'Amount received'].sum()   #Total consumption amount
monthMoneyF=totalMoneyF / monthsI            #Average monthly consumption
print('Business Indicator 2: Average monthly consumption=',monthMoneyF)
Third indicator: unit price = average transaction amount = total consumption amount / total consumption number
'''
totalMoneyF: Total consumption amount
totalI: Total consumption
'''
pct=totalMoneyF / totalI
print('Passenger Unit Price:',pct)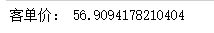
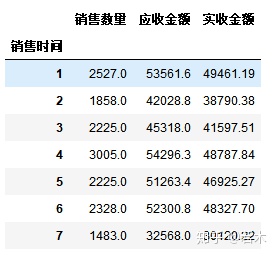
Fourth indicator: consumption trends
#Copy data to another data frame before proceeding to prevent impact on previously cleaned data frames
groupDf=salesDf

#Step 1: Rename the row name (index) to be the value of the column where the time of sale is located
groupDf.index=groupDf['Time of Sale']

#Step 2: Grouping
gb=groupDf.groupby(groupDf.index.month)

#Step 3: Apply a function to calculate the total monthly consumption
mounthDf=gb.sum()

mounthDf
Additional sections will use some advanced pandas application knowledge, along with subsequent data visualization content, which will be described in subsequent articles.