Beats
Introduction to Beats:
- Lightweight data collector: Beats platform integrates a variety of single purpose data collectors. They come from hundreds or thousands of machines
The device and system send data to Logstash or Elasticsearch. - Beats series: full category collector to handle all data types.
① Filebeat: log file
② Metricbeat: indicator
③ Packet beat: network data
④ winlogbeat: windows event log
⑤ Auditbeat: audit data
⑥ Heartbeat: Runtime Monitoring
⑦ Functionbeat: collector without server
Filebeat
Introduction to Filebeat:
- Lightweight log collector: when you have to face logs generated by hundreds or even thousands of servers, virtual machines and containers, please say goodbye to SSH. Filebeat will provide you with a lightweight method for forwarding and summarizing logs and files, so that simple things are no longer complicated.
- Summary, "tail -f" and search: after starting Filebeat, open Logs Ul and directly watch the process of tail operation on your files in Kibana. Filter by service, application, host, data center or other conditions through the search bar to track abnormal behavior in your overall summary logs.
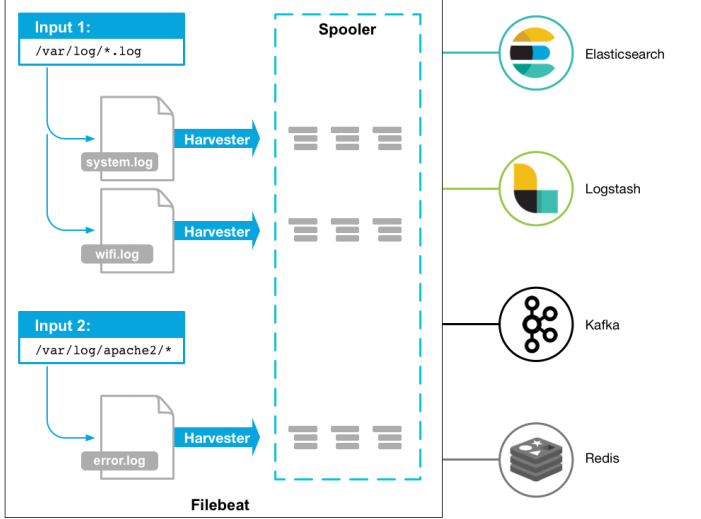
- Architecture: used to monitor and collect server log files.
Deployment and operation:
mkdir /itcast/beats
tar -xvf filebeat-6.5.4-linux-x86_64.tar.gz
cd filebeat-6.5.4-linux-x86_64

#Create the following configuration file itcast yml
filebeat.inputs:
- type: stdin
  enabled: true
setup.template.settings:
  index.number_of_shards: 3
output.console:
  pretty: true
  enable: true

#Start filebeat
./filebeat -e -c itcast.yml

#Enter hello and the running results are as follows:
hello
- result:
{
	"@timestamp": "2019-01-12T12:50:03.585Z",
	"@metadata": { #Metadata information
		"beat": "filebeat",
		"type": "doc",
		"version": "6.5.4"
	},
	"source": "",
	"offset": 0,
	"message": "hello", #Input content
	"prospector": { #Standard input Explorer
		"type": "stdin"
	},
	"input": { #console input
		"type": "stdin"
	},
	"beat": { #beat version and host information
		"name": "itcast01",
		"hostname": "itcast01",
		"version": "6.5.4"
	},
	"host": {
		"name": "itcast01"
	}
}
Read file:
#Read the configuration file item itcast log yml

filebeat.inputs:
- type: log
  enabled: true
  paths:
  	- /itcast/beats/logs/*.log
setup.template.settings:
  index.number_of_shards: 3
output.console:
  pretty: true
  enable: true

#Start filebeat
./filebeat -e -c itcast-log.yml

#/Create a.log file under haoke/beats/logs, and enter the following
hello
world

#Observe the filebeat output
{
	"@timestamp": "2019-01-12T14:16:10.192Z",
	"@metadata": {
		"beat": "filebeat",
		"type": "doc",
		"version": "6.5.4"
	},
	"host": {
		"name": "itcast01"
	},
	"source": "/haoke/beats/logs/a.log",
	"offset": 0,
	"message": "hello",
	"prospector": {
		"type": "log"
	},
	"input": {
		"type": "log"
	},
	"beat": {
		"version": "6.5.4",
		"name": "itcast01",
		"hostname": "itcast01"
	}
}
{
	"@timestamp": "2019-01-12T14:16:10.192Z",
	"@metadata": {
		"beat": "filebeat",
		"type": "doc",
		"version": "6.5.4"
	},
	"prospector": {
		"type": "log"
	},
	"input": {
		"type": "log"
	},
	"beat": {
		"version": "6.5.4",
		"name": "itcast01",
		"hostname": "itcast01"
	},
	"host": {
		"name": "itcast01"
	},
	"source": "/haoke/beats/logs/a.log",
	"offset": 6,
	"message": "world"
}
- It can be seen that if the log file has been detected to be updated, the updated content will be read immediately and output to the console.
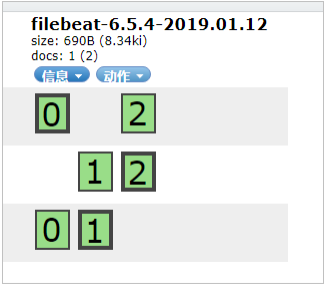
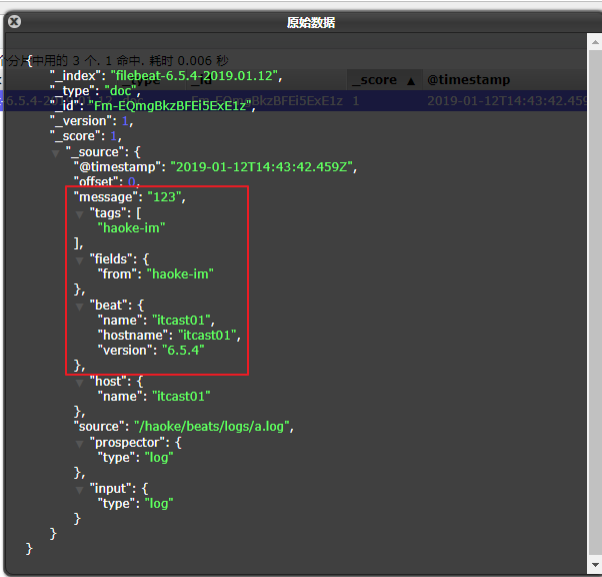
Custom fields:
#Read the configuration file item itcast log yml
filebeat.inputs:
- type: log
  enabled: true
  paths:
  	- /itcast/beats/logs/*.log
  tags: ["web"] #Add a custom tag to facilitate subsequent processing
  fields: #Add custom field
  	from: itcast-im
  fields_under_root: true #true means to add to the root node and false means to add to the child node
setup.template.settings:
	index.number_of_shards: 3
output.console:
	pretty: true
	enable: true

#Start filebeat
./filebeat -e -c itcast-log.yml

#/Create a.log file under haoke/beats/logs, and enter the following
123

#Execution effect
{
	"@timestamp": "2019-01-12T14:37:19.845Z",
	"@metadata": {
		"beat": "filebeat",
		"type": "doc",
		"version": "6.5.4"
	},
	"offset": 0,
	"tags": [
		"haoke-im"
	],
	"prospector": {
		"type": "log"
	},
	"beat": {
		"name": "itcast01",
		"hostname": "itcast01",
		"version": "6.5.4"
	},
	"host": {
		"name": "itcast01"
	},
	"source": "/itcast/beats/logs/a.log",
	"message": "123",
	"input": {
		"type": "log"
	},
	"from": "haoke-im"
}
Output to Elasticsearch:
# itcast-log.yml
filebeat.inputs:
 - type: log
  enabled: true
  paths:
  	- /itcast/beats/logs/*.log
  tags: ["haoke-im"]
  fields:
  	from: haoke-im
  fields_under_root: false
  setup.template.settings:
  	index.number_of_shards: 3 #Specifies the number of partitions for the index
  output.elasticsearch: #Specifies the configuration of the ES
  	hosts: ["192.168.1.7:9200","192.168.1.7:9201","192.168.1.7:9202"]
- Enter new content in the log file to test:
How Filebeat works:
- Filebeat consists of two main components: prospector and harvester.
①harvester:
<1> Responsible for reading the contents of a single file.
<2> If the file is deleted or renamed while reading, Filebeat will continue to read the file.
②prospector
<1> The prospector is responsible for managing the harvester and finding the source of all files to read.
<2> If the input type is log, the finder will find all files with matching paths and start a harvester for each file.
<3> Filebeat currently supports two types of prospector s: log and stdin. - How Filebeat maintains the state of a file:
① Filebeat saves the status of each file and often refreshes the status to the registration file on disk.
② This state is used to remember the last offset being read by the harvester and ensure that all log lines are sent.
③ If the output (such as Elasticsearch or Logstash) is inaccessible, Filebeat tracks the last line sent and continues to read the file when the output is available again.
④ When Filebeat is running, the file state information will also be saved in the memory of each prospector. When Filebeat is restarted, the file state will be reconstructed using the data of the registered file, and Filebeat will continue to read each harvester from the last saved offset.
⑤ The file status is recorded in the data/registry file. - Start command:
./filebeat -e -c itcast.yml
./filebeat -e -c itcast.yml -d "publish"

#Parameter description
	-e: Output to standard output, default output to syslog and logs lower
	-c: Specify profile
	-d: output debug information

#Test:/ filebeat -e -c itcast-log.yml -d "publish"
DEBUG [publish] pipeline/processor.go:308 Publish event: {
	"@timestamp": "2019-01-12T15:03:50.820Z",
	"@metadata": {
		"beat": "filebeat",
		"type": "doc",
		"version": "6.5.4"
	},
	"offset": 0,
	"tags": [
		"haoke-im"
	],
	"input": {
		"type": "log"
	},
	"prospector": {
		"type": "log"
	},
	"beat": {
		"name": "itcast01",
		"hostname": "itcast01",
		"version": "6.5.4"
	},
	"source": "/haoke/beats/logs/a.log",
	"fields": {
		"from": "haoke-im"
	},
	"host": {
		"name": "itcast01"
	},
	"message": "456"
}
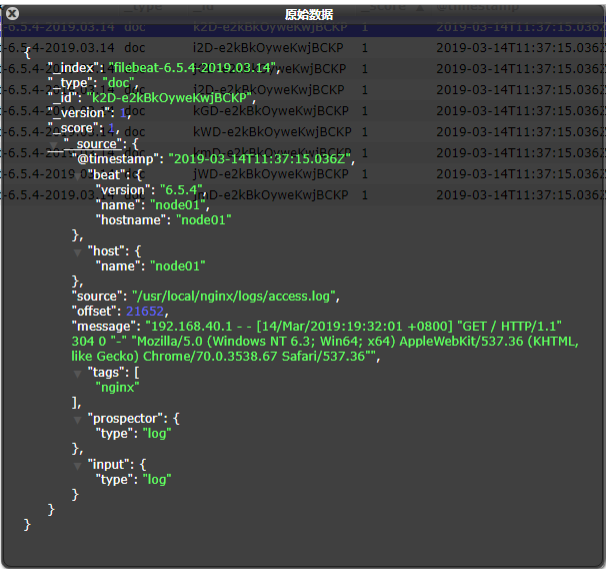
Read Nginx log file:
# itcast-nginx.yml
filebeat.inputs:
- type: log
	enabled: true
	paths:
		- /usr/local/nginx/logs/*.log
	tags: ["nginx"]
setup.template.settings:
	index.number_of_shards: 3 #Specifies the number of partitions for the index
output.elasticsearch: #Specifies the configuration of the ES
	hosts: ["192.168.40.133:9200","192.168.40.134:9200","192.168.40.135:9200"]

#Start/ filebeat -e -c itcast-nginx.yml
- After startup, you can see the index and view the data in Elasticsearch: you can see that the nginx log has been obtained in message, but the content has not been processed, but the original data is read, which is unfavorable for our later operations.
Module:
- To read and process log data, you need to configure it manually. In fact, there are a large number of modules in Filebeat, which can simplify our configuration and can be used directly, as follows:
./filebeat modules list

Enabled:

Disabled:
apache2
auditd
elasticsearch
haproxy
icinga
iis
kafka
kibana
logstash
mongodb
mysql
nginx
osquery
postgresql
redis
suricata
system
traefik
- You can see that there are many built-in modules, but they are not enabled. If you need to enable them, you need to enable them. It can be found that the module of nginx has been enabled.
./filebeat modules enable nginx #start-up
./filebeat modules disable nginx #Disable

Enabled:
nginx

Disabled:
apache2
auditd
elasticsearch
haproxy
icinga
iis
kafka
kibana
logstash
mongodb
mysql
redis
osquery
postgresql
suricata
system
traefik
nginx module configuration:
 - module: nginx
  # Access logs
  access:
    enabled: true
    var.paths: ["/usr/local/nginx/logs/access.log*"]

    # Set custom paths for the log files. If left empty,
    # Filebeat will choose the paths depending on your OS.
    #var.paths:
  # Error logs
  error:
    enabled: true
    var.paths: ["/usr/local/nginx/logs/error.log*"]

    # Set custom paths for the log files. If left empty,
    # Filebeat will choose the paths depending on your OS.
    #var.paths: 9101112131415161718
- Configure filebeat:
#vim itcast-nginx.yml

filebeat.inputs:
#- type: log # enabled: true
# paths:
# - /usr/local/nginx/logs/*.log
# tags: ["nginx"]
setup.template.settings:
  index.number_of_shards: 3
output.elasticsearch:
  hosts: ["192.168.40.133:9200","192.168.40.134:9200","192.168.40.135:9200"]
filebeat.config.modules:
  path: ${path.config}/modules.d/*.yml
  reload.enabled: false
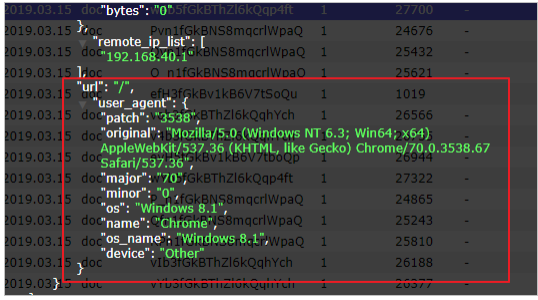
- Test:
./filebeat -e -c itcast-nginx.yml

#An error occurs during startup, as follows
ERROR fileset/factory.go:142 Error loading pipeline: Error loading pipeline for
fileset nginx/access: This module requires the following Elasticsearch plugins:
ingest-user-agent, ingest-geoip. You can install them by running the following
commands on all the Elasticsearch nodes:
   sudo bin/elasticsearch-plugin install ingest-user-agent
   sudo bin/elasticsearch-plugin install ingest-geoip

#Solution: you need to install the ingest user agent and ingest geoip plug-ins in elastic search
#It can be found in the information, ingest user agent tar,ingest-geoip.tar, ingest-geoip-conf.tar
#Among them, ingest user agent tar,ingest-geoip. Extract tar to plugins
#ingest-geoip-conf.tar Unzip to config lower #Problem solving.
- The test found that the data has been written into Elasticsearch, and the obtained data is more clear:
- Of course, for the usage of other modules, refer to the official document, link: Official documents
Metricbeat
Introduction to Metricbeat:
- Metricbeat lightweight indicator collector: used to collect indicators from systems and services. Metricbeat can deliver various system and service statistics in a lightweight way, from CPU to memory, from Redis to Nginx.
- effect:
① Regularly collect indicator data of operating system or application services
② Stored in Elasticsearch for real-time analysis
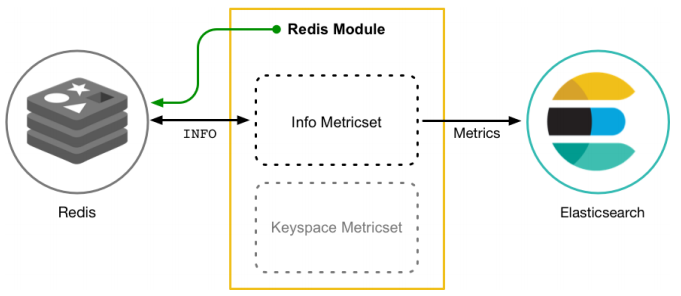
Metricbeat composition:
- Metricbeat consists of two parts, one is Module and the other is Metricset.
① Module: collected objects, such as mysql, redis, nginx, operating system, etc;
② Metricset: collection of indicators, such as cpu, memory, network, etc; - Take Redis Module as an example:
Deploy and collect system indicators:
tar -xvf metricbeat-6.5.4-linux-x86_64.tar.gz
cd metricbeat-6.5.4-linux-x86_64
vim metricbeat.yml
metricbeat.config.modules:
path: ${path.config}/modules.d/*.yml
reload.enabled: false
setup.template.settings:
index.number_of_shards: 1
index.codec: best_compression
setup.kibana:
output.elasticsearch:
hosts: ["192.168.40.133:9200","192.168.40.134:9200","192.168.40.135:9200"]
processors:
- add_host_metadata: ~
- add_cloud_metadata: ~
#start-up
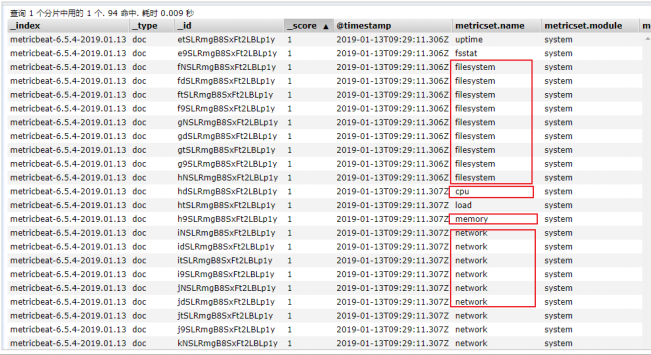
./metricbeat -e
- In ELasticsearch, you can see that some index data of the system have been written in:
- system module configuration:
root@itcast01:modules.d# cat system.yml
# Module: system
# Docs: https://www.elastic.co/guide/en/beats/metricbeat/6.5/metricbeat-module- system.html

- module: system
  period: 10s
  metricsets:
    - cpu
    - load
    - memory
    - network
    - process
    - process_summary
    #- core
    #- diskio
    #- socket
  process.include_top_n:
    by_cpu: 5 # include top 5 processes
    by CPU by_memory: 5 # include top 5 processes by memory

- module: system
  period: 1m
  metricsets:
    - filesystem
    - fsstat
  processors:
  - drop_event.when.regexp:
    system.filesystem.mount_point: '^/(sys|cgroup|proc|dev|etc|host|lib)($|/)'

- module: system
  period: 15m
  metricsets:
    - uptime

#- module: system
# period: 5m
# metricsets:
# - raid
# raid.mount_point: '/'
Module:
./metricbeat modules list #view list

Enabled:
system #Enabled by default

Disabled:
aerospike
apache
ceph
couchbase
docker
dropwizard
elasticsearch
envoyproxy
etcd
golang
graphite
haproxy
http
jolokia
kafka
kibana
kubernetes
kvm
logstash
memcached
mongodb
munin
mysql
nginx
php_fpm
postgresql
prometheus
rabbitmq
redis
traefik
uwsgi
vsphere
windows
zookeeper
Nginx Module:
- Enable nginx status query: in nginx, you need to enable status query to query indicator data.
#Recompile nginx
./configure --prefix=/usr/local/nginx --with-http_stub_status_module
make
make install

./nginx -V #Query version information
nginx version: nginx/1.11.6
built by gcc 4.4.7 20120313 (Red Hat 4.4.7-23) (GCC)
configure arguments: --prefix=/usr/local/nginx --with-http_stub_status_module

#Configure nginx
vim nginx.conf
location /nginx-status {
	stub_status on;
	access_log off;
}
- Test:
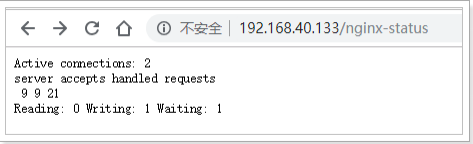
- Result description:
① Active connections: the number of active connections being processed
②server accepts handled requests
<1> The first server indicates that nine connections have been processed since Nginx was started
<2> The second accept indicates that nine handshakes have been successfully created since Nginx was started
<3> The third handled requests indicates that a total of 21 requests were processed
<4> Number of requests lost = number of handshakes - number of connections. It can be seen that there are no requests lost so far
②Reading: 0 Writing: 1 Waiting: 1
<1> Reading: the number of Header information read by Nginx from the client
<2> Writing: the number of Header information returned by Nginx to the client
<3> Waiting: Nginx has finished processing the resident link waiting for the next request instruction (when keep alive is enabled, this value is equal to Active - (Reading+Writing)) - Configure Nginx Module:
#Enable redis module
./metricbeat modules enable nginx

#Modify redis module configuration
vim modules.d/nginx.yml

# Module: nginx
# Docs: https://www.elastic.co/guide/en/beats/metricbeat/6.5/metricbeat-module- nginx.html

- module: nginx
  #metricsets:
  # - stubstatus
  period: 10s

  # Nginx hosts
  hosts: ["http://192.168.40.133"]

  # Path to server status. Default server-status
  server_status_path: "nginx-status"

  #username: "user"
  #password: "secret"

#start-up
./metricbeat -e
- Test:
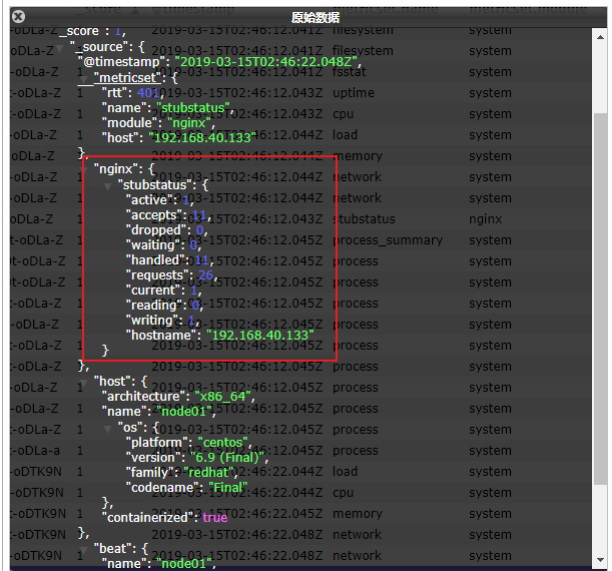
- You can see that the index data of nginx has been written to Elasticsearch.
Kibana
Introduction to Kibana:
- Using the Elastic Stack window, you can visualize the data in elastic search and operate on the Elastic Stack through Kibana. Therefore, you can solve any questions here: for example, why do you receive a page at 2:00 a.m. and how the rain will affect the quarterly data.
- Kibana is an open source data analysis and visualization platform. It is one of the members of Elastic Stack and is designed to cooperate with elastic search. You can use kibana to search, view and interact with the data in the Elasticsearch index. You can easily use charts, tables and maps to conduct diversified analysis and presentation of data.
- Link: Official website
Configure installation:
#Unzip the installation package
tar -xvf kibana-6.5.4-linux-x86_64.tar.gz

#Modify profile
vim config/kibana.yml server.host: "192.168.40.133" #Address of external exposure service
elasticsearch.url: "http://192.168. 40.133:9200 "# configure Elasticsearch

#start-up
./bin/kibana

#Access via browser
http://192.168.40.133:5601/app/kibana
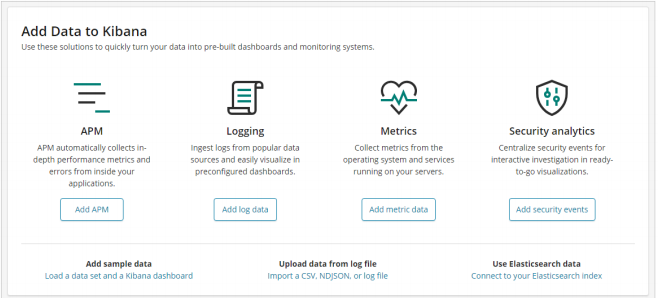
- You can see the kibana page, and you can see the prompt to import data to kibana.
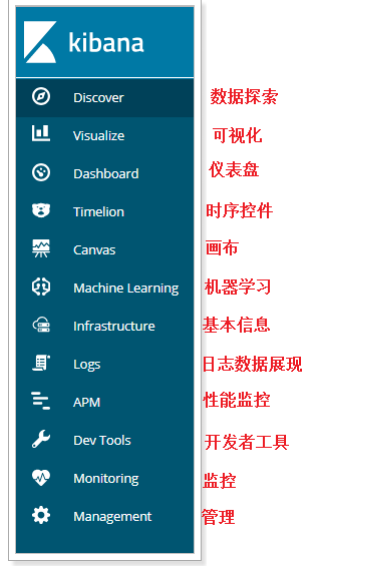
Kibana details:
- Function Description:
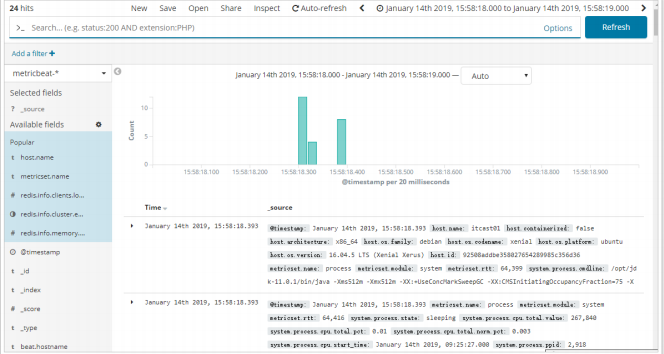
- Data exploration:
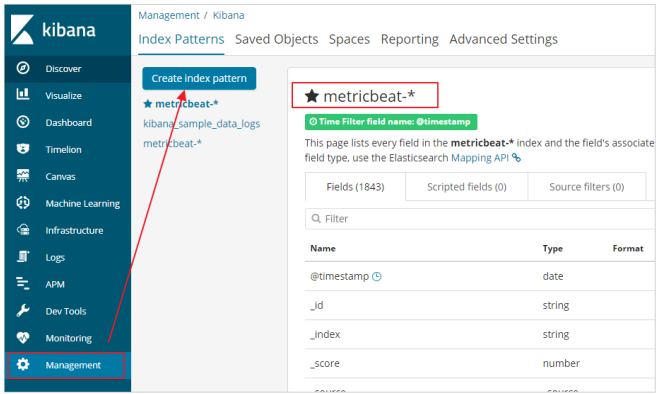
To view index data:
- Metricbeat dashboard: the data of metricbeat can be displayed in Kibana, and the dashboard data can be seen in Kibana.
#Modify the metricbeat configuration
setup.kibana: host: "192.168.40.133:5601" #Install the instrument cluster to kibana/ metricbeat setup --dashboards
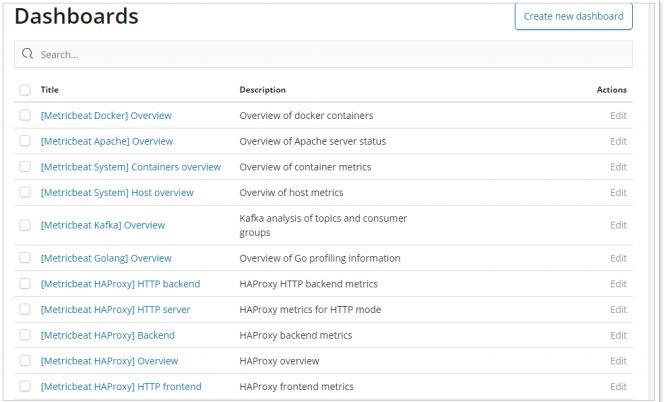
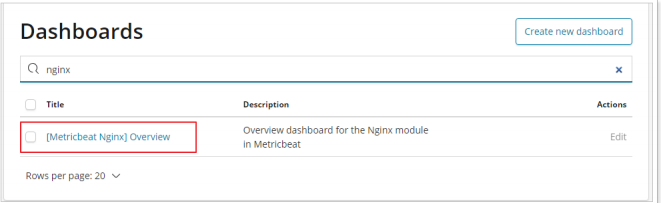
- Nginx indicator dashboard:
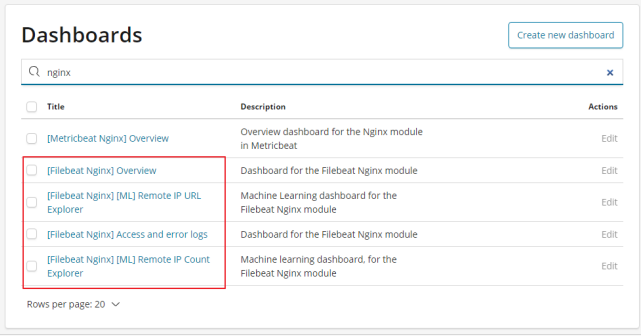
- Nginx log dashboard: you can see the dashboard of nginx FileBeat.
#Modify the configuration file VIM itcast nginx yml
filebeat.inputs:
#- type: log
# enabled: true
# paths:
# - /usr/local/nginx/logs/*.log
# tags: ["nginx"]
setup.template.settings:
	index.number_of_shards: 3
output.elasticsearch:
	hosts: ["192.168.40.133:9200","192.168.40.134:9200","192.168.40.135:9200"] filebeat.config.modules:
	path: ${path.config}/modules.d/*.yml
	reload.enabled: false
setup.kibana:
	host: "192.168.40.133:5601"

#Install the instrument cluster to kibana
./filebeat -c itcast-nginx.yml setup
- Custom chart:
① In Kibana, you can also customize charts, such as making column charts:
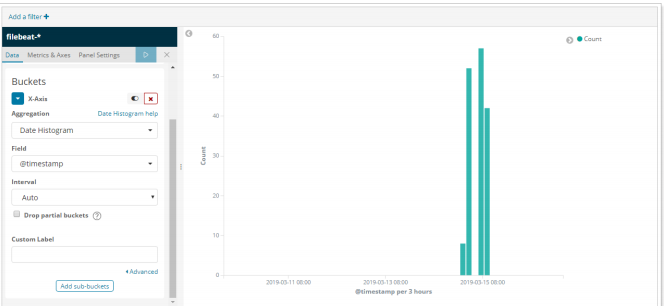
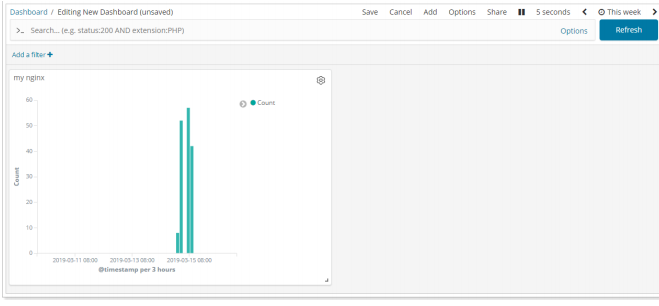
② To add a chart to a custom Dashboard:
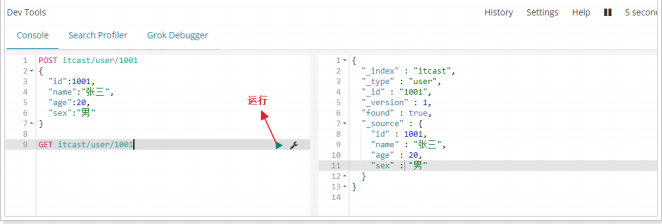
- Developer tools: Kibana provides convenient tools for developers' testing, as follows:
Logstash
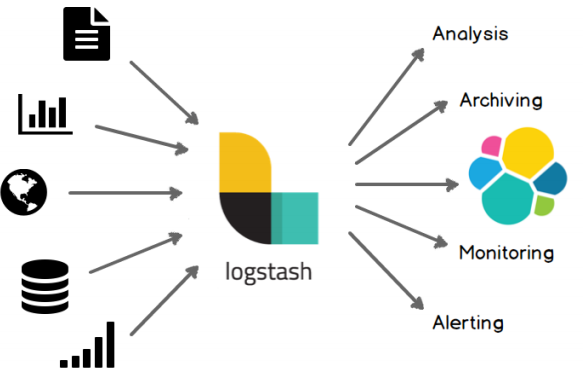
Introduction to Logstash:
- Centralize, transform and store data: Logstash is an open source server-side data processing pipeline, which can collect data from multiple sources at the same time, convert data, and then send data to your favorite "repository". (our repository is Elasticsearch, of course.)
- Purpose:
Deployment installation:
#Check the JDK environment and require jdk1 8+
java -version
#Unzip the installation package
tar -xvf logstash-6.5.4.tar.gz
#First logstash example
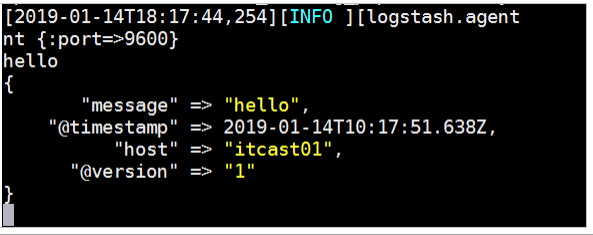
bin/logstash -e 'input { stdin { } } output { stdout {} }'
- The implementation effect is as follows:
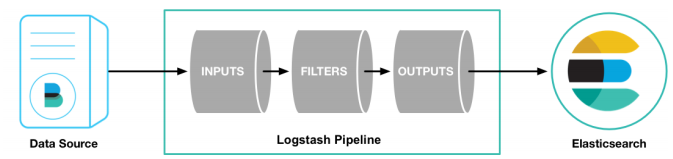
Configuration details:
- The Logstash configuration has three parts, as follows:
input { #input
	stdin { ... } #Standard input
}

filter { #Filtering, data segmentation, interception and other processing
	...
}

output { #output
	stdout { ... } #standard output
}
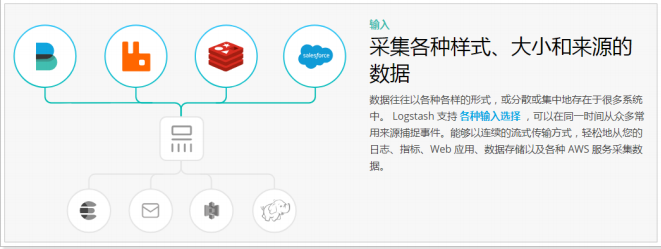
- Input:
① Collect data of various styles, sizes and sources. The data often exist in many systems in various forms, or scattered or centralized.
② Logstash supports various input options and can capture events from many common sources at the same time. It can easily collect data from your logs, indicators, Web applications, data storage and various AWS services in a continuous streaming mode.
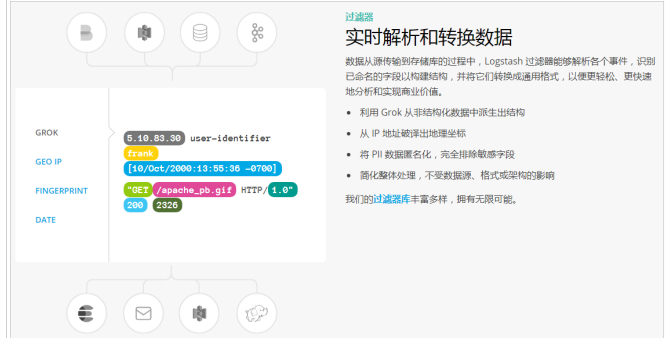
- Filtering:
① Analyze and convert data in real time
② In the process of data transfer from the source to the repository, the Logstash filter can parse various events, identify named fields to build structures, and convert them into a common format to analyze and realize business value more easily and quickly.
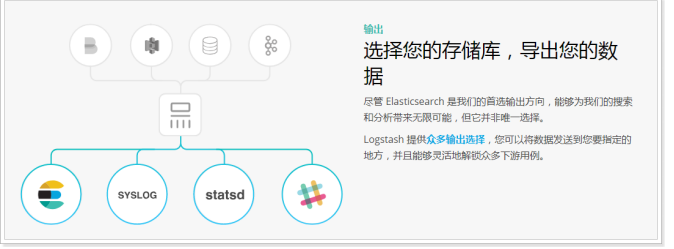
- Output: Logstash provides many output options. You can send data to the place you want to specify, and can flexibly unlock many downstream use cases.
Read custom log:
- Previously, we read nginx logs through Filebeat. If it is a custom structure log, it needs to be read and processed before it can be used. Therefore, Logstash needs to be used at this time, because Logstash has strong processing power and can deal with various scenarios.
- Log structure: it can be seen that the contents of the log are segmented by "|". When using, we also need to segment the data.
2019-03-15 21:21:21|ERROR|Error reading data|Parameters: id=1002 1
- Write profile:
#vim itcast-pipeline.conf

input {
	file {
		path => "/itcast/logstash/logs/app.log"
		start_position => "beginning"
	}
}
filter {
	mutate {
		split => {"message"=>"|"}
	}
}
output {
	stdout {
	codec => rubydebug
	}
}
- Start the test: you can see that the data has been segmented.
#start-up
./bin/logstash -f ./itcast-pipeline.conf

#Write log to file
echo "2019-03-15 21:21:21|ERROR|Error reading data|Parameters: id=1002" >> app.log

#Output results
{
	"@timestamp" => 2019-03-15T08:44:04.749Z,
		"path" => "/itcast/logstash/logs/app.log",
	"@version" => "1",
		"host" => "node01",
	"message" => [
	[0] "2019-03-15 21:21:21",
	[1] "ERROR",
	[2] "Error reading data",
	[3] "Parameters: id=1002"
	]
}
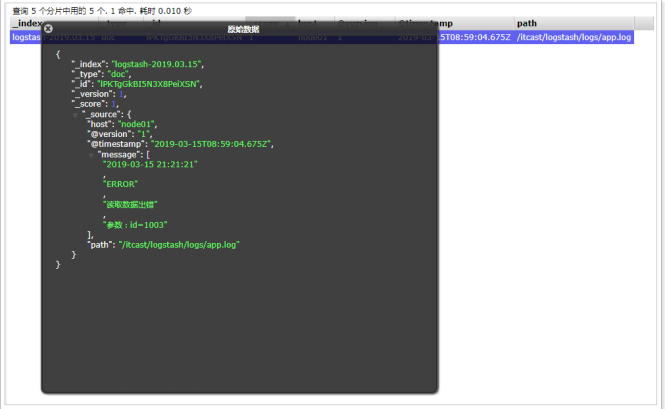
- Output to Elasticsearch:
input {
	file {
		path => "/itcast/logstash/logs/app.log"
		#type => "system"
		start_position => "beginning"
	}
}
filter {
	mutate {
		split => {"message"=>"|"}
	}
}
output {
	elasticsearch {
		hosts => [ "192.168.40.133:9200","192.168.40.134:9200","192.168.40.135:9200"]
	}
}

#start-up
./bin/logstash -f ./itcast-pipeline.conf

#Write data
echo "2019-03-15 21:21:21|ERROR|Error reading data|Parameters: id=1003" >> app.log
- Test: