I. Table of Path's Common Methods
In order to be compatible (lazy), the method added above API21 (Android Version 5.0) is removed from this table. Unable to help Tucao, why does it seem that some overloaded method can be written only when API21 is added. Baby's heart is crumbling at the moment.
| Effect | correlation method | Remarks |
|---|---|---|
| Mobile starting point | moveTo | Move the starting point of the next operation |
| Set end point | setLastPoint | Reset the last point in the current path. If called before drawing, the effect is the same as moveTo. |
| Connecting straight line | lineTo | Add a line from the previous point to the current point to Path |
| Closed path | close | Connect the first point to the last point to form a closed area |
| Add content | addRect, addRoundRect, addOval, addCircle, addPath, addArc, arcTo | Add (rectangle, rounded rectangle, ellipse, circle, path, arc) to the current Path (note the difference between addArc and arcTo) |
| Is it empty? | isEmpty | Judging whether Path is empty |
| Is it a rectangle? | isRect | Determine whether path is a rectangle? |
| Replacement path | set | Replace all contents of the current path with a new path |
| Offset path | offset | Offset the operation before the current path (without affecting the subsequent operation) |
| bezier | quadTo, cubicTo | The Method of Quadratic and Triple Bessel Curves |
| rXxx method | rMoveTo, rLineTo, rQuadTo, rCubicTo | The method without r is based on the origin coordinate system (offset) and the rXxx method is based on the current point coordinate system (offset). |
| Fill mode | setFillType, getFillType, isInverseFillType, toggleInverseFillType | Setting, Getting, Judging and Switching Filling Mode |
| Prompting method | incReserve | Hint how many points Path has to wait to join (this method seems to allow Path to optimize the storage structure) |
| Boolean operation (API19) | op | Boolean operations on two Path s (i.e. taking intersection, union, etc.) |
| Computation boundary | computeBounds | Computing Path's Boundary |
| Reset path | reset, rewind | Clear up content in Path reset does not retain the internal data structure, but it retains FillType. rewind retains the internal data structure, but does not retain FillType |
| Matrix operation | transform | Matrix transformation |
II. Path Details
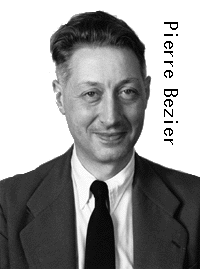
Last time, except for some common functions, the explanation is basically straight lines. This time, we need to understand the curve part. When we talk about curves, we have to nominate the famous Bessel curve. It was invented by the following man (Pierre Bzier, French mathematician).
What can Bessel Curve do?
Bessel curve is widely used. It can be said that Bessel curve lays the foundation of computer graphics (because it can describe any complex graphics in precise mathematical language). It has been used inadvertently.
If you use Photoshop, you may notice that there is a pen tool in it. The core of the pen tool is the Bessel curve.
You said you couldn't PS? It doesn't matter. If you have read the previous articles or used 2D drawing, you must have drawn circles, arcs, rounded rectangles and so on. All of the arc parts are the use of Bessel curves.
Bessel Curve has a very wide range of functions. Let's simply list a few chestnuts: chestnut, chestnut, chestnut, chestnut, chestnut, chestnut, chestnut, chestnut, chestnut and chestnut.
- Dragging effect of QQ small red dot
- Some cool drop-down refresh controls
- The effect of reading software on turning over books
- Making Some Smooth Fold Diagrams
- Many cool animation effects
How to get into Bessel Curve easily?
Although Bessel Curve is widely used, there seems to be no suitable Chinese tutorial at present. Android's Chinese articles about Bessel Curve can be basically divided into the following categories:
* Popular science (just to make people understand Bessel, not substantive content)
* Pretending (putting out a bunch of formulas, quoting a bunch of English texts)
* Basic type (just explaining the use of two functions of Bessel curve)
* Practical Type (Explaining the Application of Bessel Curve Based on Examples)
The more useful of the above types is the basic type and the actual combat type, but both have their own shortcomings. This paper will synthesize the two contents and learn the Bessel curve from scratch.
Step 1. Understanding the Principle of Bessel Curve
Understanding the Bessel curve here is not a process of learning to deduce formulas (not a process of pushing over, but a process of understanding how the Bessel curve is generated).
Bessel curves use a series of points to control the state of the curve. I simply divide these points into two categories:
| type | Effect |
|---|---|
| data point | Determine the starting and ending position of the curve |
| control point | Determine the degree of curve bending |
For the time being, I'll just explain the concept, and then I'll explain its detailed meaning.
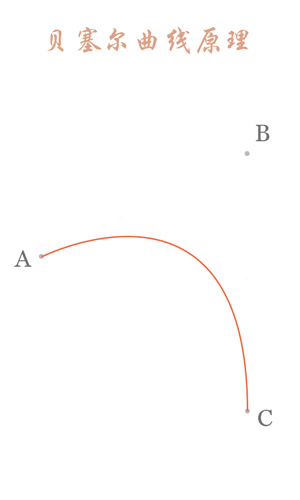
First order curve principle:
The first order curve has no control points, only two data points (A and B), and the final effect is a line segment.
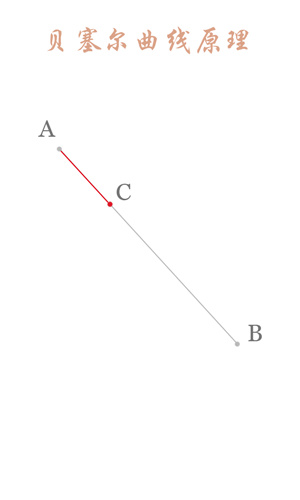
The above figure shows a certain stage in the process of first-order curve generation. The dynamic process can refer to the following figure. (The dynamic demonstration pictures of Bessel curve in this paper are from Wikipedia.)
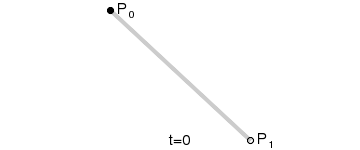
PS: The first-order curve is actually the lineTo described earlier.
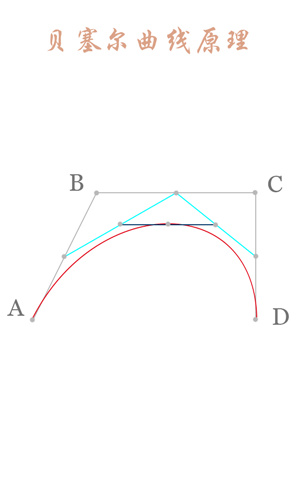
Second-order curve principle:
The second-order curve is described by two data points (A and C) and one control point (B). It is roughly as follows:
The part of the red curve in the picture above is the legendary second-order Bessel curve. How does this red curve come into being? Next, we will analyze one of the states:
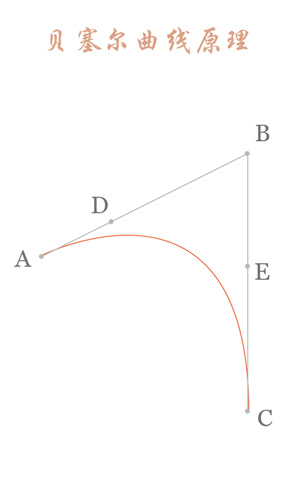
Connect AB BC and take point D on AB and point E on BC to satisfy the conditions:
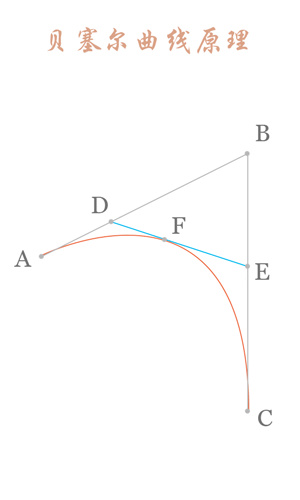
Connect DE, take point F, make:
The obtained point F is a point on the Bessel curve. The dynamic process is as follows:
PS: The method of second-order curve correspondence is quadTo
Third-order curve principle:
The third-order curve is described by two data points (A and D) and two control points (B and C), as follows:
The process of calculating the third-order curve is similar to that of the second-order curve.
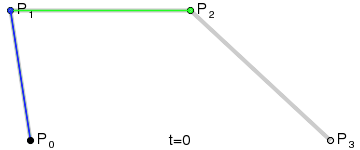
PS: The third-order curve corresponds to cubicTo
Bessel Curve Quick Lookup Table
Strongly recommend click here Practicing Bessel curve can deepen the understanding of Bessel curve.
Step 2. Understanding the use of Bessel curve correlation function
First order curve:
The first order curve is a line segment. It's very simple. See the previous article. Basic Operation of Path I won't go into details here.
Second order curve:
Through the simple understanding of the second-order curve above, we know that the second-order curve is composed of two data points and a control point. Next, we use an example to demonstrate how the second-order curve is used.
Firstly, two data points control the position of Bessel curve beginning and ending, which is easy to understand, while the control point controls Bessel curve bending state, which is relatively difficult to understand. Therefore, this example focuses on understanding the relationship between Bessel curve bending state and control point.
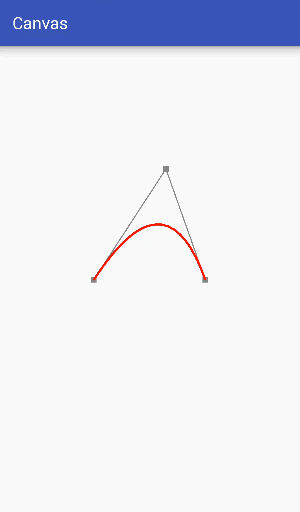
In order to make it easier to see the relationship between the control points and the bending degree of the curve, the auxiliary points and the auxiliary lines are drawn in the figure above. From the dynamic diagram above, it can be seen that the Bessel curve has the same elastic effect as the rubber band in the process of dynamic change, so it is often used in making some elastic effects.
The main code is as follows:
public class Bezier extends View {

    private Paint mPaint;
    private int centerX, centerY;

    private PointF start, end, control;

    public Bessel1(Context context) {
        super(context);
        mPaint = new Paint();
        mPaint.setColor(Color.BLACK);
        mPaint.setStrokeWidth(8);
        mPaint.setStyle(Paint.Style.STROKE);
        mPaint.setTextSize(60);

        start = new PointF(0,0);
        end = new PointF(0,0);
        control = new PointF(0,0);
    }

    @Override
    protected void onSizeChanged(int w, int h, int oldw, int oldh) {
        super.onSizeChanged(w, h, oldw, oldh);
        centerX = w/2;
        centerY = h/2;

        // Initialize the location of data points and control points
        start.x = centerX-200;
        start.y = centerY;
        end.x = centerX+200;
        end.y = centerY;
        control.x = centerX;
        control.y = centerY-100;
    }

    @Override
    public boolean onTouchEvent(MotionEvent event) {
        // Update control points according to touch position and prompt redrawing
        control.x = event.getX();
        control.y = event.getY();
        invalidate();
        return true;
    }

    @Override
    protected void onDraw(Canvas canvas) {
        super.onDraw(canvas);

        // Drawing data points and control points
        mPaint.setColor(Color.GRAY);
        mPaint.setStrokeWidth(20);
        canvas.drawPoint(start.x,start.y,mPaint);
        canvas.drawPoint(end.x,end.y,mPaint);
        canvas.drawPoint(control.x,control.y,mPaint);

        // Drawing auxiliary lines
        mPaint.setStrokeWidth(4);
        canvas.drawLine(start.x,start.y,control.x,control.y,mPaint);
        canvas.drawLine(end.x,end.y,control.x,control.y,mPaint);

        // Drawing Bessel Curve
        mPaint.setColor(Color.RED);
        mPaint.setStrokeWidth(8);

        Path path = new Path();

        path.moveTo(start.x,start.y);
        path.quadTo(control.x,control.y,end.x,end.y);

        canvas.drawPath(path, mPaint);
    }
}
- 1
- 2
- 3
- 4
- 5
- 6
- 7
- 8
- 9
- 10
- 11
- 12
- 13
- 14
- 15
- 16
- 17
- 18
- 19
- 20
- 21
- 22
- 23
- 24
- 25
- 26
- 27
- 28
- 29
- 30
- 31
- 32
- 33
- 34
- 35
- 36
- 37
- 38
- 39
- 40
- 41
- 42
- 43
- 44
- 45
- 46
- 47
- 48
- 49
- 50
- 51
- 52
- 53
- 54
- 55
- 56
- 57
- 58
- 59
- 60
- 61
- 62
- 63
- 64
- 65
- 66
- 67
- 68
- 69
- 70
- 71
- 72
- 73
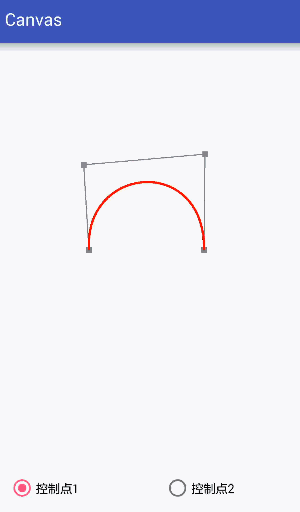
Third-order curve:
The third-order curve is controlled by two data points and two control points.
Code:
public class Bezier2 extends View {

    private Paint mPaint;
    private int centerX, centerY;

    private PointF start, end, control1, control2;
    private boolean mode = true;

    public Bezier2(Context context) {
        this(context, null);

    }

    public Bezier2(Context context, AttributeSet attrs) {
        super(context, attrs);

        mPaint = new Paint();
        mPaint.setColor(Color.BLACK);
        mPaint.setStrokeWidth(8);
        mPaint.setStyle(Paint.Style.STROKE);
        mPaint.setTextSize(60);

        start = new PointF(0, 0);
        end = new PointF(0, 0);
        control1 = new PointF(0, 0);
        control2 = new PointF(0, 0);
    }

    public void setMode(boolean mode) {
        this.mode = mode;
    }

    @Override
    protected void onSizeChanged(int w, int h, int oldw, int oldh) {
        super.onSizeChanged(w, h, oldw, oldh);
        centerX = w / 2;
        centerY = h / 2;

        // Initialize the location of data points and control points
        start.x = centerX - 200;
        start.y = centerY;
        end.x = centerX + 200;
        end.y = centerY;
        control1.x = centerX;
        control1.y = centerY - 100;
        control2.x = centerX;
        control2.y = centerY - 100;

    }

    @Override
    public boolean onTouchEvent(MotionEvent event) {
        // Update control points according to touch position and prompt redrawing
        if (mode) {
            control1.x = event.getX();
            control1.y = event.getY();
        } else {
            control2.x = event.getX();
            control2.y = event.getY();
        }
        invalidate();
        return true;
    }

    @Override
    protected void onDraw(Canvas canvas) {
        super.onDraw(canvas);
        //drawCoordinateSystem(canvas);

        // Drawing data points and control points
        mPaint.setColor(Color.GRAY);
        mPaint.setStrokeWidth(20);
        canvas.drawPoint(start.x, start.y, mPaint);
        canvas.drawPoint(end.x, end.y, mPaint);
        canvas.drawPoint(control1.x, control1.y, mPaint);
        canvas.drawPoint(control2.x, control2.y, mPaint);

        // Drawing auxiliary lines
        mPaint.setStrokeWidth(4);
        canvas.drawLine(start.x, start.y, control1.x, control1.y, mPaint);
        canvas.drawLine(control1.x, control1.y,control2.x, control2.y, mPaint);
        canvas.drawLine(control2.x, control2.y,end.x, end.y, mPaint);

        // Drawing Bessel Curve
        mPaint.setColor(Color.RED);
        mPaint.setStrokeWidth(8);

        Path path = new Path();

        path.moveTo(start.x, start.y);
        path.cubicTo(control1.x, control1.y, control2.x,control2.y, end.x, end.y);

        canvas.drawPath(path, mPaint);
    }
}
- 1
- 2
- 3
- 4
- 5
- 6
- 7
- 8
- 9
- 10
- 11
- 12
- 13
- 14
- 15
- 16
- 17
- 18
- 19
- 20
- 21
- 22
- 23
- 24
- 25
- 26
- 27
- 28
- 29
- 30
- 31
- 32
- 33
- 34
- 35
- 36
- 37
- 38
- 39
- 40
- 41
- 42
- 43
- 44
- 45
- 46
- 47
- 48
- 49
- 50
- 51
- 52
- 53
- 54
- 55
- 56
- 57
- 58
- 59
- 60
- 61
- 62
- 63
- 64
- 65
- 66
- 67
- 68
- 69
- 70
- 71
- 72
- 73
- 74
- 75
- 76
- 77
- 78
- 79
- 80
- 81
- 82
- 83
- 84
- 85
- 86
- 87
- 88
- 89
- 90
- 91
- 92
- 93
- 94
- 95
- 96
Compared with the second-order curve, the third-order curve can produce more complex shapes, but for the higher-order curve, the combination of lower-order curves can achieve the same effect, that is, the legendary order reduction. Therefore, we usually encapsulate Bessel curves up to third-order curves.
Reduction and Upgrading
| type | Interpretation | change |
|---|---|---|
| reduced order | When the shape and direction of the curve remain unchanged, the number of control points is reduced, that is, the order of the curve is reduced. | The method becomes simple, the number of data points increases, the number of control points decreases, and the flexibility decreases. |
| ascend the stairs | When the shape and direction of the curve remain unchanged, the number of control points is increased, that is, the order of the curve is increased. | The method is more complex, the data points remain unchanged, the control points increase, and the flexibility becomes stronger. |
Step 3. Examples of Bessel Curve
Before making this example, first of all, we need to clarify one thing: under what circumstances do we need to use the Bessel curve?
When irregular graphics need to be drawn? Of course not! At present, I think the use of Bessel curve mainly has the following aspects (personal humble opinion, there may be errors, welcome to correct)
| Serial number | content | use case |
|---|---|---|
| 1 | Do not know the state of curve beforehand and need real-time calculation | Smooth Breakdown Map of Temperature Change in Weather Forecast |
| 2 | When the display status changes according to the user's operation | QQ Little Red Spot, Simulate the Return of Books |
| 3 | Some of the more complex states of motion (used with PathMeasure) | Animation effect of complex motion state |
As for the case that only one static curve graph is needed, it would be better to use pictures, and a lot of calculation would be very inexpensive.
If the SVG vector graph is displayed, there are already relevant analytical tools (the Bessel curve is still used internally), and no manual calculation is needed.
The main advantage of Bessel curve is that it can control the state of curve in real time and make the curve change smoothly in real time by changing the state of control point.
Next, let's use a simple example to make a circle gradually become a heart shape:
Design sketch:
Idea analysis:
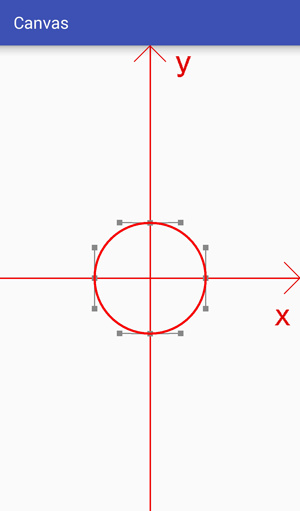
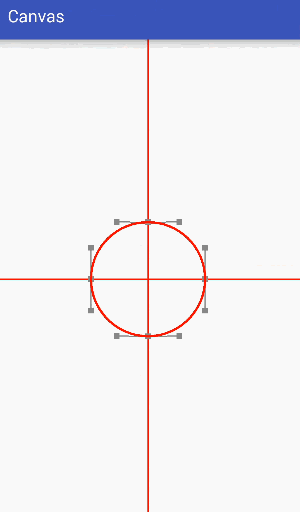
The final effect we need is to transform a circle into a heart. Through analysis, we can see that a circle can be composed of four third-order Bessel curves, as follows:
The heart shape can also be composed of four third-order Bessel curves, as follows:
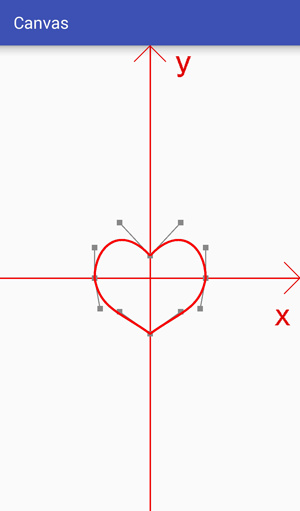
The difference between them is only that the positions of data points and control points are different, so it is only necessary to adjust the positions of data points and control points to change the circle into a heart shape.
Core difficulties:
1. How to get the location of data points and control points?
The use of data points and control points to draw a circle has been calculated in detail for a long time, and you can refer to an answer from stack overflow. How to create circle with Bézier curves? The data only need to be used.
For the heart-shaped data points and control points, the circular part of the data points and control points can be translated, and the specific parameters can be slowly adjusted to a satisfactory effect.
2. How to achieve gradual effect?
Gradient is to move data points and control points a little at a time, then redraw the interface, adjust data points and control points several times in a short time, so that they gradually approach the target value, and achieve a gradient effect by constantly redrawing the interface. The process can refer to the following dynamic effects:
Code:
public class Bezier3 extends View {
    private static final float C = 0.551915024494f;     // A constant used to calculate the position of control points in drawing circular Bessel curves

    private Paint mPaint;
    private int mCenterX, mCenterY;

    private PointF mCenter = new PointF(0,0);
    private float mCircleRadius = 200;                  // Radius of circle
    private float mDifference = mCircleRadius*C;        // The difference between the control point and the data point of a circle

    private float[] mData = new float[8];               // Clockwise Recording of Four Data Points Drawing a Circle
    private float[] mCtrl = new float[16];              // Clockwise Recording of Eight Control Points for Drawing a Circle

    private float mDuration = 1000;                     // Total change duration
    private float mCurrent = 0;                         // Currently in progress
    private float mCount = 100;                         // How many copies of the total length will be divided
    private float mPiece = mDuration/mCount;            // The length of each share


    public Bezier3(Context context) {
        this(context, null);

    }

    public Bezier3(Context context, AttributeSet attrs) {
        super(context, attrs);

        mPaint = new Paint();
        mPaint.setColor(Color.BLACK);
        mPaint.setStrokeWidth(8);
        mPaint.setStyle(Paint.Style.STROKE);
        mPaint.setTextSize(60);


        // Initialize data points

        mData[0] = 0;
        mData[1] = mCircleRadius;

        mData[2] = mCircleRadius;
        mData[3] = 0;

        mData[4] = 0;
        mData[5] = -mCircleRadius;

        mData[6] = -mCircleRadius;
        mData[7] = 0;

        // Initialization control point

        mCtrl[0]  = mData[0]+mDifference;
        mCtrl[1]  = mData[1];

        mCtrl[2]  = mData[2];
        mCtrl[3]  = mData[3]+mDifference;

        mCtrl[4]  = mData[2];
        mCtrl[5]  = mData[3]-mDifference;

        mCtrl[6]  = mData[4]+mDifference;
        mCtrl[7]  = mData[5];

        mCtrl[8]  = mData[4]-mDifference;
        mCtrl[9]  = mData[5];

        mCtrl[10] = mData[6];
        mCtrl[11] = mData[7]-mDifference;

        mCtrl[12] = mData[6];
        mCtrl[13] = mData[7]+mDifference;

        mCtrl[14] = mData[0]-mDifference;
        mCtrl[15] = mData[1];
    }


    @Override
    protected void onSizeChanged(int w, int h, int oldw, int oldh) {
        super.onSizeChanged(w, h, oldw, oldh);
        mCenterX = w / 2;
        mCenterY = h / 2;
    }


    @Override
    protected void onDraw(Canvas canvas) {
        super.onDraw(canvas);
         drawCoordinateSystem(canvas);       // Drawing coordinate system

        canvas.translate(mCenterX, mCenterY); // Move the coordinate system to the center of the canvas
        canvas.scale(1,-1);                 // Flip Y axis

        drawAuxiliaryLine(canvas);


        // Drawing Bessel Curve
        mPaint.setColor(Color.RED);
        mPaint.setStrokeWidth(8);

        Path path = new Path();
        path.moveTo(mData[0],mData[1]);

        path.cubicTo(mCtrl[0],  mCtrl[1],  mCtrl[2],  mCtrl[3],     mData[2], mData[3]);
        path.cubicTo(mCtrl[4],  mCtrl[5],  mCtrl[6],  mCtrl[7],     mData[4], mData[5]);
        path.cubicTo(mCtrl[8],  mCtrl[9],  mCtrl[10], mCtrl[11],    mData[6], mData[7]);
        path.cubicTo(mCtrl[12], mCtrl[13], mCtrl[14], mCtrl[15],    mData[0], mData[1]);

        canvas.drawPath(path, mPaint);

        mCurrent += mPiece;
        if (mCurrent < mDuration){

            mData[1] -= 120/mCount;
            mCtrl[7] += 80/mCount;
            mCtrl[9] += 80/mCount;

            mCtrl[4] -= 20/mCount;
            mCtrl[10] += 20/mCount;

            postInvalidateDelayed((long) mPiece);
        }
    }

    // Drawing auxiliary lines
    private void drawAuxiliaryLine(Canvas canvas) {
        // Drawing data points and control points
        mPaint.setColor(Color.GRAY);
        mPaint.setStrokeWidth(20);

        for (int i=0; i<8; i+=2){
            canvas.drawPoint(mData[i],mData[i+1], mPaint);
        }

        for (int i=0; i<16; i+=2){
            canvas.drawPoint(mCtrl[i], mCtrl[i+1], mPaint);
        }


        // Drawing auxiliary lines
        mPaint.setStrokeWidth(4);

        for (int i=2, j=2; i<8; i+=2, j+=4){
            canvas.drawLine(mData[i],mData[i+1],mCtrl[j],mCtrl[j+1],mPaint);
            canvas.drawLine(mData[i],mData[i+1],mCtrl[j+2],mCtrl[j+3],mPaint);
        }
        canvas.drawLine(mData[0],mData[1],mCtrl[0],mCtrl[1],mPaint);
        canvas.drawLine(mData[0],mData[1],mCtrl[14],mCtrl[15],mPaint);
    }

    // Drawing coordinate system
    private void drawCoordinateSystem(Canvas canvas) {
        canvas.save();                      // Drawing coordinate system

        canvas.translate(mCenterX, mCenterY); // Move the coordinate system to the center of the canvas
        canvas.scale(1,-1);                 // Flip Y axis

        Paint fuzhuPaint = new Paint();
        fuzhuPaint.setColor(Color.RED);
        fuzhuPaint.setStrokeWidth(5);
        fuzhuPaint.setStyle(Paint.Style.STROKE);

        canvas.drawLine(0, -2000, 0, 2000, fuzhuPaint);
        canvas.drawLine(-2000, 0, 2000, 0, fuzhuPaint);

        canvas.restore();
    }
}
- 1
- 2
- 3
- 4
- 5
- 6
- 7
- 8
- 9
- 10
- 11
- 12
- 13
- 14
- 15
- 16
- 17
- 18
- 19
- 20
- 21
- 22
- 23
- 24
- 25
- 26
- 27
- 28
- 29
- 30
- 31
- 32
- 33
- 34
- 35
- 36
- 37
- 38
- 39
- 40
- 41
- 42
- 43
- 44
- 45
- 46
- 47
- 48
- 49
- 50
- 51
- 52
- 53
- 54
- 55
- 56
- 57
- 58
- 59
- 60
- 61
- 62
- 63
- 64
- 65
- 66
- 67
- 68
- 69
- 70
- 71
- 72
- 73
- 74
- 75
- 76
- 77
- 78
- 79
- 80
- 81
- 82
- 83
- 84
- 85
- 86
- 87
- 88
- 89
- 90
- 91
- 92
- 93
- 94
- 95
- 96
- 97
- 98
- 99
- 100
- 101
- 102
- 103
- 104
- 105
- 106
- 107
- 108
- 109
- 110
- 111
- 112
- 113
- 114
- 115
- 116
- 117
- 118
- 119
- 120
- 121
- 122
- 123
- 124
- 125
- 126
- 127
- 128
- 129
- 130
- 131
- 132
- 133
- 134
- 135
- 136
- 137
- 138
- 139
- 140
- 141
- 142
- 143
- 144
- 145
- 146
- 147
- 148
- 149
- 150
- 151
- 152
- 153
- 154
- 155
- 156
- 157
- 158
- 159
- 160
- 161
- 162
- 163
- 164
- 165
- 166
- 167
- 168
Three. Conclusion
In fact, the most important thing about Bessel curve is to understand the way of Bessel curve generation. Only by understanding the way of Bessel curve generation can we make better use of Bessel curve. At the end of the last article, I said that this article would involve a little bit of self-intersection graphics rendering. Unfortunately, this article is missing. Please look forward to the next one (possibly o()) o in the next one), and the next one is still about Path, which will teach you something more interesting.
Unlock the new realm [Draw an elastic circle]: