preface
- This paper is about the experimental record of Raft in 2022-MIT 6.828;
- If you find any mistakes in the content, please don't be stingy with your keyboard.
Basic concepts of Raft
How does Raft work
Raft is a relatively simple consensus algorithm for Paxos, but no matter how simple "how raft works" can not be solved in a few words, and I didn't want to solve it in a few words. So I'm watching Raft paper After that, here are two pages to help you understand how Raft works:
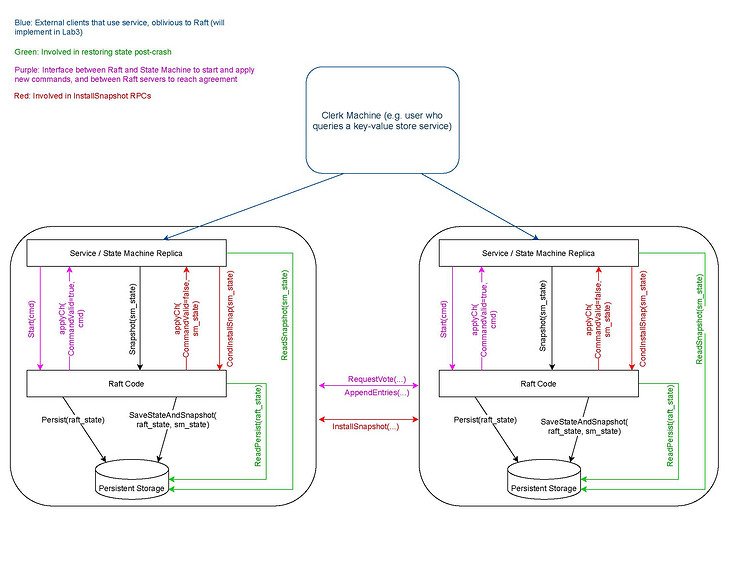
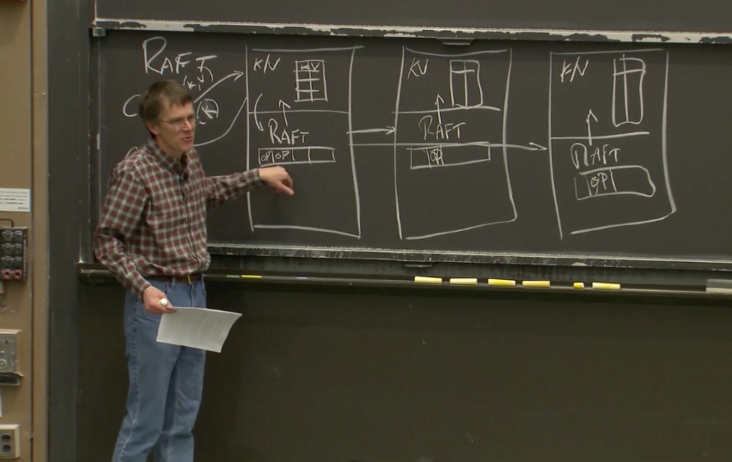
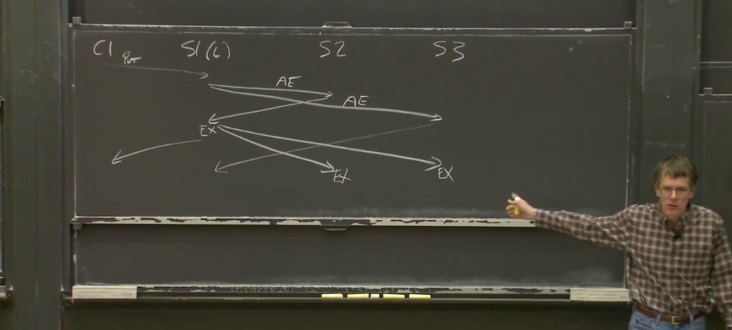
In addition, there are three pictures that I think are very helpful for me to understand Raft. The first one is in the experimental instruction
How the replicated service and raft communication, the second and third are screenshots of the blackboard taught by Professor Morris:
Protocol constraints on four pointers
The constraints in Figure 3 are the basis for the correct operation of the Raft consensus algorithm. The Raft code base we will implement is to implement these constraints:
lastApplied <= commitIndex <= matchIndex < nextIndex
- matchIndex and nextIndex are fields unique to leaders;
- In all nodes, there is the above relationship between lastApplied and commitIndex;
- The Leader has the above relationship with the commitIndex and matchIndex of more than half of the peer s it maintains.
- In the Leader, the matchIndex and nextIndex of any peer it maintains have the above relationship.
- Whether Leader's lastApplied or Follower's lastApplied, they should try their best to catch up with their respective commitIndex. On the way, they need to return the LogEntry to the upper application through applyCh.
Leader's commitIndex:
- for index := Log.firstLogIndex() + 1; index <= Log.LastLogIndex(); index++
- Skip all logs at(index). term != Currentterm's log, because in order to solve the safety problem in Figure 8, leaders can only submit logs during their tenure.
- Find a maximum index. In matchIndex [], make at least half of the matchindexes greater than or equal to this index. Finally, commitindex: = index.
The commitIndex of Follower is less than or equal to leaderCommit, because Follower can only submit after the Leader submits. Therefore, when leaderCommit > commitIndex, commitIndex = min(leaderCommit, index of last new entry).
- There are many reasons for leadercommit > commitindex, which may be due to the fact that the Follower has been offline for a while, the packet loss of AppendEntries RPC before the Leader, or the simple slow running of Follower, which leads to the failure of Follower to synchronize in time.
The constraint relationship between the matchIndex and nextIndex of the Leader is a little complex, which depends on the implementation of Log Consistency, that is, how to solve the inconsistency between the Leader and the Log Replica of the Follower in Figure 7. The paper mentioned a basic version and an optimization method, and this optimized version is exactly what we want to do in Part 2C. But before that, it was provided through TA Student Guide To briefly describe matchIndex and nextIndex:
- nextIndex is a guess as to what prefix the leader shares with a given follower. It is generally quite optimistic (we share everything), and is moved backwards only on negative responses.
matchIndex is used for safety. It is a conservative measurement of what prefix of the log the leader shares with a given follower.
- Although the relationship between matchIndex + 1 == nextIndex will eventually stabilize, when actually writing code, do not directly update matchIndex with the value of nextIndex - 1, because the value of nextIndex may change during sending PRC, so args is required Prevlogindex + len (args. Entries) to update matchIndex.
Log Replication
The basic version iteratively searches for the appropriate nextIndex value of the Follower one by one. The optimized version improves the step on the algorithm of the basic version, that is to search the target value iteratively one term by one term. The basic version is described in detail in Raft Paper, but the key of the optimized version is mentioned in one sentence, and the logic of this part is not explained in detail, but fortunately TA's Student Guide The implementation of pseudo code level is provided. The basic version is in section 5.3 of Paper, and every sentence should be understood. This directly introduces the iterative search algorithm of the optimized version:
- In the Leader, prevlogindex: = nextindex - 1; prevLogTerm := Log. at(prevLogIndex). Term, send AppendEntries RPC Request to Follower;
Follow to execute Consistency Check:
If prevLogIndex exceeds the local log range, make conflictterm: = - 1, and the Leader will set nextindex: = conflictindex + 1:
- When prevlogindex > log When lastlogindex(), conflictindex: = log Lastlogindex(), reply Success: = false and return;
- When prevlogindex < log When firstlogindex(), conflictindex: = log Firstlogindex(), will reply Success: = false and return;
- Else If Log.at(prevIndex).term != prevLogTerm, then make conflictTerm: = log at(prevIndex). Term, and then find the LogEntry belonging to conflictTerm with the smallest index in the local log. Finally, make conflictindex: = index and reply Success: = false and return.
Else indicates that the match is successful without any conflict, but don't worry about truncating the log after pervLogIndex, because the network has always been unreliable, and the AppendEntries RPC Request sent by the Leader may arrive in disorder. What we need to do is to check whether the Follower's daily log has all contained the sent args entries:
- If all are included, do not truncate any logs and reply Success: = true and returned;
- Else, truncate all logs after prevLogIndex and set args Entries are appended to the tail of the local log, and finally reply Success: = true and returned.
The Leader updates nextIndex and matchIndex according to the Consistency Check results.
- If reply.success == true, it proves that the match is successful, matchindex: = args prevIndex + len(args.entries),nextIndex := matchIndex + 1;
- Else If reply.conflictTerm == -1, make nextindex: = conflictindex + 1;
Else, the Leader searches the local log for the existence of a log with a tenure of conflictTerm:
- If exists, set the maximum index of these logs belonging to conflictTerm as index, then make nextindex: = index + 1;
- Else, make nextindex: = conflictindex.
Program testing and debugging
Basic concepts of testing
The definition of Error and Fault written on Lab Guidance is very clear:
Fault is hidden in the code and the cause of Error. typo or understanding deviation of the agreement can be regarded as fault.
- Both Fault and error exist objectively. Error is the result of an instantiation of some faults.
Error refers to the deviation between the theoretically correct state of the program and the actual state of the program at a certain time.
Late error: propagates implicitly in the code and eventually evolves into Observable Error or Masked Error;
- For example, in Raft, a Log Entry is incorrectly appended to the local log.
Observable Error: inconsistency in the output of the program, such as output error information, output results inconsistent with expectations, etc;
- The above wrong Log Entry was submitted incorrectly, resulting in an error in the test;
Masked Error: for some reason, such as implementation features or design, the previous late error can be ignored.
- The above error Log Entry was overwritten by other log entries before it became an Observable Error.
Instrumentation is a piece of code that can report the current program status.
- It can deliberately detect a possible error, such as assert() statement and log Fatalf() statement, etc;
- It can also print the current status, so that we can judge any possible errors according to these historical operation information, such as printf() statement and log Printf () statement, etc.
You may have noticed that the Consistency Check algorithm introduced in the previous section cannot distinguish between the situation with Extraneous Log (late error) in Figure 7 (c)(d) and the normal situation without Extraneous Log and Miss Log (Correct Status), that is, the Leader sends an AppendEntries RPC Request, (c)(d) it cannot truncate its own log. This is a masked error and does not affect the final execution of the program to the correct state.
There are two methods of debugging. One is Fault to Error, which is called forward debugging, and the other is Error to Fault, which is called reverse debugging. The former is typically a white box test, while the latter is typically a black box test.
In all labs of 6.824, you will apply the method of reverse debugging, because the attached black box test program can immediately reflect the Error information of the program. What we need to do is to lock the location of the Fault. At first, you need to guess the location of the Fault, and then add some instruments according to your assumptions to make the Error appear as soon as possible, so as to narrow the scope of the Fault. If the hypothesis is verified (through current first observable error) and found to be untenable, change another hypothesis to continue the test. Finally, after several rounds of iteration, the exact location of the Fault (which can be accurate to a line of code) can be obtained through continuous approximation.
A useful tip is that during an iteration within the program, you can insert instrumentation into the code through binary search to speed up the debugging process. This technique is very useful for simple programs, but for some large and complex systems, it is often difficult for you to judge where the boundary of an iterative operation is, and where the "middle" of this operation is.
Quickly designing and implementing your own excellent Instrumentation for a program debugging is a test of the programmer's experience and skills. The following are some practices in designing Instrumentation:
How much detail do you need from your instrumentation? Either in general, or just for the current step in your debugging process? How can you make it easier to adjust the level of detail and the main focus of your instrumentation? Can you turn on or off different pieces of debugging without deleting them from your code?
(In particular, consider using an approach like the provided DPrintf function does, and defining one or more constant boolean flags to turn on or off different aspects of your instrumentation.)
How can you optimize your own ability to quickly read and understand what your instrumentation is indicating? Can you use text colors, columns, consistent formats, codewords, or symbols to make it easier to read?
The best approach will be personalized to the particular way that YOU best percieve information, so you should experiment to find out what works well for you.
How can you enhance your own ability to add instrumentation? Can you use existing tools (like the go "log" package) to help? (I recommend turning on the Lmicroseconds flag, if you do.)
Can you build your own helper functions, so that a common set of data (current server, term, and role, perhaps?) will always be displayed?
- You might also consider trying to condense each individual event you report into a single line to facilitate your ability to scan output quickly.
Excellent practice of Lab 2 debugging
The TA of this course provides students with the Instrumentation he is doing Debugging by Pretty Printing . Matching these before doing the experiment can greatly improve your debugging efficiency.
Compared with the traditional debugging methods introduced above, GDB undoubtedly exists like a very black technology, because it can always display all the states of the program, but it still can't resist the particularity of Raft because of the timeout mechanism. Of course, it's not impossible for you to run a GDB on each physical node, but once there are more physical nodes, debugging with GDB may kill you.
So at this time, we can only rely on the log information printed out by the program to help us troubleshoot. However, the log information generated by these has these three characteristics: complex, huge and low signal-to-noise ratio. Therefore, a lot of time will be spent on debugging. Since Time is money, the practice goal here is to make the log information more readable, so as to shorten the debugging time. Specifically, there are the following points:
The log output needs to follow a certain format to make the output results regular and convenient for reading and subsequent script processing;
- Who is printing each line and what topic the message is related to.
- When the message has been printed out (optional, ususally using a timestamp to represent that)
Try to output only necessary event information to the log to reduce invalid information;
- Confirm the top set, and it's better to have no many types of event related to each topic.
- If there are too many associated events, consider dividing them into several smaller topic s and pay attention to controlling the granularity.
- The description of topic and event should be accurate.
These log information is formatted and displayed through script programs, such as filtering, searching, color marking, etc
In the end, TA also advocates students to build their own Instrumentation instead of using it directly. These codes are also a good learning paradigm, and the source code is pasted at the end of the article in the form of appendix.
Experimental part
Basic settings
My own configuration is that the selection timeout is 400ms and the heartbeat is 50ms. In the last experiment (MapReduce), I used a very troublesome way similar to the middle trigger to realize the countdown processing of Election Timeout. More importantly, I can't encapsulate the implementation well. But the LoC and complexity of this experiment are different from that of the previous experiment. It is estimated that this implementation will go crazy
However, it is much easier to implement the hint in Student Guidance in the way of semi polling. Resetting the countdown can use a method to well encapsulate the processing logic, and update when the countdown will be in the future. Then go ticker() opens a single thread and checks this field every 5ms through sleep() to see if it times out compared with now.
In addition, the design of log is also an important place. If you don't properly encapsulate the logic of log, you may run into a wall in the part of Lab 2D. The reason is that with the snapshot, the firstlogindex of log is not necessarily 0. So choose to use some methods, such as log at(), Log. firstLogIndex(), Log. lastLogIndex(), Log. trimTail(), Log. Encapsulating these operations with trimprefix() can greatly reduce the complexity.
Finally, an auxiliary method newTerm(term int) is added, because Figure 2 requires all servers, whether the sending or receiving end of RPC, to convert the other party's term of office to Follower and update the term of office to the latest term of office as long as they find that the other party's term of office is larger than their own. This operation will be used a total of 6 times (three RPCs, each RPC has Sender and Handler), Therefore, it is necessary to encapsulate this operation:
func (rf *Raft) newTerm(term int) {
    rf.status = Follower
    rf.votedFor = -1
    rf.currentTerm = term
}
Therefore, according to Figure 2 and the related constraints of Raft introduced above, we can naturally write the following pseudo code. It should be noted that all RPC sender s must process the reply in the current term, because if the term changes, it proves that its state has changed. And I ignored some details, such as the new thread of send RPC, the initial capitalization of RPC field, the timing of lock acquisition and release, etc., because there is no skill for a large lock. In addition, I also omit persistence. Anyway, it's ok to persist those non-volatile fields when updating them.
Applier
// Applier go routine

for rf.killed() == false {
    if !rf.hasSnap {
        rf.hasSnap = true // apply snapshot only once
        if rf.snapshot.Snapshot == nil || len(rf.snapshot.Snapshot) < 1 {
            continue
        }

        create and config ApplyMsg
        rf.applicant.applyCh <- msg
    } else if rf.lastApplied + 1 <= rf.commitIndex {
        rf.lastApplied += 1

        create and config ApplyMsg
        rf.applicant.applyCh <- msg
    } else {
        rf.applicant.applierCond.Wait()
    }
}
RequestVoteRPC
Sender
// RequestVote RPC Sender pseudo code

// start a new election
rf.currentTerm += 1
rf.status = Candidate
rf.votedFor = rf.me
// vote for myself
vote := 1

rf.resetElectionTimeout()

for each peer in rf.peers {
    create and config RequestVote RPC Argument and Reply
    send RequestVote RPC Request to this peer

    if args.term == rf.currentTerm {
        if reply.term > rf.currentTerm {
            rf.newTerm(reply.term)
        } else if reply.voteGranted {
            vote += 1
            if vote == len(rf.peers)/2 + 1 {
                rf.conver2Leader() // initialize nextIndex and matchIndex for each peer
                   send AppendEntires RPC to each peer
            }
        }
    }
}
Handler
// RequestVote RPC Handler pseudo code

if args.term > rf.currentTerm {
    rf.newTerm(args.term)
}

if (args.term == rf.currentTerm) && (rf.votedFor == -1 || rf.votedFor == args.candidateId) && isUp2Date {
    rf.cotedFor = args.candidateId
    reply.coteGranted = true
    reply.term = rf.currentTerm
    rf.resetElectionTimeout()
}

reply.Term = rf.CurrentTerm
AppendEntriesRPC
Sender
// AppendEntries RPC Sender pseudo code

rf.resetElectionTimeout()

for each peer in rf.peers {
    if rf.nextIndex[peer] < rf.Log.start() + 1 {
        send InstallSnapshot RPC to this peer
    } else {
        create and config AppendEntries RPC Argument and Reply
        send AppendEntries RPC Request to this peer

        if args.term == rf.currentTerm {
            if reply.term > rf.currentTerm {
                rf.newTerm(reply.term)
            } else if reply.success {
                update nextIndex, matchIndex, commitIndex
                singal applier
            } else {
                update nextIndex
            }
        }
    }
}
Handler
// AppendEntries RPC Handler pseudo code

if args.term > rf.currentTerm {
    rf.newTerm(args.term)
}

if args.term == rf.currentTerm {
    consistency check
    rf.resetElectionTimeout()
}

reply.Term = rf.CurrentTerm
InstallSnapshot
In this part, I thought for a long time about how to pass the snapshot to the upper layer and whether to update the state persistence applied by the snapshot. These two operations are bound together and atomized. Later, I realized that the state of the state machine is volatile. After crash, I have to apply from scratch, so I just need to ensure the persistence of the snapshot.
CondInstallSnapshot() I directly return True, because my design in InstallSnapshot Handler and Applier ensures that no Stale Snapshot will be put into applyCh.
Snapshot
// Client call Snapshot pseudo code

if index < rf.lastApplied {
    return
}

rf.Log.trimPrifix(index)

rf.snapshot.Snapshot = snapshot
rf.snapshot.SnapshotIndex = index
rf.snapshot.SnapshotTerm = rf.Log.at(index).term

rf.hasSnap = false // need to be applied

signal apllier

send InstallSnapshot RPC Request to each peers
Sender
// InstallSnapshot RPC Sender pseudo code

if rf.status != Leader {
    return
}

rf.resetElectionTimeout()

for each peer in rf.peers {
    create and config InstallSnapshot RPC Argument and Reply
    send InstallSnapshot RPC Request to this peer

    if args.term == rf.currentTerm {
        if reply.term > rf.currentTerm {
            rf.newTerm()
        }
    }
}
Handler
// InstallSnapshot RPC Handler pseudo code

if args.term > rf.currentTerm {
    rf.newTerm(args.term)
}

if args.term == rf.currentTerm {
    if args.lastIncludedIndex >= rf.Log.lastIndex() ||
        args.lastIncludedTerm != rf.Log.at(args.lastIncludedIndex).Term {

        rf.Log = makeLog(args.lastIncludedIndex, args.lastIncludedTerm)
        rf.commitIndex = args.lastIncludedIndex
    } else {
        rf.Log.trimPrefix(args.lastIncludedIndex)
    }

    rf.lastApplied = args.lastIncludedIndex

    rf.snapshot.Snapshot = args.data
    rf.snapshot.SnapshotIndex = args.lastIncludedIndex
    rf.snapshot.SnapshotTerm = args.lastIncludedTerm

    rf.hasSnap = false // need to be applied

    signal applier
    rf.resetElectionTime()
}

reply.term = rf.currentTerm
Postscript
Lab 2 has a lot of content. Even if I pass all the tests, I still feel a little confused. After this experiment, I think I can forget everything, but there are six things I can't forget:
- Interaction diagram of Replicated Service and Raft;
- Figure 3 constraints;
- Raft's on how to implement this constraint through these four pointers;
- Consistency Check algorithm in Log Replication;
- Figure 8 what problems have been solved;
- Debug skills.
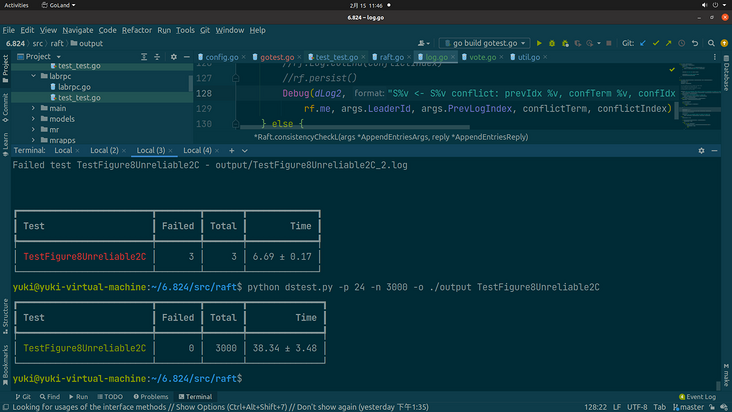
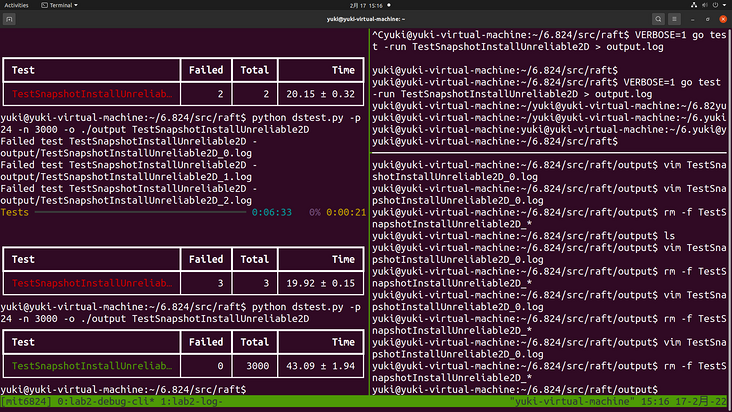
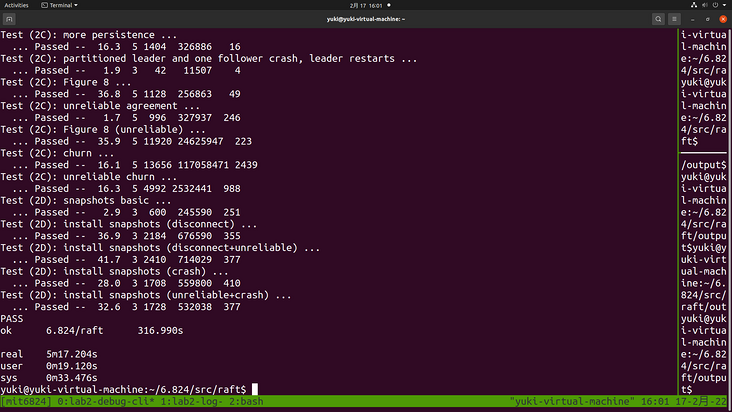
The actual time of a complete test of Lab 2 is 5 minutes, and the actual CPU time is less than 30 seconds, which meets the requirements of Lab 2. When debugging, you should be calm and have a good look at why the test reports errors. If you can't see anything fishy from the log, you must have printed too little log information. Just add more, and leave the rest to the time.
On February 4, it has taken nearly two weeks since I started reading the Raft paper. I feel that the debugging ability has increased
In addition, at the end of the last MapReduce article, I added another three steps about system development, which is also my personal understanding at present:
- Demand analysis: at present, there are problems with similar products on the market, so what functions our system should have is essentially a trade-off of a series of indicators.
- Interface definition: API interface function definition
- Architecture design: there is usually a strong technology space, which needs to comprehensively consider the methods of operation, storage and communication. At this stage, it is necessary to describe how each object of the system operates, and output an architecture diagram and relevant design documents. In order to realize the API and requirements, we need to design the algorithm and data structure of the global and each object application, and give the rationality.
Inner OS:
I thought 6.824 was a course for undergraduates, but it was for master students at MIT
Why is it so voluminous? Is the per capita level too high? The survivor deviation does not apply, right? Is there a mistake???
Reference link
Appendix
Instrumentaion
// ./util.go

package raft

import (
    "fmt"
    "log"
    "os"
    "strconv"
    "time"
)

// Debugging
const debug = 0

func DPrintf(format string, a ...interface{}) (n int, err error) {
    if debug >= 1 {
        log.Printf(format, a...)
    }
    return
}

// Retrieve the verbosity level from an environment variable
func getVerbosity() int {
    v := os.Getenv("VERBOSE")
    level := 0
    if v != "" {
        var err error
        level, err = strconv.Atoi(v)
        if err != nil {
            log.Fatalf("Invalid verbosity %v", v)
        }
    }
    return level
}

type logTopic string

const (
    dClient  logTopic = "CLNT" //
    dCommit  logTopic = "CMIT"
    dDrop    logTopic = "DROP" //
    dError   logTopic = "ERRO"
    dInfo    logTopic = "INFO"
    dLeader  logTopic = "LEAD" //
    dLog     logTopic = "LOG1"
    dLog2    logTopic = "LOG2"
    dPersist logTopic = "PERS"
    dSnap    logTopic = "SNAP"
    dTerm    logTopic = "TERM" //
    dTest    logTopic = "TEST"
    dTimer   logTopic = "TIMR" //
    dTrace   logTopic = "TRCE"
    dVote    logTopic = "VOTE" //
    dWarn    logTopic = "WARN"
)

var debugStart time.Time
var debugVerbosity int

func Init() {
    debugVerbosity = getVerbosity()
    debugStart = time.Now()

    log.SetFlags(log.Flags() &^ (log.Ldate | log.Ltime))
}

func Debug(topic logTopic, format string, a ...interface{}) {
    if debug >= 1 {
        time := time.Since(debugStart).Microseconds()
        time /= 100
        prefix := fmt.Sprintf("%06d %v ", time, string(topic))
        format = prefix + format
        log.Printf(format, a...)
    }
}

func Status2Str(status int) string {
    var res string

    switch status {
    case Follower:
        res = "Follower"
    case Candidate:
        res = "Candidate"
    case Leader:
        res = "Leader"
    default:
        res = "None"
    }

    return res
}
Pretty Print Python script
# ./dslogs.py

#!/usr/bin/env python
import sys
import shutil
from typing import Optional, List, Tuple, Dict

import typer
from rich import print
from rich.columns import Columns
from rich.console import Console
from rich.traceback import install

# fmt: off
# Mapping from topics to colors
TOPICS = {
    "TIMR": "#9a9a99",
    "VOTE": "#67a0b2",
    "LEAD": "#d0b343",
    "TERM": "#70c43f",
    "LOG1": "#4878bc",
    "LOG2": "#398280",
    "CMIT": "#98719f",
    "PERS": "#d08341",
    "SNAP": "#FD971F",
    "DROP": "#ff615c",
    "CLNT": "#00813c",
    "TEST": "#fe2c79",
    "INFO": "#ffffff",
    "WARN": "#d08341",
    "ERRO": "#fe2626",
    "TRCE": "#fe2626",
}
# fmt: on


def list_topics(value: Optional[str]):
    if value is None:
        return value
    topics = value.split(",")
    for topic in topics:
        if topic not in TOPICS:
            raise typer.BadParameter(f"topic {topic} not recognized")
    return topics


def main(
    file: typer.FileText = typer.Argument(None, help="File to read, stdin otherwise"),
    colorize: bool = typer.Option(True, "--no-color"),
    n_columns: Optional[int] = typer.Option(None, "--columns", "-c"),
    ignore: Optional[str] = typer.Option(None, "--ignore", "-i", callback=list_topics),
    just: Optional[str] = typer.Option(None, "--just", "-j", callback=list_topics),
):
    topics = list(TOPICS)

    # We can take input from a stdin (pipes) or from a file
    input_ = file if file else sys.stdin
    # Print just some topics or exclude some topics (good for avoiding verbose ones)
    if just:
        topics = just
    if ignore:
        topics = [lvl for lvl in topics if lvl not in set(ignore)]

    topics = set(topics)
    console = Console()
    width = console.size.width

    panic = False
    for line in input_:
        try:
            time, topic, *msg = line.strip().split(" ")
            # To ignore some topics
            if topic not in topics:
                continue

            msg = " ".join(msg)

            # Debug calls from the test suite aren't associated with
            # any particular peer. Otherwise we can treat second column
            # as peer id
            if topic != "TEST":
                i = int(msg[1])

            # Colorize output by using rich syntax when needed
            if colorize and topic in TOPICS:
                color = TOPICS[topic]
                msg = f"[{color}]{msg}[/{color}]"

            # Single column printing. Always the case for debug stmts in tests
            if n_columns is None or topic == "TEST":
                print(time, msg)
            # Multi column printing, timing is dropped to maximize horizontal
            # space. Heavylifting is done through rich.column.Columns object
            else:
                cols = ["" for _ in range(n_columns)]
                msg = "" + msg
                cols[i] = msg
                col_width = int(width / n_columns)
                cols = Columns(cols, width=col_width - 1, equal=True, expand=True)
                print(cols)
        except:
            # Code from tests or panics does not follow format
            # so we print it as is
            if line.startswith("panic"):
                panic = True
            # Output from tests is usually important so add a
            # horizontal line with hashes to make it more obvious
            if not panic:
                print("#" * console.width)
            print(line, end="")


if __name__ == "__main__":
    typer.run(main)
Concurrent Test script
Python version
Option -- help output prompt information
# ./dstest.py

#!/usr/bin/env python

import itertools
import math
import signal
import subprocess
import tempfile
import shutil
import time
import os
import sys
import datetime
from collections import defaultdict
from concurrent.futures import ThreadPoolExecutor, wait, FIRST_COMPLETED
from dataclasses import dataclass
from pathlib import Path
from typing import List, Optional, Dict, DefaultDict, Tuple

import typer
import rich
from rich import print
from rich.table import Table
from rich.progress import (
    Progress,
    TimeElapsedColumn,
    TimeRemainingColumn,
    TextColumn,
    BarColumn,
    SpinnerColumn,
)
from rich.live import Live
from rich.panel import Panel
from rich.traceback import install

install(show_locals=True)


@dataclass
class StatsMeter:
    """
    Auxiliary classs to keep track of online stats including: count, mean, variance
    Uses Welford's algorithm to compute sample mean and sample variance incrementally.
    https://en.wikipedia.org/wiki/Algorithms_for_calculating_variance#On-line_algorithm
    """

    n: int = 0
    mean: float = 0.0
    S: float = 0.0

    def add(self, datum):
        self.n += 1
        delta = datum - self.mean
        # Mk = Mk-1+ (xk – Mk-1)/k
        self.mean += delta / self.n
        # Sk = Sk-1 + (xk – Mk-1)*(xk – Mk).
        self.S += delta * (datum - self.mean)

    @property
    def variance(self):
        return self.S / self.n

    @property
    def std(self):
        return math.sqrt(self.variance)


def print_results(results: Dict[str, Dict[str, StatsMeter]], timing=False):
    table = Table(show_header=True, header_style="bold")
    table.add_column("Test")
    table.add_column("Failed", justify="right")
    table.add_column("Total", justify="right")
    if not timing:
        table.add_column("Time", justify="right")
    else:
        table.add_column("Real Time", justify="right")
        table.add_column("User Time", justify="right")
        table.add_column("System Time", justify="right")

    for test, stats in results.items():
        if stats["completed"].n == 0:
            continue
        color = "green" if stats["failed"].n == 0 else "red"
        row = [
            f"[{color}]{test}[/{color}]",
            str(stats["failed"].n),
            str(stats["completed"].n),
        ]
        if not timing:
            row.append(f"{stats['time'].mean:.2f} ± {stats['time'].std:.2f}")
        else:
            row.extend(
                [
                    f"{stats['real_time'].mean:.2f} ± {stats['real_time'].std:.2f}",
                    f"{stats['user_time'].mean:.2f} ± {stats['user_time'].std:.2f}",
                    f"{stats['system_time'].mean:.2f} ± {stats['system_time'].std:.2f}",
                ]
            )
        table.add_row(*row)

    print(table)


def run_test(test: str, race: bool, timing: bool):
    test_cmd = ["go", "test", f"-run={test}"]
    if race:
        test_cmd.append("-race")
    if timing:
        test_cmd = ["time"] + cmd
    f, path = tempfile.mkstemp()
    start = time.time()
    proc = subprocess.run(test_cmd, stdout=f, stderr=f)
    runtime = time.time() - start
    os.close(f)
    return test, path, proc.returncode, runtime


def last_line(file: str) -> str:
    with open(file, "rb") as f:
        f.seek(-2, os.SEEK_END)
        while f.read(1) != b"\n":
            f.seek(-2, os.SEEK_CUR)
        line = f.readline().decode()
    return line


# fmt: off
def run_tests(
    tests: List[str],
    sequential: bool       = typer.Option(False,  '--sequential',      '-s',    help='Run all test of each group in order'),
    workers: int           = typer.Option(1,      '--workers',         '-p',    help='Number of parallel tasks'),
    iterations: int        = typer.Option(10,     '--iter',            '-n',    help='Number of iterations to run'),
    output: Optional[Path] = typer.Option(None,   '--output',          '-o',    help='Output path to use'),
    verbose: int           = typer.Option(0,      '--verbose',         '-v',    help='Verbosity level', count=True),
    archive: bool          = typer.Option(False,  '--archive',         '-a',    help='Save all logs intead of only failed ones'),
    race: bool             = typer.Option(False,  '--race/--no-race',  '-r/-R', help='Run with race checker'),
    loop: bool             = typer.Option(False,  '--loop',            '-l',    help='Run continuously'),
    growth: int            = typer.Option(10,     '--growth',          '-g',    help='Growth ratio of iterations when using --loop'),
    timing: bool           = typer.Option(False,   '--timing',          '-t',    help='Report timing, only works on macOS'),
    # fmt: on
):

    if output is None:
        timestamp = datetime.datetime.now().strftime("%Y%m%d_%H%M%S")
        output = Path(timestamp)

    if race:
        print("[yellow]Running with the race detector\n[/yellow]")

    if verbose > 0:
        print(f"[yellow] Verbosity level set to {verbose}[/yellow]")
        os.environ['VERBOSE'] = str(verbose)

    while True:

        total = iterations * len(tests)
        completed = 0

        results = {test: defaultdict(StatsMeter) for test in tests}

        if sequential:
            test_instances = itertools.chain.from_iterable(itertools.repeat(test, iterations) for test in tests)
        else:
            test_instances = itertools.chain.from_iterable(itertools.repeat(tests, iterations))
        test_instances = iter(test_instances)

        total_progress = Progress(
            "[progress.description]{task.description}",
            BarColumn(),
            TimeRemainingColumn(),
            "[progress.percentage]{task.percentage:>3.0f}%",
            TimeElapsedColumn(),
        )
        total_task = total_progress.add_task("[yellow]Tests[/yellow]", total=total)

        task_progress = Progress(
            "[progress.description]{task.description}",
            SpinnerColumn(),
            BarColumn(),
            "{task.completed}/{task.total}",
        )
        tasks = {test: task_progress.add_task(test, total=iterations) for test in tests}

        progress_table = Table.grid()
        progress_table.add_row(total_progress)
        progress_table.add_row(Panel.fit(task_progress))

        with Live(progress_table, transient=True) as live:

            def handler(_, frame):
                live.stop()
                print('\n')
                print_results(results)
                sys.exit(1)

            signal.signal(signal.SIGINT, handler)

            with ThreadPoolExecutor(max_workers=workers) as executor:

                futures = []
                while completed < total:
                    n = len(futures)
                    if n < workers:
                        for test in itertools.islice(test_instances, workers-n):
                            futures.append(executor.submit(run_test, test, race, timing))

                    done, not_done = wait(futures, return_when=FIRST_COMPLETED)

                    for future in done:
                        test, path, rc, runtime = future.result()

                        results[test]['completed'].add(1)
                        results[test]['time'].add(runtime)
                        task_progress.update(tasks[test], advance=1)
                        dest = (output / f"{test}_{completed}.log").as_posix()
                        if rc != 0:
                            print(f"Failed test {test} - {dest}")
                            task_progress.update(tasks[test], description=f"[red]{test}[/red]")
                            results[test]['failed'].add(1)
                        else:
                            if results[test]['completed'].n == iterations and results[test]['failed'].n == 0:
                                task_progress.update(tasks[test], description=f"[green]{test}[/green]")

                        if rc != 0 or archive:
                            output.mkdir(exist_ok=True, parents=True)
                            shutil.copy(path, dest)

                        if timing:
                            line = last_line(path)
                            real, _, user, _, system, _ = line.replace(' '*8, '').split(' ')
                            results[test]['real_time'].add(float(real))
                            results[test]['user_time'].add(float(user))
                            results[test]['system_time'].add(float(system))

                        os.remove(path)

                        completed += 1
                        total_progress.update(total_task, advance=1)

                        futures = list(not_done)

        print_results(results, timing)

        if loop:
            iterations *= growth
            print(f"[yellow]Increasing iterations to {iterations}[/yellow]")
        else:
            break


if __name__ == "__main__":
    typer.run(run_tests)
Shell version
# ./go-test-many.sh
# https://gist.github.com/jonhoo/f686cacb4b9fe716d5aa

#!/bin/bash
#
# Script for running `go test` a bunch of times, in parallel, storing the test
# output as you go, and showing a nice status output telling you how you're
# doing.
#
# Normally, you should be able to execute this script with
#
#   ./go-test-many.sh
#
# and it should do The Right Thing(tm) by default. However, it does take some
# arguments so that you can tweak it for your testing setup. To understand
# them, we should first go quickly through what exactly this script does.
#
# First, it compiles your Go program (using go test -c) to ensure that all the
# tests are run on the same codebase, and to speed up the testing. Then, it
# runs the tester some number of times. It will run some number of testers in
# parallel, and when that number of running testers has been reached, it will
# wait for the oldest one it spawned to finish before spawning another. The
# output from each test i is stored in test-$i.log and test-$i.err (STDOUT and
# STDERR respectively).
#
# The options you can specify on the command line are:
#
#   1) how many times to run the tester (defaults to 100)
#   2) how many testers to run in parallel (defaults to the number of CPUs)
#   3) which subset of the tests to run (default to all tests)
#
# 3) is simply a regex that is passed to the tester under -test.run; any tests
# matching the regex will be run.
#
# The script is smart enough to clean up after itself if you kill it
# (in-progress tests are killed, their output is discarded, and no failure
# message is printed), and will automatically continue from where it left off
# if you kill it and then start it again.
#
# By now, you know everything that happens below.
# If you still want to read the code, go ahead.

if [ $# -eq 1 ] && [ "$1" = "--help" ]; then
    echo "Usage: $0 [RUNS=100] [PARALLELISM=#cpus] [TESTPATTERN='']"
    exit 1
fi

# If the tests don't even build, don't bother. Also, this gives us a static
# tester binary for higher performance and higher reproducability.
if ! go test -c -o tester; then
    echo -e "\e[1;31mERROR: Build failed\e[0m"
    exit 1
fi

# Default to 100 runs unless otherwise specified
runs=100
if [ $# -gt 0 ]; then
    runs="$1"
fi

# Default to one tester per CPU unless otherwise specified
parallelism=$(grep -c processor /proc/cpuinfo)
if [ $# -gt 1 ]; then
    parallelism="$2"
fi

# Default to no test filtering unless otherwise specified
test=""
if [ $# -gt 2 ]; then
    test="$3"
fi

# Figure out where we left off
logs=$(find . -maxdepth 1 -name 'test-*.log' -type f -printf '.' | wc -c)
success=$(grep -E '^PASS$' test-*.log | wc -l)
((failed = logs - success))

# Finish checks the exit status of the tester with the given PID, updates the
# success/failed counters appropriately, and prints a pretty message.
finish() {
    if ! wait "$1"; then
        if command -v notify-send >/dev/null 2>&1 &&((failed == 0)); then
            notify-send -i weather-storm "Tests started failing" \
                "$(pwd)\n$(grep FAIL: -- *.log | sed -e 's/.*FAIL: / - /' -e 's/ (.*)//' | sort -u)"
        fi
        ((failed += 1))
    else
        ((success += 1))
    fi

    if [ "$failed" -eq 0 ]; then
        printf "\e[1;32m";
    else
        printf "\e[1;31m";
    fi

    printf "Done %03d/%d; %d ok, %d failed\n\e[0m" \
        $((success+failed)) \
        "$runs" \
        "$success" \
        "$failed"
}

waits=() # which tester PIDs are we waiting on?
is=()    # and which iteration does each one correspond to?

# Cleanup is called when the process is killed.
# It kills any remaining tests and removes their output files before exiting.
cleanup() {
    for pid in "${waits[@]}"; do
        kill "$pid"
        wait "$pid"
        rm -rf "test-${is[0]}.err" "test-${is[0]}.log"
        is=("${is[@]:1}")
    done
    exit 0
}
trap cleanup SIGHUP SIGINT SIGTERM

# Run remaining iterations (we may already have run some)
for i in $(seq "$((success+failed+1))" "$runs"); do
    # If we have already spawned the max # of testers, wait for one to
    # finish. We'll wait for the oldest one beause it's easy.
    if [[ ${#waits[@]} -eq "$parallelism" ]]; then
        finish "${waits[0]}"
        waits=("${waits[@]:1}") # this funky syntax removes the first
        is=("${is[@]:1}")       # element from the array
    fi

    # Store this tester's iteration index
    # It's important that this happens before appending to waits(),
    # otherwise we could get an out-of-bounds in cleanup()
    is=("${is[@]}" $i)

    # Run the tester, passing -test.run if necessary
    if [[ -z "$test" ]]; then
        ./tester -test.v 2> "test-${i}.err" > "test-${i}.log" &
        pid=$!
    else
        ./tester -test.run "$test" -test.v 2> "test-${i}.err" > "test-${i}.log" &
        pid=$!
    fi

    # Remember the tester's PID so we can wait on it later
    waits=("${waits[@]}" $pid)
done

# Wait for remaining testers
for pid in "${waits[@]}"; do
    finish "$pid"
done

if ((failed>0)); then
    exit 1
fi
exit 0